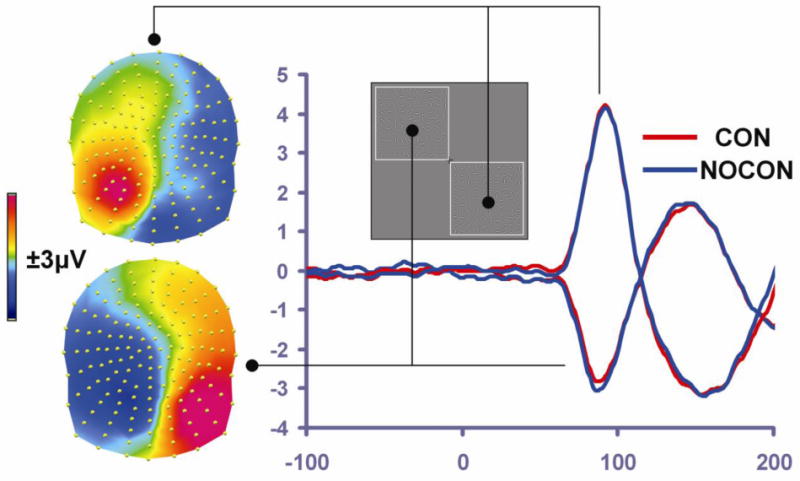
Figure 2. The C1 response.

The scalp topography of the group-averaged C1 response (from 68-100 msec, averaged across CON and NOCON conditions) is presented separately for lower-right presentations (top of left side of panel) and upper-left presentations (bottom of left side of panel). This illustrates clear C1 polarity inversion as a function of stimulus location, consistent with the retinotopic organization of V1/V2. To the right of the scalp topographies, waveforms for CON (red trace) and NOCON (blue trace) conditions illustrate the similarity of the CON and NOCON responses in the C1 timeframe for a given presentation location, and C1 inversion across the lower-right versus upper-left presentations.
