

Abstract
PNAS is one of world's most cited multidisciplinary scientific journals. The PNAS official classification structure of subjects is reflected in topic labels submitted by the authors of articles, largely related to traditionally established disciplines. These include broad field classifications into physical sciences, biological sciences, social sciences, and further subtopic classifications within the fields. Focusing on biological sciences, we explore an internal soft-classification structure of articles based only on semantic decompositions of abstracts and bibliographies and compare it with the formal discipline classifications. Our model assumes that there is a fixed number of internal categories, each characterized by multinomial distributions over words (in abstracts) and references (in bibliographies). Soft classification for each article is based on proportions of the article's content coming from each category. We discuss the appropriateness of the model for the PNAS database as well as other features of the data relevant to soft classification.
The Proceedings is there to help bring new ideas promptly into play. New ideas may not always be right, but their prominent presence can lead to correction. We must be careful not to censor even those ideas which seem to be off beat.
Saunders MacLane (1)
Are there internal categories of articles in PNAS that we can obtain empirically with statistical data-mining tools based only on semantic decompositions of words and references used? Can we identify MacLane's “off-beat” but potentially path-breaking PNAS articles by using these internal categories? Do these empirically defined categories correspond in some natural way to the classification by field used to organize the articles for publication, or does PNAS publish substantial numbers of interdisciplinary articles that transcend these disciplinary boundaries? These are examples of questions that our contribution to the mapping of knowledge domains represented by PNAS explores.
Mathematical and statistical techniques have been developed for analyzing complex data in ways that could reveal underlying data patterns through some form of classification. Computational advances have made some of these techniques extremely popular in recent years. For example, 2 of the 10 most cited articles from 1997-2001 PNAS publications are on applications of clustering for gene-expression patterns (2, 3). The traditional assumption in most methods that aim to discover knowledge in underlying data patterns has been that each subject (object or individual) from the population of interest inherently belongs to only one of the underlying subpopulations (clusters, classes, aspects, or pure type categories). This implies that a subject shares all its attributes, usually with some degree of uncertainty, with the subpopulation to which it belongs. Given that a relatively small number of subpopulations is often necessary for a meaningful interpretation of the underlying patterns, many data collections do not conform with the traditional assumption. Subjects in such populations may combine attributes from several subpopulations simultaneously. In other words, they may have a mixed collection of attributes originating from more than one subpopulation.
Several different disciplines have developed approaches that have a common statistical structure that we refer to as mixed membership. In genetics, mixed-membership models can account for the fact that individual genotypes may come from different subpopulations according to (unknown) proportions of an individual's ancestry. Rosenberg et al. (4) use such a model to analyze genetic samples from 52 human populations around the globe, identifying major genetic clusters without using the geographic information about the origins of individuals. In the social sciences, such models are natural, because members of a society can exhibit mixed membership with respect to the underlying social or health groups for a particular problem being studied. Hence, individual responses to a series of questions may have mixed origins. Woodbury et al. (5) use this idea to develop medical classification. In text analysis and information retrieval, mixed-membership models have been used to account for different topical aspects of individual documents.
In the next section, we describe a class of mixed-membership models that unifies existing special cases (6). We then explain how this class of models can be adapted to analyze both the semantic content of a document and its citations of other publications. We fit this document-oriented mixed-membership model to a subcollection of the PNAS database supplied to the participants in the Arthur M. Sackler Colloquium Mapping Knowledge Domains. We focus in our analysis on a high-level description of the fields in biological sciences in terms of a small number of extreme or basis categories. Griffiths and Steyvers (7) use a related version of the model for abstracts only and attempt a finer level of description.
Mixed-Membership Models
The general mixed-membership model that we work with relies on four levels of assumptions: population, subject, latent variable, and sampling scheme. Population level assumptions describe the general structure of the population that is common to all subjects. Subject-level assumptions specify the distribution of observable responses given individual membership scores. Membership scores are usually unknown and hence can be viewed also as latent variables. The next assumption is whether the membership scores are treated as fixed or random in the model. Finally, the last level of assumptions specifies the number of distinct observed characteristics (attributes) and the number of replications for each characteristic. We describe each set of assumptions formally in turn.
Population Level. Assume there are K original or basis subpopulations in the populations of interest. For each subpopulation k, denote by f(xj|θkj) the probability distribution for response variable j, where θkj is a vector of parameters. Assume that, within a subpopulation, responses to observed variables are independent.
Subject Level. For each subject, membership vector λ = (λ1,..., λK) provides the degrees of a subject's membership in each of the subpopulations. The probability distribution of observed responses xj for each subject is defined fully by the conditional probability  and the assumption that response variables xj are independent, conditional on membership scores. In addition, given the membership scores, observed responses from different subjects are independent.
Latent-Variable Level. With respect to the latent variables, one could assume that they are either fixed unknown constants or random realizations from some underlying distribution.
- If the membership scores λ are fixed but unknown, the conditional probability of observing xj, given the parameters θ and membership scores, is
1 - If membership scores λ are realizations of latent variables from some distribution Dα, parameterized by vector α, then the probability of observing xj, given the parameters, is
2
Sampling Scheme. Suppose R independent replications of J distinct characteristics are observed for one subject,  . Then, if the membership scores are treated as realizations from distribution Dα, the conditional probability is
 |
3 |
When the latent variables are treated as unknown constants, the conditional probability for observing R replications of J variables can be derived analogously. In general, the number of observed characteristics J does not need to be the same across subjects, and the number of replications R does not need to be the same across observed characteristics.
One can derive examples of mixed-membership models from this general set up by specifying different choices of J and R and different latent-variable assumptions. Thus, the “grade-of-membership” model of Manton et al. (8) assumes that polytomous responses are observed to J survey questions without replications and uses the fixed-effects assumption for the membership scores. Potthoff et al. (9) use a variation of the grade-of-membership model by treating the membership scores as Dirichlet random variables; the authors refer to the resulting model as “Dirichlet generalization of latent class models.” Erosheva (6) provides a formal latent-class representation for the grade-of-membership model approach. In genetics, Pritchard et al. (10) use a clustering model with admixture. For diploid individuals, the clustering model assumes that R = 2 replications (genotypes) are observed at J distinct locations (loci), treating the proportions of a subject's genome that originated from each of the basis subpopulations as random Dirichlet realizations. Variations of mixed-membership models for text documents called “probabilistic latent semantic analysis” (11) and “latent Dirichlet allocation” (12) both assume that a single characteristic (word) is observed a number of times for each document, but the former model considers the membership scores as fixed unknown constants, whereas the latter treats them as random Dirichlet realizations.
The mixed-membership model framework presented above unifies several specialized models that have been developed independently in the social sciences, genetics, and text-mining applications. In the text-mining area, initial work by Hofmann (11) on probabilistic latent semantic analysis was followed by the work of Blei et al. (12), who proposed a Dirichlet generating distribution for the membership scores and the use of variational methods to estimate the latent Dirichlet allocation model parameters. Minka and Lafferty (13) developed a more accurate approximation method for this model.
A natural extension of the original analyses in the text-mining area that have been based on a single source is to combine information from multiple sources. Cohn and Hofmann (14) propose a probabilistic model of document content and hypertext connectivity for text documents by considering links (or references) in addition to words, thus essentially combining two distinct characteristics; they treat the membership scores as fixed. Following Cohn and Hofmann, we adopt a mixed-membership model for words and references in journal publications but treat the membership scores as random Dirichlet realizations. Barnard et al. (15) develop similar and alternative approaches for combining different sources of information.
Mixed-Membership Models for Documents
We can use the general model framework for documents consisting of abstracts and references by representing a document as  , where
  is a word (w) in the abstract and
  is a reference (r) in the bibliography, rj = 1,..., Rj. By adopting the “bag-of-words” assumption, we treat the words in each abstract as independent replications of the first observed characteristic (word). Similarly, under the assumption of a “bag of references,” we treat references as independent replications of the second observed characteristic (reference). Thus, the representation of a document consists of word counts n(w, d) (the number of times word w appears in document d) and reference counts n(r, d) (1 if the bibliography of d contains a reference to r, and 0 otherwise). In this context, subpopulations refer to topical aspects.
The parameters θ of our model are: Dirichlet (hyper)parameters α1,..., αK for the generating distribution of the membership scores and aspect multinomial probabilities for words θ1k(w) = p(w|k) and references θ2k(r) = q(r|k), k = 1, 2,..., K.
In the generative model, documents  are sampled according to the following sequence,
 |
4 |
 |
5 |
 |
6 |
where Σw θ1k(w) = 1 and Σr θ2k(r) = 1, k = 1,..., K. Because distributions of words and references in a document are convex combinations of the distributions of the aspects, the aspects can be thought of as extreme or basis categories for a collection of documents. The sampling of words and references in the model can be interpreted also as a latent classification process in which an aspect of origin is drawn first for each word and for each reference in a document, according to a multinomial distribution parameterized by the document-specific membership scores λ, and words and references then are generated from corresponding distributions of the aspects of origin (6). Rather than a mixture of K latent classes, the model can be thought of as a “simplicial mixture” (13) because the word and reference probabilities range over a simplex with corners θ1k and θ2k, respectively.
The likelihood function is thus
 |
7 |
 |
8 |
where integrals are over the (K - 1) simplex.
It is important to note that the assumption of exchangeability among words and references (conditional independence given the membership scores) does not imply joint independence among the observed characteristics. Instead, the assumption of exchangeability means that dependencies among words and references can be explained fully by the membership scores of the documents. For an extended discussion on exchangeability in this context, see ref. 16.
Alternative Model for References
For the analysis of PNAS publications in the next section, we assume multinomial sampling of words and references. Although multinomial sampling is computationally convenient, it is not a realistic model of the way in which authors select references for the bibliography of an article. We briefly describe an example of more realistic generative assumptions for references.
Suppose an article focuses on a sufficiently narrow scientific area. In this case, the authors may have essentially perfect knowledge of the literature, and thus they would pay separate attention to each article in their pool of references as they consider whether to include it in the bibliography. Under these circumstances, given that the pool of references contains R articles, we assume that a document is represented as  , where
  is a word in the abstract, R is the number of references, and x2,..., xR+1 are all references in the pool. Reference counts do not change: they are given by n(r, d) = 1 if the bibliography of d contains a reference to r and by n(r, d) = 0 if otherwise.
Then our model for generating documents would be to sample λ and  , according to Eqs. 4 and 5, and sample xj, j = 2,..., R + 1, according to
 |
9 |
The likelihood function based on this alternative model would not only take into account which documents contain which references, but it also would incorporate the information about which references documents do not contain.
Both the basic model for references and any alternatives still would need to reflect the time ordering on publications and include in the pool of possible references only those that have been published already, perhaps even with a short time lag. However, even such changes are unlikely to produce a “correct” model for citation practices.
Estimating the Model
The primary complication in using a mixed-membership model such as is shown in Eqs. 4-6, in which the membership probabilities are random rather than fixed, is that the integral in Eq. 7 cannot be computed explicitly and therefore must be approximated. Two approximation schemes have been investigated recently for this problem and the associated problem of fitting the model. In the variational approach (12), the mixture terms  are bounded from below in a product form that leads to a tractable integral; the lower bound is then maximized. A related approach, called expectation-propagation (13), also approximates each mixture term in a product form but chooses the parameters of the factors by matching first and second moments. Either of these approximations to the integral (Eq. 7) can be used in an approximate expectation-maximization (EM) algorithm to estimate the parameters of the models. It is shown in ref. 13 that expectation-propagation in general leads to better approximations than the simple variational method for mixed-membership models, although we obtained comparable results with both approaches on the PNAS collection. The results reported below use the variational approximation.
The PNAS Database
The National Academy of Sciences provided the database for the participants of the colloquium. We focused on a subset of all biological sciences articles in volumes 94-98 (Julian years 1997-2001) of PNAS, thereby ignoring articles published in the social and physical sciences unless they have official dual classifications with one classification in the biological sciences. The reason for this narrowing of focus is 2-fold. First, the major share of PNAS publications in recent years represents research developments in the biological sciences. Thus, of 13,008 articles published in volumes 94-98, 12,036 (92.53%) are in the biological sciences. The share of social and physical sciences articles in volumes 94-98 is a much more modest 7.47%. Second, we assume that a collection of articles is characterized by mixed membership in a number of internal categories, and social and physical sciences articles are unlikely to share the same internal categories with articles from the biological sciences. We also automatically ignore other types of PNAS publications such as corrections, commentaries, letters, and reviews, because these are not traditional research reports. Among the biological sciences articles in our database, 11 articles were not processed because they did not have an abstract, and 1 article was not processed because it did not contain any references.
PNAS is one of world's most cited multidisciplinary scientific journals. Historically, when submitting a research paper to PNAS, authors have to select a major category from physical, biological, or social sciences and a minor category from the list of topics. PNAS permits dual classifications between major categories and, in exceptional cases, within a major category. The lists of topics change over time to reflect changes in the National Academy of Sciences sections. PNAS, in its information for authors (revised in June 2002), states that it classifies publications in biological sciences according to 19 topics; the numbers of published articles and numbers of dual-classified articles in each topic are shown in Table 1.
Table 1. Biological sciences publications in PNAS volumes 94-98 by subtopic.
| Topic | n | |
|---|---|---|
| 1 | Biochemistry | 2,578 (33) |
| 2 | Medical sciences | 1,547 (13) |
| 3 | Neurobiology | 1,343 (9) |
| 4 | Cell biology | 1,231 (10) |
| 5 | Genetics | 980 (14) |
| 6 | Immunology | 865 (9) |
| 7 | Biophysics | 636 (40) |
| 8 | Evolution | 510 (12) |
| 9 | Microbiology | 498 (11) |
| 10 | Plant biology | 488 (4) |
| 11 | Developmental biology | 366 (2) |
| 12 | Physiology | 340 (1) |
| 13 | Pharmacology | 188 (2) |
| 14 | Ecology | 133 (5) |
| 15 | Applied biological sciences | 94 (6) |
| 16 | Psychology | 88 (1) |
| 17 | Agricultural sciences | 43 (2) |
| 18 | Population biology | 43 (5) |
| 19 | Anthropology | 10 (0) |
| Total | 11,981 (179) |
The numbers of articles with dual classifications are given in parentheses.
The topic labels provide a classification structure for published materials, and most of the articles are members of only a single topic. For our mixed-membership model, we assume that there is a fixed number of extreme internal categories or aspects, each of which is characterized by multinomial distributions over words (in abstracts) and references (in bibliographies). Aspects are determined from contextual decompositions in such a way that a multinomial distribution of words and references in each document is a convex combination of the corresponding distributions from the aspects. The convex combination for each article is based on proportions of the article's content coming from each category. These proportions, or membership scores, determine soft classifications of articles with respect to internal categories.
Results
Choosing a suitable value for the number of internal categories or aspects, K, in this type of setting is difficult. In our analyses, we focused largely on two versions of the model: one with 8 aspects and the other with 10. The set of parameters in our model is given by multinomial word and reference probabilities for each aspect and by the parameters of Dirichlet distribution, which is a generating distribution for membership scores. There are 39,616 unique words and 77,115 unique references in our data; hence, adding an aspect corresponds to having 39,615 + 77,114 + 1 = 116,730 additional parameters. Because of the large numbers of parameters involved, it is difficult to assess the extent to which the added pair of aspects actually improves the fit of the model to the data. On the basis of a set of preliminary comparisons, we found little to choose between them in fit and greater ease of interpretation for the eight-aspect model. Therefore, we report only the results of the eight-aspect model here.
To determine whether there are certain contexts that correspond to the aspects, we examine the most common words in the estimated multinomial distributions. In Table 2, we report the first 15 of the high-probability words for each aspect, filtering out so-called stop words, words that are generally common in English. An alternative way would be to discard the words from the “stop list” before fitting the model. If the distribution of stop words is not uniform across the internal categories, this alternative approach may potentially produce different results.
Table 2. High-probability words for each aspect.
| Aspect 1 | P | Aspect 2 | P | Aspect 3 | P | Aspect 4 | P | Aspect 5 | P | Aspect 6 | P | Aspect 7 | P | Aspect 8 | P |
|---|---|---|---|---|---|---|---|---|---|---|---|---|---|---|---|
| Ca2+ | 0.0062 | species | 0.0040 | sequence | 0.0024 | development | 0.0034 | residues | 0.0028 | transcription | 0.0060 | IL | 0.0046 | increased | 0.0027 |
| channel | 0.0047 | sequence | 0.0026 | acid | 0.0020 | neurons | 0.0034 | enzyme | 0.0023 | nuclear | 0.0036 | tumor | 0.0040 | receptors | 0.0023 |
| membrane | 0.0047 | sequences | 0.0024 | plants | 0.0018 | brain | 0.0029 | active | 0.0020 | promoter | 0.0031 | activation | 0.0036 | G | 0.0022 |
| channels | 0.0040 | genetic | 0.0024 | cDNA | 0.0017 | mouse | 0.0025 | terminal | 0.0019 | transcriptional | 0.0030 | HIV | 0.0032 | P | 0.0022 |
| receptors | 0.0028 | genome | 0.0022 | mutant | 0.0015 | normal | 0.0024 | amino | 0.0019 | p53 | 0.0029 | apoptosis | 0.0031 | insulin | 0.0018 |
| synaptic | 0.0026 | evolution | 0.0020 | single | 0.0015 | expressed | 0.0021 | RNA | 0.0018 | RNA | 0.0027 | kinase | 0.0028 | effects | 0.0018 |
| neurons | 0.0022 | among | 0.0017 | enzyme | 0.0015 | cortex | 0.0019 | structural | 0.0018 | kinase | 0.0024 | antigen | 0.0026 | increase | 0.0018 |
| G | 0.0021 | population | 0.0016 | plant | 0.0014 | embryonic | 0.0017 | state | 0.0018 | yeast | 0.0024 | virus | 0.0025 | acid | 0.0018 |
| calcium | 0.0021 | most | 0.0016 | identified | 0.0013 | adult | 0.0017 | folding | 0.0017 | function | 0.0022 | gamma | 0.0021 | effect | 0.0016 |
| activation | 0.0020 | chromosome | 0.0015 | amino | 0.0013 | neuronal | 0.0016 | sequence | 0.0017 | activation | 0.0020 | infection | 0.0021 | fold | 0.0016 |
| release | 0.0020 | selection | 0.0015 | expressed | 0.0013 | function | 0.0016 | form | 0.0016 | sequence | 0.0018 | immune | 0.0020 | reduced | 0.0016 |
| kinase | 0.0019 | populations | 0.0014 | mutants | 0.0013 | neural | 0.0015 | peptide | 0.0016 | terminal | 0.0018 | signaling | 0.0018 | treatment | 0.0016 |
| subunit | 0.0019 | three | 0.0014 | molecules | 0.0012 | early | 0.0014 | ATP | 0.0015 | cycle | 0.0018 | death | 0.0017 | glucose | 0.0016 |
| intracellular | 0.0017 | based | 0.0013 | based | 0.0012 | patients | 0.0014 | helix | 0.0015 | mutations | 0.0017 | activated | 0.0017 | mRNA | 0.0015 |
| acid | 0.0016 | variation | 0.0013 | kDa | 0.0011 | functional | 0.0013 | substrate | 0.0015 | factors | 0.0017 | vivo | 0.0017 | rats | 0.0015 |
The following interpretations are based on examination of 50 high-probability words for each aspect. Note that enumeration of the aspects is arbitrary. The first aspect includes words such as Ca2+, kinase, phosphorylation, receptor, and G (protein) channel, which pertain to cell signaling and intracellular signal transduction. It is likely that, in this aspect, signal transduction is considered as applied to neuron signaling as indicated by the words synaptic, neurons, voltage. It is interesting that Ca2+ in the first aspect is the highest-probability contextual word over all the aspects. Frequent words for the second aspect indicate that its context is related to molecular evolution that deals with natural selection on the population and intraspecies level and mechanisms of acquiring genetic traits. Words in aspect 3 pertain mostly to the plant molecular biology area. High-probability words in aspect 4 relate to studies of neuronal responses in mice and humans, which identify this aspect as related to developmental biology and neurobiology. Aspect 5 contains words that can be associated with biochemistry and molecular biology. Words in aspect 6 point to genetics and molecular biology. Frequent words for aspect 7 contain such terms as immune, IL (or interleukin), antigen, (IFN) gamma, and MHC class II, which point to a relatively new area in immunology, namely, tumor immunology. The presence of such words as HIV and virus in aspect 7 indicates a more general immunology content. For aspect 8, words such as increase or reduced, treatment, effect, fold, and P (assuming it stands for P value) correspond to general reporting of experimental results, likely in the area of endocrinology.
As for words, multinomial distributions are estimated for the references that are present in our collection. For estimation, we only need unique indicators for each referenced article. After the model is fitted, attributes of high-probability references for each aspect provide additional information about its contextual interpretation. Table 3 provides attributes of 15 high-probability references for each aspect that were available in the database together with PNAS citation counts (number of times cited by PNAS articles in the database). Notice that, because the model draws from the contextual decomposition, having a high citation count is not necessary for having high aspect probability. In Table 3, high-probability references for aspect 1 are dominated by publications in Nature; references in aspect 7 are mostly Nature, Cell, and Science publications from the mid-1990s.
Table 3. High-probability references by aspect.

For each aspect, the top references are shown in order of decreasing probability, according to the model. The count of each reference in the PNAS collection is shown in the right column (C).
Examining titles of the references (see Table 5, which is published as supporting information on the PNAS web site, www.pnas.org), we see that manuals, textbooks, and references to methodology articles seem to be prominent for many aspects. Thus, among the first 15 high-probability references, all 15 from aspect 3 and more than half from aspect 4 are of this methodological type. In contrast, most high-probability references for aspect 7 are those that report new findings. Titles of the references indicate neurobiology content for aspect 1, molecular evolution for aspect 2, and plant molecular biology for aspect 3, which is in agreement with our conclusions based on high-probability words. For other aspects, titles of high-probability references help us refine the aspects. Thus, aspect 4 mostly pertains to the study of brain development, in particular, via genetic manipulation of mouse embryo. Aspect 5, identified as biochemistry and molecular biology by the words, can be described as protein structural biology by the references. Aspect 6 may be labeled in a more detailed way as “DNA repair, mutagenesis, and cell cycle.” The references for aspects 7 and 8 shift their focuses more toward HIV infection and studies of molecular mechanisms of obesity.
Among frequent references for the eight aspects, there are seven PNAS articles that share a special feature: they were all either coauthored or contributed by a distinguished member of the National Academy of Sciences. In fact, one article was coauthored by a Nobel prize winner, and two were contributed by other Nobelists. Although these articles do not have the highest counts in the database, they are notable for various reasons; e.g., one is on clustering and gene expression (2), and it is also one of the two highly cited PNAS articles on clustering that we mentioned in the Introduction. These seven articles may not necessarily be off-beat, but they may be among those that fulfill MacLane's petition regarding the special nature of PNAS.
From our analysis of high-probability words, it is difficult to determine whether the majority of aspects correspond to a single topic from the official classifications in PNAS biological science publications. To investigate whether there is a correspondence between the estimated aspects and the given topics, we examine aspect loadings (means of posterior membership scores) for each article. Given estimated parameters of the model, the distribution of each article's loadings can be obtained by means of Bayes' theorem. The variational and expectation-propagation procedures provide Dirichlet approximations to the posterior distribution p(λ|d, θ) for each document d. We use the mean of this Dirichlet as an estimate of the weight of the document on each aspect. Histograms of these loadings are provided in Fig. 1 for articles in evolution and genetics. Relatively high histogram bars near zero correspond to the majority of articles having small posterior membership scores for the given aspect. Among the articles published in genetics, some can be considered as full members in aspects 2, 3, 4, and 6, but many have mixed membership in these and other aspects. Articles published in evolution, on the other hand, show a somewhat different behavior: the majority of these articles comes fully from aspect 2.
Fig. 1.

Distributions by aspect of the posterior means of membership scores for articles published in evolution and genetics.
The sparsity of the loadings can be gauged also by the parameters of the Dirichlet distribution, which are estimated as α1 = 0.0195, α2 = 0.0203, α3 = 0.0569, α4 = 0.0346, α5 = 0.0317, α6 = 0.0363, α7 = 0.0411, and α8 = 0.0255. The estimated Dirichlet, which is the generative distribution of membership scores, is “bathtub-shaped” on the simplex; as a result, articles tend to have relatively high membership scores in only a few aspects.
To summarize the aspect distributions for each topic, we provide mean loadings and the graphical representation of these values in Table 4 Upper. Larger values correspond to darker colors, and the values below some threshold are not shown (white) for clarity. As an example, the mean loading of 0.2883 for pharmacology in the first aspect is the average of the posterior means of the membership scores for this aspect over all pharmacology publications in the database. Note that this percentage is based on the assumption of mixed membership and can be interpreted as indicating that 29% of the words in pharmacology articles originate from aspect 1, according to our model.
Table 4. Mean decompositions of aspect membership scores (Lower), together with a graphical representation of this table (Upper).
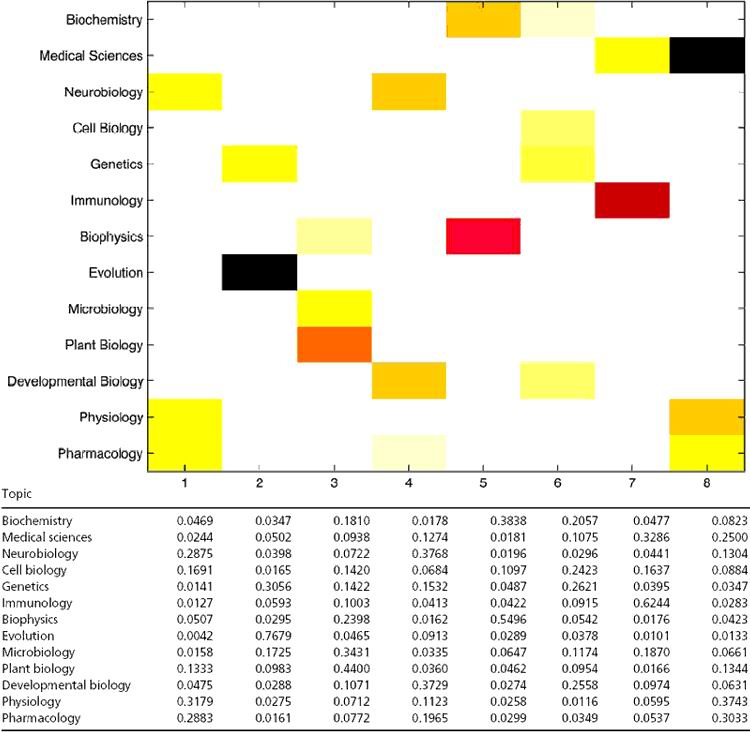
For clarity, the six lowest-frequency topics, which make up 3.4% of the biological sciences articles, are not shown.
Examining the rows of Table 4, we see that most subtopics in biological sciences have major components from more than one aspect (extreme or basis category). Examining the columns, we can gain additional insights in interpretation of the extreme categories. Aspect 8, for example, is the aspect of origin for a combined 37% of physiology, 30% of pharmacology, and 25% of medical sciences articles, according to the mixed-membership model. The most prominent subtopic is evolution; it has the greatest influence in defining an extremal category, aspect 2. This is consistent with a special place that evolution holds among the biological sciences by standing apart both conceptually and methodologically.
Finally, we compare the loadings (posterior means of the membership scores) of dual-classified articles to those that are singly classified. We consider two articles as similar if their loadings are equal for the first significant digit for all aspects. One might interpret singly classified articles that are similar to dual-classified as articles that should have had dual classification but did not. We find that, for 11% of the singly classified articles, there is at least one similar dual-classified article. For example, three biophysics dual-classified articles with loadings 0.9 for the second and 0.1 for the third aspect turned out to be similar to 86 singly classified articles from biophysics, biochemistry, cell biology, developmental biology, evolution, genetics, immunology, medical sciences, and microbiology.
Concluding Remarks
We have presented results from fitting a mixed-membership model to PNAS biological sciences publications, from 1997 to 2001, providing an implicit semantic decomposition of words and references in the articles. The model allows us to identify extreme internal categories of publications and to provide soft classifications of articles into these categories. Our results show that the traditional discipline classifications correspond to a mixed distribution over the internal categories. Our analyses and modeling were intended to capture a high-level description of a subset of PNAS articles.
In an often-quoted statement, Box remarked: “all models are wrong” (17). In our case, the assumption of a bag of words and references in the mixed-membership model clearly oversimplifies reality; the model does not account for the general structure of the language, nor does it capture the compositional structure of bibliographies. Many interesting extensions of the basic model we have explored are possible, from hierarchical models of topics to more detailed models of citations and dynamic models of the evolution of scientific fields over time. Nevertheless, as Box notes, even wrong models may be useful. Our results indicate that mixed-membership models can be useful for analyzing the implicit structure of scientific publications.
Supplementary Material
Acknowledgments
We thank Dr. Anna Lokshin (University of Pittsburgh, Pittsburgh) for help with interpreting model results from a biologist's perspective. E.E. was supported by National Institutes of Health Grants 1 R01 AG023141-01 and R01 CA94212-01; S.F. was supported by National Institutes of Health Grant 1 R01 AG023141-01. J.L. was supported by National Science Foundation Grant CCR-0122581 and Advanced Research and Development Activity Contract MDA904-00-C-2106.
This paper results from the Arthur M. Sackler Colloquium of the National Academy of Sciences, “Mapping Knowledge Domains,” held May 9-11, 2003, at the Arnold and Mabel Beckman Center of the National Academies of Sciences and Engineering in Irvine, CA.
References
- 1.MacLane, S. (1997) Proc. Natl. Acad. Sci. USA 94, 5983-5985.9177152 [Google Scholar]
- 2.Eisen, M. B., Spellman, P. T., Brown, P. O. & Botstein, D. (1998) Proc. Natl. Acad. Sci. USA 95, 14863-14868. [DOI] [PMC free article] [PubMed] [Google Scholar]
- 3.Tamayo, P., Slonim, D., Mesirov, J., Zhu, Q., Kitareewan, S., Dmitrovsky, E., Lander E. S. & Golub, T. R. (1999) Proc. Natl. Acad. Sci. USA 96, 2907-2912. [DOI] [PMC free article] [PubMed] [Google Scholar]
- 4.Rosenberg, N. A., Pritchard, J. K., Weber, J. L., Cann, H. M., Kidd, K. K., Zhivotovsky, L. A. & Feldman, M. W. (2002) Science 298, 2381-2385. [DOI] [PubMed] [Google Scholar]
- 5.Woodbury, M. A., Clive, J. & Garson, A. (1978) Comput. Biomed. Res. 11, 277-298. [DOI] [PubMed] [Google Scholar]
- 6.Erosheva, E. A. (2002) Ph.D. thesis (Carnegie Mellon University, Pittsburgh).
- 7.Griffiths, T. L. & Steyvers, M. (2004) Proc. Natl. Acad. Sci. USA 101, 5228-5235. [DOI] [PMC free article] [PubMed] [Google Scholar]
- 8.Manton, K. G., Woodbury, M. A. & Tolley, H. D. (1994) Statistical Applications Using Fuzzy Sets (Wiley Interscience, New York), p. 312.
- 9.Potthoff, R. G., Manton, K. G., Woodbury, M. A. & Tolley, H. D. (2000) J. Classification 17, 315-353. [Google Scholar]
- 10.Pritchard, J. K., Stephens, M. & Donnelly, P. (2000) Genetics 155, 945-959. [DOI] [PMC free article] [PubMed] [Google Scholar]
- 11.Hofmann, T. (2001) Machine Learn. 42, 177-196. [Google Scholar]
- 12.Blei, D. M., Ng, A. Y. & Jordan, M. I. (2003) J. Machine Learn. Res. 3, 993-1002. [Google Scholar]
- 13.Minka, T. P. & Lafferty, J. (2002) Uncertainty in Artificial Intelligence: Proceedings of the Eighteenth Conference (UAI-2002) (Morgan Kaufmann, San Francisco), pp. 352-359.
- 14.Cohn, D. & Hofmann, T. (2001) Neural Information Processing Systems 13 (MIT Press, Cambridge, MA).
- 15.Barnard, K., Duygulu, P., Forsyth, D., de Freitas, N., Blei, D. M. & Jordan, M. I. (2003) J. Machine Learn. Res. 3, 1107-1135. [Google Scholar]
- 16.Blei, D. M., Jordan, M. I. & Ng, A. Y. (2003) in Bayesian Statistics 7: Proceedings of the Seventh Valencia International Meeting, eds. Bernardo, J. M., Bayarri, M. J., Dawid, A. P., Berger, J. O., Heckerman, D., Smith, A. F. M. & West, M. (Oxford Univ. Press, Oxford), pp. 25-44.
- 17.Box, G. E. P. (1979) in Robustness in Statistics, eds. Launer, R. L. & Wilkinson, G. G. (Academic, New York), p. 202.
Associated Data
This section collects any data citations, data availability statements, or supplementary materials included in this article.