

Abstract
BORCHERS, J. R., K. L. CLEM, D. L. HABASH, H. N. NAGARAJA, L. M. STOKLEY, and T. M. BEST. Metabolic Syndrome and Insulin Resistance in Division 1 Collegiate Football Players. Med. Sci. Sports Exerc., Vol. 41, No. 12, pp. 2105–2110, 2009.
Purpose
To estimate the prevalence of metabolic syndrome and insulin resistance in a cohort of Division 1 collegiate football players.
Methods
Ninety football players were evaluated in a cross-sectional study to estimate the prevalence of metabolic syndrome, insulin resistance, and associated risk factors. Obesity was defined as a body fat ≥25% determined by BOD POD measurements. The National Cholesterol Education Program Adult Treatment Panel III criteria were used to estimate prevalence of metabolic syndrome. Quantitative insulin sensitivity check index calculations were performed to estimate prevalence of insulin resistance. Linear regression techniques were used to determine association between body fat percentage and other measured continuous parameters. Fisher exact test was used to determine association between nominal variables, and one-way ANOVA compared the three groups defined by position.
Results
Summary measures showed a small prevalence of abnormal individual measurements. There was an association between body fat percentage and most evaluated parameters (P < 0.05). The prevalence of obesity, insulin resistance, and metabolic syndrome was 21%, 21%, and 9%, respectively. Obesity is closely associated with metabolic syndrome (P < 0.0001) and insulin resistance (P < 0.0001) in this population. All subjects with metabolic syndrome were obese, and the odds for insulin resistance in the obese group are 10.6 times the odds for the nonobese group. Linemen (n = 29) had 19 of the 19 obese subjects, 13 of the 19 subjects with insulin resistance, and all subjects with metabolic syndrome.
Conclusions
There is a strong association between obesity and both metabolic syndrome and insulin resistance in Division 1 collegiate football players. Linemen are at significant risk for metabolic syndrome and insulin resistance compared with other positions. This may be predictive of future health problems in Division 1 collegiate football players, especially linemen.
Keywords: Obesity, Cardiovascular Risk Factors, Exercise, Diet
American football is a game that emphasizes the importance of size of athletes to be successful. This is especially true for football linemen. There are concerns about morbidity and mortality that may be associated with the increased size of linemen compared with the size of other players in football. Former National Football League (NFL) linemen have an increased risk of cardiovascular disease compared with other players and three times the risk of cardiovascular death compared with other position players (2). This may be directly related to size of football linemen and associated morbidity that accompanies increased size and obesity.
Football linemen of all ages are more obese than their peers that play other positions. Obesity and overweight are more prevalent among young (8–15 yr old) linemen when compared with other position players (13). The prevalence of obesity among high school linemen has been estimated at 45% (12). Collegiate linemen are also increasing in size. In a large study of collegiate athletes evaluating size, football linemen were found to have the largest increase in weight and body mass index (BMI) (26). There are size-related health risks that may affect linemen in these age groups compared with other position players of the same age.
Metabolic syndrome and insulin resistance are two common entities that are associated with long-term morbidity such as premature CHD and type 2 diabetes mellitus (22,25). The metabolic syndrome has been defined as a constellation of variables that predicts premature CAD and type 2 diabetes mellitus. The National Cholesterol Education Program (NCEP) Adult Treatment Panel III (ATP III) has defined criteria on the basis of levels of triglyceride, HDL-C, abdominal obesity, glucose, and blood pressure to define metabolic syndrome in both adolescents and adults (17). An abnormality in three of these five criteria meets the definition of metabolic syndrome. It has been suggested that metabolic syndrome may be a more important risk factor than tobacco use in the future development of CAD (17). Combined with the metabolic derangements of the metabolic syndrome, insulin resistance is an important factor that may potentate the risk of premature CAD and type 2 diabetes mellitus (9).
Obesity is strongly associated with both of these entities in adolescents and young adult populations (1,5,23,24). These two clinical entities have become more concerning as the prevalence of obesity has increased in youth and adolescents. The prevalence of metabolic syndrome in adolescents has been estimated at 3.5% in the United States and is 16 times higher in overweight adolescents (20). In a study of obese French children, the frequency of insulin resistance was 71.9% (7). Clearly, these two problems need to be addressed in at-risk youth and adolescents.
It remains unclear what role physical activity might have for obese individuals in the development of metabolic syndrome or insulin resistance. Adolescents with high activity levels have a reduced rate of metabolic syndrome compared with adolescents with moderate or low activity levels (20). This relationship remains undefined in obese adolescents or young adults that have a high activity level. This may be especially important in youth, adolescent, and young adults that participate in American football secondary to the emphasis placed on increased size to participate.
Division 1 collegiate football players may be at increased risk for development of metabolic syndrome and insulin resistance. Compared with players of the early 1980s and 1990s, current Division 1 football players at all positions have a higher total body mass and body fat (18). Linemen and tight ends were positions found on average to have greater than 25% body fat, and this was distributed most prevalently in the abdominal region (18). It is unknown if this increase in obesity among these position players in Division 1 football puts them at greater risk than other position players for entities such as metabolic syndrome and insulin resistance.
The purpose of this study was to evaluate a cohort of Division 1 collegiate football players to estimate a prevalence of obesity, metabolic syndrome, and insulin resistance among this group. A second purpose of this study was to evaluate the relationship between obesity and metabolic syndrome and insulin resistance in this cohort and the specific risk for linemen compared with other positions for these clinical entities.
Methods
This study was a cross-sectional design with 104 male football players eligible for participation. Ninety players volunteered for the study. The study was conducted at the Ohio State University (OSU) Clinical Research Center (CRC). Approval for the study was received from the Biomedical Institutional Review Board of the OSU before beginning the study. All participants provided written informed consent to participate in the study.
Procedures
Participants were asked to arrive at the OSU Clinical Research Center between 6 and 9 a.m. for a single 2-h study visit that occurred between August and October 2007. Participants arrived approximately 10 h postprandial and in a well-hydrated state. Measures of hydration status were not completed. Vigorous physical activity was performed approximately 12–15 h before the test. No foods were consumed during the 2-h testing period, and water was provided to assist with hydration upon arrival at the research center.
Demographic information, medical and family chronic disease history, resting blood pressure, fasting blood sample, anthropometrics (height, weight, and waist circumference), and body density with air displacement plethysmography (ADP) for the estimation of percent body fat were obtained during this visit.
Anthropometrics/body fat
Body weight was obtained for each participant from the ADP scale (Life Measurement, Inc., Concord, CA) to the nearest 0.01 kg during the ADP procedure. Height was obtained to the nearest 0.1 cm with participants in stocking feet using the Harpenden Stadiometer (Holtain, Ltd., Crymych, Dyfed, United Kingdom). Waist circumference was obtained at the level of the iliac crest by a single practitioner for all participants according to a previously described standard procedure (8). Waist circumference measurements were obtained to the nearest 1.0 mm in triplicate or until duplicate agreement with a linen tape measure (Pfister Import-Export, Inc., Carlstadt, NJ).
ADP
Body density was estimated with ADP in the BOD POD (Life Measurement, Inc.). While wearing athletic spandex and swim caps, the subjects followed manufacturer-specific standard procedures for measurement of body volume and estimation of body density (6). Volume of gas in the lungs was predicted with the algorithms provided by Life Measurement, Inc. These values were then applied to ethnic-specific equations (Brozek equation if the participant was Caucasian; Shutte equation if the participant was African American) to obtain values for fat mass (FM), fat-free mass (FFM), and percent body fat (%BF). The intraclass correlation coefficient (ICC) for these measurements in this sample was 0.989. Obesity was defined in this population as %BF ≥25%.
Blood pressure/laboratory blood values
Participants sat quietly for 10 min in clinical chair recliners before blood pressure measurements and blood draw. A sphygmomanometer cuff was placed over the upper midarm that was resting on the chair arm at the level of the heart, and blood pressure was taken with an automated blood pressure system (Accutorr Plus; Datascope, Mahwah, NJ).
Using standard aseptic technique, a standard butterfly was used to draw a 20-mL sample of venous blood from an antecubital vein. Blood samples were centrifuged, frozen, and analyzed for fasting glucose and insulin levels, total cholesterol, HDL, LDL, and triglycerides.
Serum samples were analyzed for glucose concentration using Immobilized Enzyme Technology on the YSI2300 Stat Plus Glucose and Lactate Analyzer (YSI International, Yellow Springs, OH), which was calibrated every 60 min during sample analysis. The assay coefficient of variation (CV) was 2%, and sensitivity was 2.5 mg.dL−1. Insulin concentration in serum samples was obtained using chemiluminescence on the Immulite 1000 (Diagnostic Products, Corp., Los Angeles, CA). Sensitivity of this assay was 2 μIU.mL−1, and intra-assay CV was 5.7%. Interassay CV was 6.7%.
Serum was diluted and processed automatically through the Synchron LS Systemn (Beckman Coulter, Fullerton, CA) using immunoassay for cholesterol, HDL, and triglycerides; LDL cholesterol was calculated using the Friedewald formula. Sensitivity of this assay was 5 mg.dL−1 with the inter-assay CV compared with the intra-assay CV was 1.31% and 1.48%, respectively, for cholesterol and 1.83% and 2.57% for HDL. Sensitivity of the triglyceride assay was 10 mg.dL−1, and CV for intra-assay variability compared with interassay variability was 1.83% and 2.07%, respectively.
Metabolic syndrome/insulin resistance criterion
The metabolic syndrome was defined using criteria from the NCEP ATP III clinical definition (17). The clinical definition of metabolic syndrome requires three of the following: 1) abdominal obesity (waist circumference, > 102 cm in men), 2) high triglyceride level (≥150 mg.dL−1), 3) low HDL cholesterol level (<40 mg.dL−1), 4) high blood pressure (systolic (SBP), ≥130 mm Hg; diastolic (DBP) ≥85 mm Hg), and 5) high fasting glucose concentration (≥110 mg.dL−1).
Insulin resistance was defined using the quantitative insulin sensitivity check index (QUICKI) calculations (10). This surrogate measure for insulin resistance is determined from the fasting insulin and glucose by the following formula: 1 / log insulin (μIU.mL−1) + log glucose (mg.dL−1). Insulin resistance was defined as a QUICKI value of <0.33.
Grouping of players
Players were grouped for data analysis on the basis of size and similarity of positions played. This was done to determine whether there were differences among groups of players of similar size and skill set within the team. Players were grouped for analysis as follows: offensive and defensive linemen (group A), wide receivers and defensive backs (group B), and tight ends, linebackers, quarterbacks, punters, and kickers (group C).
Data analysis
Demographic data were summarized for all participants. Summary statistics were calculated for individual variables. Linear regression techniques were used to determine the association between body fat percentage and other measured continuous variables. Fisher exact test was used to determine the association between nominal variables. Body fat percentage means across the three groups were compared using one-way ANOVA and Tukey–Kramer honestly significant difference test. Level of significance was P ≤ 0.05 for all statistical analyses. All data analyses were performed using SAS JMP version 7 (SAS Institute, Cary, NC).
Results
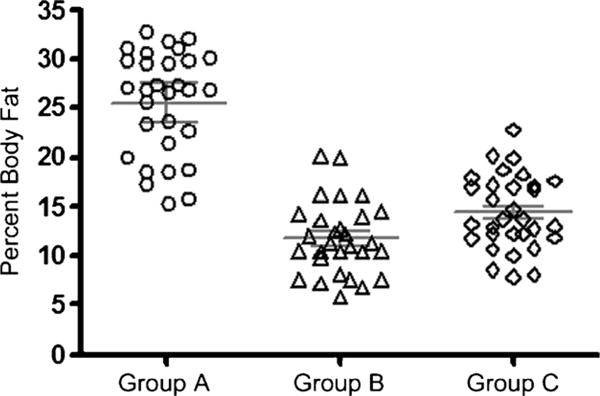
The participant sample consisted of 90 Division 1 football players (of 104 players eligible for study; 87% participation). Demographic data for the participant sample are presented in Table 1. Percent body fat (%BF) for the entire sample is presented in Figure 1. The prevalence of overweight (%BF = 20.0%–24.9%) in this sample was 8%, and the prevalence of obesity (%BF >25.0%) was 21%. Figure 2 presents %BF for all participants by position. All of the participants classified as obese in this participant sample were linemen.
Table 1.
Demographics/measured individual variables.
| Characteristics | Mean ± SD (n = 90) |
|---|---|
| Age (yr) | 20.10 ± 1.61 |
| Height (cm) | 187.0 ± 6.24 |
| Weight (kg) | 105.3 ± 19.78 |
| BMI (kg.m−2) | 29.93 ± 4.32 |
| %BF (by BOD POD) | 17.29 ± 7.37 |
| Group A (n = 30)* | 25.62 ± 5.25 |
| Group B (n = 29) | 11.73 ± 3.68 |
| Group C (n = 31) | 14.42 ± 3.77 |
| SBP (mm Hg) | 126.70 ± 12.49 |
| DBP (mm Hg) | 70.24 ± 8.55 |
| Glucose (mg.dL−1) (n = 89) | 85.50 ± 5.98 |
| Insulin (n = 89) | 9.01 ± 5.74 |
| HbA1c (mg.dL−1) | 5.44 ± 0.30 |
| Cholesterol (mg.dL−1) | 161.87 ± 25.78 |
| HDL-C (mgIdL−1) | 39.36 ± 8.97 |
| LDL (mg.dL−1) | 106.08 ± 23.95 |
| Triglycerides | 82.56 ± 46.34 |
| Waist circumference (inches) | 95.28 ± 13.22 |
| QUICKI (n = 89) | 0.36 ± 0.03 |
| Race | 44% African American; 56% Caucasian |
A, offensive and defensive linemen; B, wide receivers and defensive backs; C, tight ends, linebackers, quarterbacks, kickers, and punters.
Figure 1. —Body fat distribution.
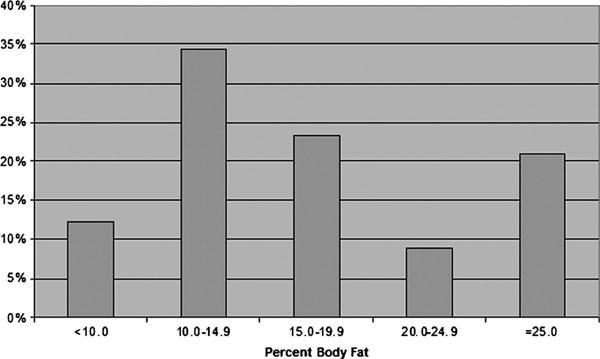
Figure 2. —Group comparisons of body fat distributions (with mean and 95% CI).
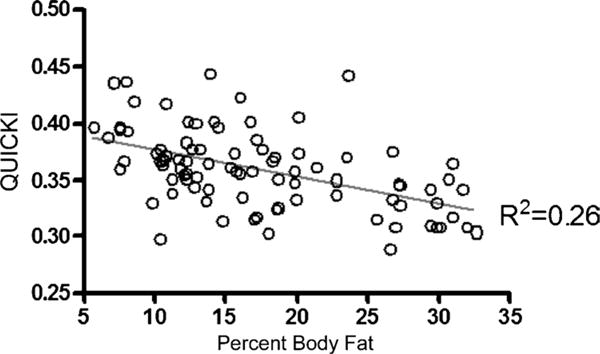
Individual variables used to determine prevalence of metabolic syndrome and insulin resistance were assessed for all subjects. The means and SD for these variables are presented in Table 1. Definitions for normal and abnormal values were determined for all individual variables. The prevalence for abnormal individual variable values for the entire sample is presented in Table 2. The individual variables were assessed for association with %BF, and this is presented in Table 3. Only fasting glucose, DBP, and hemoglobin (Hb) A1c were not associated with %BF (P > 0.05). All other independent variables were associated with %BF (P ≤ 0.05). A scatter plot for QUICKI versus %BF is presented in Figure 3. This is a representation of the relationship between the individual variables and %BF for which there was a significant association.
Table 2.
Morbidity indicators.
| Characteristics | Percent (%) |
|---|---|
| %BF ≥25% | 21.1 |
| SBP ≥130 mm Hg | 44.4 |
| DBP ≥85 mm Hg | 3.3 |
| Fasting insulin >15 μIU.mL−1 | 15.7 |
| Fasting glucose ≥100 mg.dL−1 | 1.1 |
| HbA1c ≥6.0 mg.dL−1 | 5.7 |
| Total cholesterol ≥200 mg.dL−1 | 9.0 |
| LDL | |
| <100 mg.dL−1 | 46.1 |
| 100–160 mg.dL−1 | 49.4 |
| >160 mg.dL−1 | 4.5 |
Table 3.
Individual variables association with %BF.
| Parameters | Slope (BF) | P |
|---|---|---|
| SBP | 0.5733 | 0.0011 |
| DBP | 0.1671 | NS (0.1755) |
| Glucose | 0.1373 | NS (0.1106) |
| Insulin | 0.4015 | <0.0001 |
| HbA1c | −0.0079 | NS (0.0641) |
| Cholesterol | 1.4481 | <0.0001 |
| HDL-C | −0.4919 | <0.0001 |
| LDL | 1.5456 | <0.0001 |
| Triglycerides | 1.9531 | 0.0029 |
| Waist circumference | 1.6676 | <0.0001 |
| QUICKI | −0.0024 | <0.0001 |
NS, not significant.
Figure 3. —Plot of QUICKI versus %BF.
The prevalence of insulin resistance (QUICKI ≤ 0.33) in this sample was 21% (n = 19). Linemen accounted for 68% of players meeting criteria for insulin resistance. The association between obesity and insulin resistance in this sample is presented in Table 4. There is a strong association between obesity and insulin resistance in this sample (Fisher exact test, P < 0.0001; odds ratio = 10.66, 95% confidence interval (CI) = 3.30–34.37).
Table 4.
Prevalence of insulin resistance and %BF.
| Obese (>25% BF) | Insulin Resistance (QUICKI <0.33) | |
|---|---|---|
|
| ||
| Yes | No | |
| Yes | 11 (57.9%) | 8 (42.1%) |
| No | 8 (11.4%) | 62 (88.6%) |
The prevalence of metabolic syndrome (NCEP ATP III criteria) in this sample was 9% (n = 8). Linemen accounted for 100% of the players meeting criteria for the metabolic syndrome. The association between obesity and metabolic syndrome in this sample is presented in Table 5. There is a strong association between obesity and the metabolic syndrome in this sample (Fisher exact test, P < 0.0001).
Table 5.
Association of the metabolic syndrome and %BF.
| Obese (>25% BF) | Metabolic Syndrome (ATP III) | |
|---|---|---|
|
| ||
| Yes | No | |
| Yes | 8 (42.1%) | 11 (57.9%) |
| No | 0 (0%) | 70 (100%) |
Discussion
The purpose of this study was to estimate the prevalence of the metabolic syndrome and insulin resistance in a cohort of Division 1 collegiate football players and to evaluate the association of obesity to these entities and independent morbidity variables. The results of this study suggest that linemen are at a significant increased risk of developing metabolic syndrome and insulin resistance compared with other position players in this cohort. This may have future impact on cardiovascular disease risk for linemen specifically.
The overall prevalence of obesity in this study cohort was 21%, and all of the obese participants were linemen. Obesity was defined by %BF measurements in this cohort because use of a conventional measure such as BMI is not valid as an indicator for obesity in a strength-trained population such as collegiate football players (11,14,19). The determination of obesity in this cohort was via BOD POD measurement that has been previously validated as a reliable measure of %BF in collegiate football players (4). The mean %BF for linemen in this study was in the obese range (25.62 kgIm−2) and was significantly greater than all other position players. The prevalence of obesity in this study population is similar to the prevalence of obesity in similar cohorts of Division 1 football players, and linemen are at a consistently increased risk of obesity compared with other position players (14).
The prevalence of the metabolic syndrome in this population was relatively low (9%) compared with the estimated overall prevalence of metabolic syndrome in US men reported in the National Health and Nutrition Examination Survey (NHANES) III report (22.6%) (21). The prevalence of the metabolic syndrome in obese participants (linemen) in this study (42.1%) and in the NHANES III data (59.6%) was significantly higher than the overall population prevalence of the metabolic syndrome in both groups. The significant increase in the prevalence of the metabolic syndrome in the obese participants in this study (33.1%) is consistent with the increase in the metabolic syndrome in the NHANES III report (37%). This suggests that obesity itself may confer a similar risk for the metabolic syndrome in this cohort as it does in the general population. This result also suggests that, although Division 1 collegiate football linemen are participating in regular high-intensity exercise, there is still a significant risk of developing the metabolic syndrome. High-intensity exercise in this population does not seem to reduce the risk of developing the metabolic syndrome associated with obesity.
It is important to consider that the increased prevalence of the metabolic syndrome and insulin resistance in linemen may have an impact on their future health. A recent study of retired NFL players showed that the metabolic syndrome was more than two times as prevalent in retired linemen compared with other position players (15). There may be a direct correlation between this finding and the increased risk retired NFL linemen have for earlier mortality and for cardiovascular death compared with other retired NFL position players. The results of our study suggest that this risk may extend to collegiate linemen compared with other collegiate football players and that further study is needed to evaluate the risk of collegiate linemen compared with other position players once their collegiate career is finished. Clinicians working with these athletes should provide appropriate counseling and education regarding obesity and associated health risks to collegiate linemen at the completion of their careers.
The definitions of the metabolic syndrome and insulin resistance were specifically defined for our study based on easily obtaining participant data during a single participant interaction. The NCEP ATP III guidelines for the metabolic syndrome are easily defined in a clinical setting from simple anthropometric and laboratory measurements. These criteria are applicable to our population and were easily measured. The definition of insulin resistance in this study was based on the QUICKI formula because it can be derived from the measurement of simple fasting glucose and insulin values. This measurement has been validated as reliable in the clinical setting and has been suggested as the most appropriate test for determination of insulin sensitivity in large epidemi-ological and clinical studies (16).
The limitations of this study are, in large part, related to the cross-sectional design of the study. It is inappropriate to infer temporality from this study as with any cross-sectional analysis. Specifically, there is a significant relationship between obesity and the metabolic syndrome and insulin resistance in this study but it is difficult to suggest a cause and effect association from this cross-sectional study. As previously noted, there has been prior studies supporting the role of obesity in developing these two clinical conditions and we assume that a similar relationship exists in this population. This study is limited to reporting disease prevalence data, and the incidence of disease occurrence in this population cannot be inferred from this study. Future study is needed to follow collegiate players over time to determine the incidence of these clinical conditions during the players' collegiate careers.
The study population in our study was limited to Division 1 collegiate football athletes, and it may not be appropriate to generalize these results to other levels of collegiate football athletes (Division 2 and 3, National Association of Intercollegiate Athletes, etc.). Buell et al. (3) have recently reported on the presence of metabolic syndrome in collegiate linemen from National Collegiate Athletic Association Divisions 1, 2, and 3 universities. This study did not compare linemen to other position players and had lower participation in Divisions 1 and 3 linemen compared with Division 2 linemen. The results of this study indicated a high prevalence of metabolic syndrome in this study sample (34/70; 48.6%). The results of this study along with our study suggest that further evaluation in other levels of collegiate football players is needed to determine whether linemen are at a similar increased risk of metabolic syndrome and insulin resistance compared with other position players.
This study is the first to report on the prevalence of the metabolic syndrome and insulin resistance in a large cohort of Division 1 collegiate football players. There is a clear association between obesity and these two clinical conditions in this population. Offensive and defensive linemen comprise all of the obese participants in this study and are at a significantly increased risk of insulin resistance and the metabolic syndrome compared with other position players. The risk of developing the metabolic syndrome and insulin resistance needs to be considered as emphasis is placed on the increased size of football players at all levels. Counseling and education on lifestyle modification, exercise, and diet are paramount for linemen to decrease their risk of the metabolic syndrome and insulin resistance both during and after their collegiate careers.
Acknowledgments
This study was supported by Clinical and Translational Science Award (CTSA) Number UL1RR025755 from the National Center for Research Resources. The content is solely the responsibility of the authors and does not necessarily represent the official views of the National Center For Research Resources or the National Institutes of Health. The CTSA program is supported by the National Institutes of Health Roadmap for Medical Research.
The authors thank the entire CRC staff at the Ohio State University for their research skill and expertise during the design and conduct of the study; Doug Calland, Robert Sweeney, and Chris Brown and the Athletic Training Staff of the Ohio State University Athletic Department for cooperation with this study; and Dara Schuster, M.D., for guidance with the study protocol.
Footnotes
None of the authors of this article have any conflicts of interest or financial conflicts to disclose. James R. Borchers, M.D., M.P.H., had full access to all of the data in the study and takes responsibility for the integrity of the data and the accuracy of the data analysis.
The results of this present study do not constitute endorsement by American College of Sports Medicine.
References
- 1.Alexander CM, Landsman PB, Grundy SM. The influence of age and body mass index on the metabolic syndrome and its components. Diabetes Obes Metab. 2008;10:246–50. doi: 10.1111/j.1463-1326.2006.00695.x. [DOI] [PubMed] [Google Scholar]
- 2.Baron S, Rinsky R. NIOSH Mortality Study of NFL Football Players: 1959-1988. Cincinnati (OH): Centers for Disease Control, National Institute for Occupational Safety and Health; 1994. p. 13. [Google Scholar]
- 3.Buell JL, Calland D, Hanks F, et al. Presence of metabolic syndrome in football linemen. J Athl Train. 2008;43:608–16. doi: 10.4085/1062-6050-43.6.608. [DOI] [PMC free article] [PubMed] [Google Scholar]
- 4.Collins MA, Millard-Stafford ML, Sparkling PB, et al. Evaluation of the BOD POD® for assessing body fat in collegiate football players. Med Sci Sports Exerc. 1999;31(9):1350–6. doi: 10.1097/00005768-199909000-00019. [DOI] [PubMed] [Google Scholar]
- 5.Csabi G, Torok K, Jeges S, Molnar D. Presence of metabolic cardiovascular syndrome in obese children. Eur J Pediatr. 2000;159:91–4. doi: 10.1007/pl00013812. [DOI] [PubMed] [Google Scholar]
- 6.Dempster P, Aitkens S. A new air displacement method for the determination of human body composition. Med Sci Sports Exerc. 1995;12(12):1692–7. [PubMed] [Google Scholar]
- 7.Druet C, Dabbast M, Baltaskse V, et al. Insulin resistance and the metabolic syndrome in obese French children. Clin Endrocrinol. 2006;64:672–8. doi: 10.1111/j.1365-2265.2006.02526.x. [DOI] [PubMed] [Google Scholar]
- 8.Calloway CW, Chumlea WC, Bouchard C, et al. Circumferences. In: Lohman TG, Roche AF, Martorell R, editors. Anthrometric Standardization Reference Manual. Champaign (IL): Human Kinetics Books; 1988. pp. 39–54. [Google Scholar]
- 9.Kahn BB, Flier JS. Obesity and insulin resistance. J Clin Invest. 2000;106:473–81. doi: 10.1172/JCI10842. [DOI] [PMC free article] [PubMed] [Google Scholar]
- 10.Katz A, Nambi SS, Mather K, et al. Quantitative insulin sensitivity check index: a simple, accurate method for assessing insulin sensitivity in humans. J Clin Endocrinol Metab. 2000;85:2402–10. doi: 10.1210/jcem.85.7.6661. [DOI] [PubMed] [Google Scholar]
- 11.Kreamer WJ, Torine JC, Silvestre R, et al. Body size and composition of National Football League players. J Strength Cond Res. 2005;19:485–9. doi: 10.1519/18175.1. [DOI] [PubMed] [Google Scholar]
- 12.Laurson KR, Eisenmann JC. Prevalence of overweight among high school football linemen. JAMA. 2007;297:363–4. doi: 10.1001/jama.297.4.363. [DOI] [PubMed] [Google Scholar]
- 13.Malina RM, Morano PJ, Barron M, et al. Overweight and obesity among youth participants in American football. J Pediatr. 2007;151:378–82. doi: 10.1016/j.jpeds.2007.03.044. [DOI] [PubMed] [Google Scholar]
- 14.Mathews EM, Wagner DR. Prevalence of overweight and obesity in collegiate American football players, by position. J Am Coll Health. 2008;57:33–7. doi: 10.3200/JACH.57.1.33-38. [DOI] [PubMed] [Google Scholar]
- 15.Miller MA, Croft LB, Belanger AR, et al. Prevalence of metabolic syndrome in retired National Football League football players. Am J Cardiol. 2008;101:1281–4. doi: 10.1016/j.amjcard.2007.12.029. [DOI] [PubMed] [Google Scholar]
- 16.Muniyappa R, Lee S, Chen H, Quon MJ. Current approaches for assessing insulin sensitivity and resistance in vivo: advantages, limitations and appropriate usage. Am J Physiol Endocrinol Metab. 2008;294:E15–26. doi: 10.1152/ajpendo.00645.2007. [DOI] [PubMed] [Google Scholar]
- 17.National Cholesterol Education Program. Detection, Evaluation, and Treatment of High Blood Cholesterol in Adults (Adult Treatment Panel III): Full Report. Bethesda (MD): National Institutes of Health; 2001. p. II-27. NIH publication No. 01-3670. [Google Scholar]
- 18.Noel MB, VanHeest JL, Zaneteas P, Rodgers CD. Body composition in Division I football players. J Strength Cond Res. 2003;17:228–37. doi: 10.1519/1533-4287(2003)017<0228:bcidif>2.0.co;2. [DOI] [PubMed] [Google Scholar]
- 19.Ode JJ, Pivarnik JM, Reeves MJ, Knous JL. Body mass index as a predictor of percent fat in college athletes and nonathletes. Med Sci Sports Exerc. 2007;39(3):403–9. doi: 10.1249/01.mss.0000247008.19127.3e. [DOI] [PubMed] [Google Scholar]
- 20.Pan Y, Pratt CA. Metabolic syndrome and its association with diet and physical activity in US adolescents. J Am Diet Assoc. 2008;108:276–86. doi: 10.1016/j.jada.2007.10.049. [DOI] [PubMed] [Google Scholar]
- 21.Park YW, Zhu S, Palaniappan L, et al. The metabolic syndrome: prevalence and associated risk factor findings in the US population from the Third National Health and Nutrition Examination Survey, 1988–1994. Arch Intern Med. 2003;163:427–36. doi: 10.1001/archinte.163.4.427. [DOI] [PMC free article] [PubMed] [Google Scholar]
- 22.Reaven GM. Role of insulin resistance in human disease. Diabetes. 1988;37:1595–607. doi: 10.2337/diab.37.12.1595. [DOI] [PubMed] [Google Scholar]
- 23.Srinivasan S, Meyers, Berenson G. Predictability of childhood adiposity and insulin for developing insulin resistance syndrome (syndrome X) in young adulthood: the Bogalusa Heart Study. Diabetes. 2002;51:204–9. doi: 10.2337/diabetes.51.1.204. [DOI] [PubMed] [Google Scholar]
- 24.Weiss R, Dziura J, Burgert TS, et al. Obesity and the metabolic syndrome in children and adolescents. N Engl J Med. 2004;350:2362–74. doi: 10.1056/NEJMoa031049. [DOI] [PubMed] [Google Scholar]
- 25.Wison PWF, Kannel WB, Silbershatz H, D'Agostino RB. Clustering of metabolic factors and coronary heart disease. Arch Intern Med. 1999;159:1104–9. doi: 10.1001/archinte.159.10.1104. [DOI] [PubMed] [Google Scholar]
- 26.Yamamoto JB, Yamamoto BE, Yamamoto PP, Yamamoto LG. Epidemiology of college athletes sizes, 1950s to current. Res Sports Med. 2008;16:111–27. doi: 10.1080/15438620802103320. [DOI] [PubMed] [Google Scholar]