Abstract
The Phasic Electromyographic Metric (PEM) has been recently introduced as a sensitive indicator to differentiate Parkinson’s Disease (PD) patients from controls, non-PD patients with a history of Rapid Eye Movement Disorder (RBD) from controls, and PD patients with early and late stage disease. However, PEM assessment through visual inspection is a cumbersome and time consuming process. Therefore, a reliable automated approach is required so as to increase the utilization of PEM as a reliable and efficient clinical tool to track PD progression. In this study an automated method for the detection of PEM is presented, based on the use of signal analysis and pattern recognition techniques. The results are promising indicating that an automatic PEM identification procedure is feasible.
I. Introduction
Rapid Eye Movement Behavior Disorder (RBD) refers to a neurodegenerative condition in which patients act out their dreams and engage in potentially disruptive, injurious and even dangerous behavior while asleep [1]–[3]. Clinical reports of RBD have been shown to anticipate the development of neurodegenerative conditions like Parkinson’s Disease (PD) by 20 years or more [4]–[6]. Despite this potential prognostic significance for human disease, clinical Sleep Medicine lacks an accepted computerized approach to quantify muscle activity in sleep.
This study focuses on the detection of the phasic electromyographic metric (PEM), a measure of muscle activity. Bliwise et al. has provided evidence based on traditional visual analyses from “expert” scorers that PEM recorded during sleep is a sensitive indicator: a) to differentiate PD patients from controls [7]; b) to distinguish non-PD patients with a history of RBD from controls [8]; and c) to differentiate PD patients with early and late stage disease [9]. These outcomes suggest that computer-aided PEM detection is promising for clinicians to determine prognosis, track disease course, and, potentially, monitor treatment of RBD and PD patients.
Although several processing schemes (visual and computerized) have been implemented to distinguish between excessive and normal EMG/PEM activity occurring in REM sleep [1], [7], [10]–[14], no accepted methodologies for standard clinical practice of PEM differentiation exist [15]. Contributing to this problem is the fact that a large amount of variability exists within the previously investigated methods, impeding acceptance of a standardized EMG activity processing scheme. These issues include analysis approach (visual vs. computerized), EMG channel(s) investigated (chin, fingers, toes, forearms, and legs), EMG activity type (tonic vs. phasic), and mini-epoch analysis size (2.5 seconds, 3.0 seconds, and 1.0 seconds) [1], [7], [11]–[13].
In comparing previous EMG channels for muscle activity analysis, visual chin EMG has provided the highest performance rating for RBD identification (94.4% identification rate) [1]. However, this approach is labor intensive and is plagued by inherent biases, which include low intra and inter-rater reliability in both video and EMG activity interpretation for RBD identification. The work presented in this paper is significant because it addresses labor intensiveness and inter-rater reliability concerns by offering an efficient computerized EMG processing scheme.
Although performance ratings for singular EMG channel analysis for visual (chin 72.0–94.4%) and computerized methods (chin 62.8–87.0%) have been reported [11], [12], [14], [1], Iranzo et al. has observed that EMG activity in some RBD diagnosed patients is not ubiquitously displayed within a singular channel but may manifest across various muscle groups [15]. Abnormal muscle activity across various muscle groups for RBD has yet to be exhaustively investigated in a computerized approach. Therefore, this paper aims to determine whether lower limb (legs) PEM activity can be properly discriminated from Non-PEM activity for the future inclusion within a computer-aided clinical diagnostic tool for RBD detection.
Traditionally computer-aided methods in the field of biomedical engineering apply signal processing techniques to raw signals in order to de-noise them and more importantly to “condense” the contained information. The wavelet transform is a signal processing method that is particularly useful for such medical applications [16], [17]. Wavelet transform analysis performs a decomposition of the original signal into a number of user-defined scales, each scale representing a particular “coarseness” of the signal under study [18]. Moreover, the localized nature of the wavelet transform makes it an ideal signal processing technique to handle non-stationary signals and to isolate aperiodic events, which are commonly encountered within biological data sets.
The remainder of this paper is structured as follows. Section II presents the data collection procedures and a step by step description of the PEM detection methodology. Section III summarizes the results obtained from our approach and finally Section IV concludes the paper and provides information regarding future works.
II. Materials And Methods
A. Data Collection
This study adhered to U.S. Department of Health and Human Services experimentation guidelines and received Institutional Review Board approval from Emory University. The study sample included de-identified polysomnogram (psg) data from one male, 72 years of age, with a history of sleep complaints. The data set consisted of a single overnight psg of approximately seven hours in duration.
B. Polysomnographic Techniques
Psg data was collected at the Emory Clinic Sleep Disorders Center (ECSDC) located in Atlanta, Georgia. Using calibrated sleep monitoring equipment sleep technicians at ECSDC attached surface electrodes to the right and left anterior tibialis, legs, to extract the limb muscle activity at a sampling rate of 200Hz.
The psg data record was obtained using an Embla (Flaga Medcare) Model N-7000 digital polysomnographic/EEG system, in real time, in conjunction with a personal computer using the sleep data collection software program Somnologica ® 2.0 [19]. Psg data were converted from Somnologica.edf format, for EEG power analysis, via the software platform MATLAB (version 7.8 R2009a) using the biosig toolbox [20]. A Dell Optiplex 745 desktop computer with an Intel Core 2 Duo processor and a Toshiba Satellite A100 laptop with an Intel Core Duo processor were used to conduct all data analysis.
C. Assessment and Classification of Phasic Electromyographic Muscle Activity
Manual/visual scoring of PEM activity was based upon guidelines specified by Montplaisir et al. [14], with novel additional guidelines proposed by the authors. PEM activity in the right and left leg electrode channels were defined by EMG activity of duration greater than 100 milliseconds with signal amplitude being at least four times the pre-sleep baseline. In this research study, the visual identification of PEM utilized a 1.0 second mini epoch analysis window, an epoch being the commonly accepted sleep medicine term to indicate the feature analysis window. This window is in contrast to the 2.0 second mini-epoch window used by Montplaisir et al. [14]. We did not specify an upper limit on PEM duration, therefore multiple burst of PEM activity were allowed within the 1.0 second mini epoch window provided repetitive returns to baseline were detectable between PEM events.
Visual scoring was conducted separately for each leg channel. A total of five PEM Scorers (A, B, C, D, E) were instructed to implement binary labeling, using Somnologica ® 2.0, of EMG leg movements that satisfied previously mentioned criteria as PEM activity (1) and not meeting criteria as non-PEM (0), all based on unanimous expert scoring.
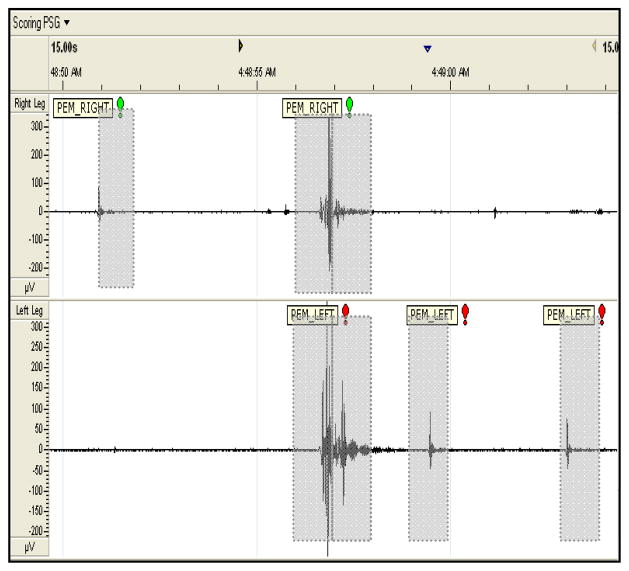
To prevent erroneous results, EMG data segments contaminated by excessive body movements (i.e. patient position change in bed) were excluded from the final data set. In order to focus on expert based visually distinguishable PEM the original seven hour psg were reduced to 1.4 hours (right leg) and 1.45 hours (left leg) data sets, excluding artifacts. Table I includes a detailed description of the PEM and Non-PEM distribution, 1 epoch equivalent to 1 second, for the right and left leg data sets, unanimous decision. An example of PEM and Non-PEM activity, from the data set, is displayed in Figure 1.
Table I.
The Distribution of PEM and Non-PEM Epochs for the Right and Left Leg Data Sets (Unanimous Decision).
| Leg | PEM Epochs | Non-PEM Epochs |
|---|---|---|
| Right | 599 | 6857 |
| Left | 491 | 7203 |
Fig. 1.
Plot of Scorer E labeling for a 15 second duration of EMG activity, from Table I, PEM_RIGHT indicates right leg PEM activity (top panel) and PEM_LEFT indicates left leg PEM activity (bottom panel). One second PEM labeling shown in dotted gray rectangles.
D. Automatic Detection Procedure
The automatic detection procedure consists of several stages. During the first stage the raw signal is segmented into one second epochs with each epoch containing 200 samples. In stage two, feature extraction is applied based on wavelet analysis. As it is generally stated, feature extraction is more of an art than a science; therefore we extracted and tested a number of features, potentially containing redundant information. To deal with redundancy issues, we included a dimensionality reduction stage using Principal Component Analysis (PCA) prior to the final classification stage. The entire procedure is depicted in Figure 2. The remainder of section II describes each one of these stages along with the experimental procedure involved to assess the validity of the proposed approach.
Fig. 2.
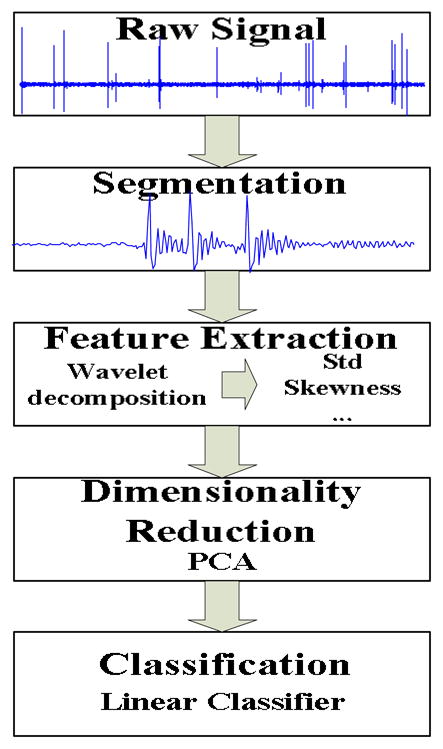
The automatic detection procedure.
E. Wavelet Feature extraction
Wavelet analysis has gained great popularity for the analysis of non-stationary signals, specifically as an alternative to short-time Fourier transform (STFT) analysis. Unlike STFT, the wavelet transform is able to efficiently localize in both the time and frequency domains. Optimal tracking of signal frequency with respect to time is a major concern in analyzing various biological signals, making the wavelet transform applicable for this project. Moreover, even for stationary signals, it can be used to analyze data sets containing a mixture of features at different resolutions [18].
In the case of a continuous signal x(t), the corresponding continuous wavelet transform (CWT) is produced by taking the inner product of the signal with translated and scaled versions of an (real or complex) analyzing (mother wavelet) function ψ. Translations and dilations of the mother wavelet (1) are used to transform the signal into another form (time-scale representation).
| (1) |
In the case of the discrete parameter wavelet transform (DPWT) [21], the dilation and translation parameters a, b are restricted only to discrete values leading to the following expression:
| (2) |
The choice of a0=2 And b0=2 (Dyadic Grid Arrangement) Is generally accepted, such that:
| (3) |
However, most biological signal processing applications involve discrete time signals. In our case the discrete time wavelet transform (DTWT), a discrete representation of the DPWT (3), was applied [21] and is given by:
| (4) |
where m and n are the dilation and translation parameters and in our case x(k) is the discrete EMG signal. Different mother wavelets have been proposed and methods exist for the development of customized wavelets [22]. However, many merits produced by the use of custom made wavelets are insignificant compared to the use of existing wavelets [23]. In this work, we have experimented using Daubechies and symmlet families with different values of vanishing moments. All the aforementioned wavelets were developed by Daubechies [22] and they demonstrate the appealing property of having compact support such that the wavelet transform can be computed with finite impulse response conjugate mirror filters using a fast filter bank algorithm.
Since the PEM activity is a high frequency component most of the relevant information is concentrated in the first few levels of decomposition. Therefore, in this work, we performed wavelet decomposition up to level four and using as inputs the wavelet coefficients (4), we calculated the following quantities at each level: Standard deviation, Mean absolute deviation, Skewness, Kurtosis, Curve length and Shannon’s entropy (inputs were the normalized squared detailed wavelet coefficients). Hence in total, we calculated 24 features for each epoch. These features were selected based upon consultation with sleep practitioners and a review of previous quantitative metrics used in biological signal processing [24]. As it will be shown in the following section this particular set of features is capable of capturing the difference between PEM and non-PEM epochs.
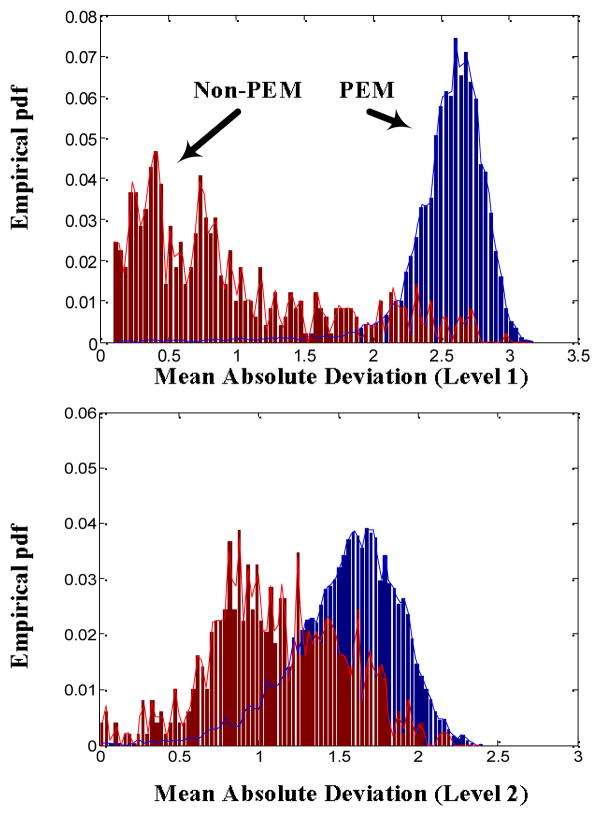
Figure 3 depicts the histograms (empirical approximation of the underlying probability density functions (pdfs)) of the Mean Absolute Deviation of the wavelet coefficients produced by the application of the wavelet transform using a symmlet mother wavelet with five vanishing moments for the left leg data set. Figure 3 indicates that the two classes are characterized by distinct ranges of values. Also, different levels of overlapping are observed depending on the decomposition level (higher decomposition levels (lower frequency ranges) usually manifest greater amount of overlapping).
Fig. 3.
“Empirical” probability density functions (pdfs) of the Mean Absolute Deviation of the wavelet coefficients (using symmlet with five vanishing moments) at level 1 and 2.
F. Dimensionality Reduction
As previously stated, for real world applications we tend to extract more features than necessary in an effort to include all possible information. On the other hand the inclusion of redundant information may negatively affect the performance of the classifier. Therefore, typically following feature extraction some dimensionality reduction method is applied.
There are two major families of dimensionality reduction techniques. The first one attempts to select a subset of the original features whereas the second one maps the original space into a lower dimension space through a mathematical transformation. Among the latter approaches the most widely used technique is PCA or the Karhunen-Loeve transformation. PCA linearly transforms the original space [25], [26] by projecting the N-dimensional data onto the M (M≤N) eigenvectors of their covariance matrix corresponding to the M larger eigenvalues. Even if the entire set of the eigenvectors is to be retained this may also lead to an improvement of classification performance due to the uncorrelated nature of the new set of features.
G. Classification
As stated earlier in the introduction we are proposing a classification approach to discriminate between PEM and non-PEM segments. During the last three decades many novel and powerful methods have been proposed in the field of pattern recognition. However in most cases simpler more conventional classifiers actually perform in a similar manner to novel classifiers when utilized in real world applications [27]. Therefore, in this work we used a simple minimum Mahalanobis distance classifier [25], [26] to detect PEM and non-PEM segments. We selected such a simple linear classifier, since as it was pointed out by Hand [27] for most real life data, “a simple linear surface can do surprisingly well as an estimate of the true decision surface”. In other words each feature vector z is assigned to class i (PEM or Non-PEM) for which the value of the corresponding discriminant function is maximum:
| (5) |
where μi is the mean of class i, P(ωi)is the prior probability of class i, and C is the estimated covariance matrix assumed common for all classes.
H. Experimental procedure
We have conducted four different sets of experiments. Specifically we separately examined the recordings of the left leg and right leg using: a) only those segments unanimously labeled by all five experts and b) using all segments applying a majority vote scheme for labeling. The number of retained principal components varied from one to 24 and the number of vanishing moments from one to 15 for the symmlet and Daubecies wavelet families.
In order to test our approach with minimum bias we applied an “inner” and an “outer” loop validation scheme. The outer loop was included to asses the performance of our approach while the inner scheme was applied to tune our procedure (number of retained principal components (PC) and selection of the number of vanishing moments (VM). In the “outer” scheme we divided the data set into training and testing sets (80% for training and 20% for testing) following a random reshuffle of the PEM and non-PEM segments). Following the latter the training set was again divided into training and testing sets (75% for training and 25% for testing) using a similar reshuffle scheme. The inner loop was repeated 10 times and the best configuration (number of principal components and vanishing moments), in terms of average classification performance was selected and the model was retrained using both the training and testing sets of the inner loop and validated using the testing set of the outer loop. This method decoupled the parameter selection stage from the estimation of the performance [28] thus avoiding our reaching overly optimistic (overfitting) conclusions about the capabilities of our approach. Lastly, the outer loop procedure was repeated 20 times and the results are presented in the following section.
III. Results
Tables II through IX comprise the results for the four different sets of experiments described in the previous section containing two wavelet families presented in the form of average confusion matrices (ACMs). Table X presents the respective sensitivity (proportion of actual PEM epochs which are correctly identified) and specificity (proportion of actual non-PEM epochs which are correctly identified) for each of the eight aforementioned configurations. Figures 4–7 depict the “optimum” configurations in terms of vanishing moments and retained principal components for the case of the Daubechies family.
TABLE II.
ACM – Unanimous Labeling, Left Leg, Daubechies Family
| Actual class | |||
|---|---|---|---|
| Non-PEM | PEM | ||
| Predicted Class | Non-PEM | 1423.6 | 6.7 |
| PEM | 17.4 | 91.3 | |
TABLE IX.
ACM– Majority Labeling, Right Leg, Symmlet Family
| Actual class | |||
|---|---|---|---|
| Non-PEM | PEM | ||
| Predicted Class | Non-PEM | 1413.25 | 21.1 |
| PEM | 43.75 | 141.9 | |
TABLE X.
Sensitivity and Specificity
| Configuration | Sensitivity | Specificity |
|---|---|---|
| D - U - L | 93.16 | 98.79 |
| D - U - R | 92.79 | 98.54 |
| D - M - L | 90.56 | 97.08 |
| D - M - R | 87.79 | 96.83 |
| S - U - L | 92.76 | 98.81 |
| S - U - R | 91.71 | 98.55 |
| S - M - L | 90.70 | 97.33 |
| S - M - R | 87.06 | 97.00 |
L = Left Leg, R = Right Leg, U = Unanimous voting, M = Majority voting, S = Symmlet mother wavelet, D = Daubechies mother wavelet.
Fig. 4.
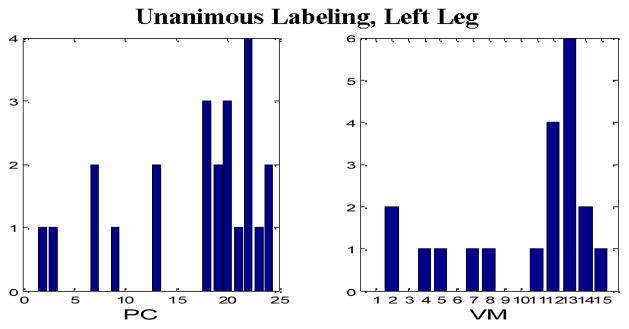
“Optimum” parameter settings, Unanimous Labeling, Left Leg, Daubechies wavelets.
Fig. 7.
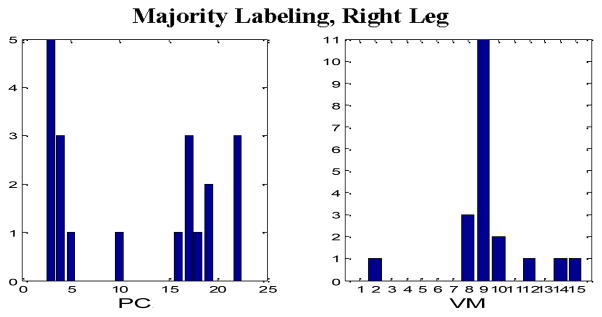
“Optimum” parameter settings, Majority Labeling, Right Leg, Daubechies wavelets.
IV. Conclusion
In this study, we investigated the development of an automated method for the detection of PEM activity. Presence of excessive PEM activity is closely linked to a number of neurodegenerative disorders, which include PD and RBD. Hence, the automated detection of PEM is a favorable method for clinical use in the tracking of PD and RBD.
The proposed approach is based on the application of the wavelet transform on the EMG signal and extraction of features in the wavelet domain. The experimental results indicate that PEM and Non-PEM activity can be efficiently identified using quantitative methods. More specifically for the unanimous voting scheme the sensitivity is approximately 92% for both legs also with very high specificity (above 98.5% in all four cases). Our results compare favorably to the state of the art, see Introduction section, in EMG activity detection for RBD identification (62.8–94.4%).
In the case of majority voting labeling there is a drop in the performance which can be justified by the fact that we included cases that expert PEM scorers found problematic to classify. In terms of the best PEM detection configuration, the use of the Daubechies family appears to be the optimal choice. However, no clear choice for the selection of the number of vanishing moments and the number retained principal components were found. In general configurations with nine to 14 vanishing moments and more than 15 principal components produced comparable results (only in the case of the right leg and with majority voting labeling, a smaller number of principal components was more appropriate). Due to the supervised training approach we implemented, more data are needed before we reach a safe conclusion regarding the optimal parameter selection.
In order to extend this work toward a computer-aided clinician tool further analysis will be required to adapt the current methodology to automatically compensate for artifact segments, which were manually excluded for this study. Moreover, further investigations will be conducted to address automated PEM detection methods across various subject populations (controls, RBD and PD patients).
Finally we suggest the investigation of a method to quantify PEM activity without the restriction of the one second epochs. Being that this artificial segmentation might be responsible for the disagreement among experts since most of the dubious cases involved epochs with PEM events crossing segmentation boarders. Therefore in future work we will refine our approach to tackle these borderline cases.
Fig. 5.
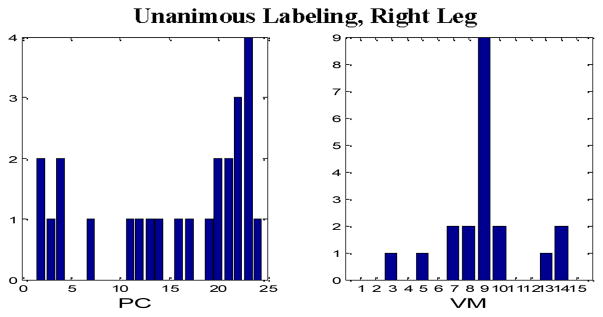
“Optimum” parameter settings, Unanimous Labeling, Right Leg, Daubechies wavelets.
Fig. 6.
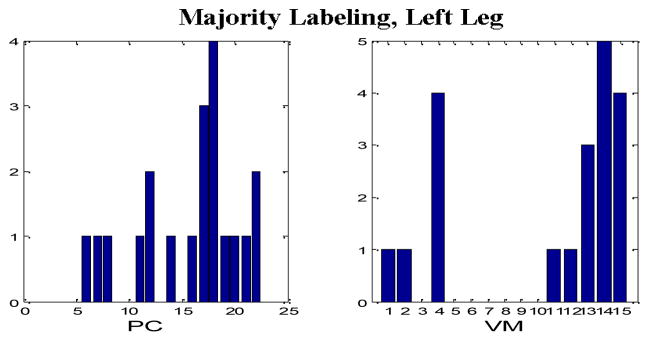
“Optimum” parameter settings, Majority Labeling, Left Leg, Daubechies wavelets.
TABLE III.
ACM– Unanimous Labeling, Right Leg, Daubechies Family
| Actual class | |||
|---|---|---|---|
| Non-PEM | PEM | ||
| Predicted Class | Non-PEM | 1351 | 8.65 |
| PEM | 20 | 111.35 | |
TABLE IV.
ACM– Majority Labeling, Left Leg, Daubechies Family
| Actual class | |||
|---|---|---|---|
| Non-PEM | PEM | ||
| Predicted Class | Non-PEM | 1450.4 | 11.9 |
| PEM | 43.6 | 114.1 | |
TABLE V.
ACM– Majority Labeling, Right Leg, Daubechies Family
| Actual class | |||
|---|---|---|---|
| Non-PEM | PEM | ||
| Predicted Class | Non-PEM | 1410.8 | 19.9 |
| PEM | 46.2 | 143.1 | |
TABLE VI.
ACM – Unanimous Labeling, Left Leg, Symmlet Family
| Actual class | |||
|---|---|---|---|
| Non-PEM | PEM | ||
| Predicted Class | Non-PEM | 1423.9 | 7.1 |
| PEM | 17.1 | 90.9 | |
TABLE VII.
ACM – Unanimous Labeling, Right Leg, Symmlet Family
| Actual class | |||
|---|---|---|---|
| Non-PEM | PEM | ||
| Predicted Class | Non-PEM | 1351.15 | 9.95 |
| PEM | 19.85 | 110.05 | |
TABLE VIII.
ACM – Majority Labeling, Left Leg, Symmlet Family
| Actual class | |||
|---|---|---|---|
| Non-PEM | PEM | ||
| Predicted Class | Non-PEM | 1454.15 | 12.1 |
| PEM | 39.85 | 113.9 | |
Acknowledgments
The authors would like to thank the technicians at ECSDC for collecting the data processed in this study and the PEM scorers for identifying PEM and non-PEM segments. This work was supported in part by the National Institute for Neurological Disorders and Stroke (NINDS) under Grant Nos. NS055015-03 and NS-050595 along with the National Science Foundation sponsored program Facilitating Academic Careers in Engineering and Science (FACES) at the Georgia Institute of Technology (GaTech) and Emory University. Other support was provided in part by the “Operational Programme Education and Lifelong Learning” of the Greek Ministry of Education, Lifelong Learning and Religious Affairs, co-financed by the European Union.
Contributor Information
Jacqueline A. Fairley, Email: jafairl@emory.edu, NIH NINDS postdoctoral fellow at Emory University School of Medicine Department of Neurology, Atlanta, GA 30322 USA (phone: 404-712-9752;).
George Georgoulas, Email: georgoul@teleinfom.teiep.gr, Department of Informatics and Communications Technology, Technological Educational Institution of Epirus, Arta, 47100 Greece.
Chrystostomos D. Stylios, Email: stylios@teiep.gr, Department of Informatics and Communications Technology, Technological Educational Institution of Epirus, Arta, 47100 Greece.
George Vachtsevanos, Email: gjv@ece.gatech.edu, Faculty member at the Georgia Institute of Technology, Atlanta, GA 30332 USA.
David B. Rye, Email: drye@emory.edu, Faculty members at Emory University
Donald L. Bliwise, Email: dbliwis@emory.edu, Faculty members at Emory University
References
- 1.Zhang JH, Lam SP, Ho CKW, Li AM, Tsoh J, Mok V, Wing YK. Diagnosis of REM sleep behavior disorder by video-polysomnographic study: Is one night enough? Sleep. 2008;31(8):1179–1185. [PMC free article] [PubMed] [Google Scholar]
- 2.Iranzo A, Santamaria J, Tolosa E. The clinical and pathophysiological relevance of REM sleep behavior disorder in neurodegenerative diseases. Sleep Med Rev. 2009;13(6):385–401. doi: 10.1016/j.smrv.2008.11.003. [DOI] [PubMed] [Google Scholar]
- 3.Bliwise DL, Trotti LM, Rye DB. Movement disorders specific to sleep and sleep in waking movement disorders. In: Watts SDG, Obeso RLJ, editors. Movement Disorders: Neurologic Principles and Practices. Vol. 3. New York: McGraw Hill; 2011. [Google Scholar]
- 4.Boeve BF. Predicting the future in idiopathic rapid-eye movement sleep behaviour disorder. Lancet Neurology. 2010;9(11):1040–1042. doi: 10.1016/S1474-4422(10)70221-0. [DOI] [PubMed] [Google Scholar]
- 5.Claassen DO, Josephs KA, Ahlskog JE, Silber MH, Tippmann-Peikert M, Boeve DF. REM sleep behavior disorder preceding other aspects of synucleinopathies by up to half a century. Neurology. 2010;75(6):494–499. doi: 10.1212/WNL.0b013e3181ec7fac. [DOI] [PMC free article] [PubMed] [Google Scholar]
- 6.Mahowald M, Bornemann MAC, Schneck CH. When and where do synucleiopathies begin? Neurology. 2010;75(6):488–489. doi: 10.1212/WNL.0b013e3181ec804a. [DOI] [PubMed] [Google Scholar]
- 7.Bliwise DL, Rye DB. Elevated PEM (phasic electromyographic metric) rates identify rapid eye movement behavior disorder patients on nights without behavioral abnormalities. Sleep. 2008;31(6):853–857. doi: 10.1093/sleep/31.6.853. [DOI] [PMC free article] [PubMed] [Google Scholar]
- 8.Bliwise DL, He L, Ansari FP, Rye DB. Quantification of electromyographic activity during sleep: a phasic electromyographic metric. J Clin Neurophysiol. 2006;23(1):59–67. doi: 10.1097/01.wnp.0000192303.14946.fc. [DOI] [PubMed] [Google Scholar]
- 9.Bliwise DL, Trotti LM, Greer SA, Juncos JJ, Rye DB. Phasic muscle activity in sleep and clinical features of Parkinson disease. Ann Neurol. 2010;68(3):353–359. doi: 10.1002/ana.22076. [DOI] [PMC free article] [PubMed] [Google Scholar]
- 10.Mayer G, Kesper K, Ploch T, Canisius S, Penzel T, Oertel W, S-KK Quantification of Tonic and Phasic Muscle Activity in REM Sleep Behavior Disorder. J Clin Neurophysiol. 2008;25(1):48–55. doi: 10.1097/WNP.0b013e318162acd7. [DOI] [PubMed] [Google Scholar]
- 11.Burns JW, Consens FB, Little RJ, Angell KJ, Gilman S, Chervin RD. EMG variance during polysomnography as an assessment for REM sleep behavior disorder. Sleep. 2007;30(12):1771–1778. doi: 10.1093/sleep/30.12.1771. [DOI] [PMC free article] [PubMed] [Google Scholar]
- 12.Ferri R, Manconi M, Plazzi G, Bruni O, Vandi S, Montagna P, Ferini-Strambi L, Zucconi M. A quantitative statistical analysis of the submentalis muscle EMG amplitude during sleep in normal controls and patients with REM sleep behavior disorder. J Sleep Res. 2008;17(1):89–100. doi: 10.1111/j.1365-2869.2008.00631.x. [DOI] [PubMed] [Google Scholar]
- 13.Frauscher B, Iranzo A, Högl B, Casanova-Molla J, Salamero M, Gschliesser V, Tolosa E, Poewe W, Santamaria J. Quantification of electromyographic activity during REM sleep in multiple muscles in REM sleep behavior disorder. Sleep. 2008;31(5):724–31. doi: 10.1093/sleep/31.5.724. [DOI] [PMC free article] [PubMed] [Google Scholar]
- 14.Montplaisir J, Gagnon JF, Fantini ML, Postuma RB, Dauvilliers Y, Desautels A, Rompre S, Paquet J. Polysomnographic diagnosis of idiopathic REM sleep behavior disorder. Mov Disord. 2010;25(13):2044–2051. doi: 10.1002/mds.23257. [DOI] [PubMed] [Google Scholar]
- 15.Iranzo A, Santamaria J, Tolosa E. The clinical and pathophysiological relevance of REM sleep behavior disorder in neurodegenerative diseases. Sleep Med Rev. 2009;13(6):385–401. doi: 10.1016/j.smrv.2008.11.003. [DOI] [PubMed] [Google Scholar]
- 16.Akay M. Time Frequency and Wavelets in Biomedical Signal Processing. Piscataway: IEEE Press; 1997. [Google Scholar]
- 17.Aldroubi A, Unser MA. Wavelets in Medicine and Biology. Boca Raton: CRC Press; 1996. [Google Scholar]
- 18.Mallat S. A Wavelet Tour of Signal Processing. 2. Oxford: Academic Press; 1999. [Google Scholar]
- 19.Embla, Somnologica Studio. Digital polysomnograph data aquistion system. Broomfield, CO: 2007. [Google Scholar]
- 20.Schloegl A. BIOSIG. University of Technology Graz; Graz, Austria: 1997. [Google Scholar]
- 21.Ifeachor EC, Jervis BW. Digital Signal Processing: A Practical Approach. 2. Harlow: Prentice Hall; 2002. [Google Scholar]
- 22.Daubechies I. Ten Lectures on Wavelets. Philadelphia. Pennsylvania Society for Industrial and Applied Mathematics; 1994. [Google Scholar]
- 23.Fugal DL. Conceptual Wavelets in Digital Signal Processing. San Diego, CA: Space and Signals Technical Publishing; 2009. [Google Scholar]
- 24.Fairley J. Statistical Modeling of the Human Sleep Process via Physiological Recordings. Electrical and Computer Engineering, Georgia Institute of Technology; Atlanta: 2008. p. 167. [Google Scholar]
- 25.Theodoridis S, Koutroumbas K. Pattern Recognition. 4. Burlington, MA: Academic Press; 2009. [Google Scholar]
- 26.Duda RO, Hart PE, Stork DG. Pattern Classification. 2. New York: Wiley-Interscience; 2000. [Google Scholar]
- 27.Hand DJ. Classifier technology and the illusion of progress. Statistical Science. 2006;21(1):1–14. [Google Scholar]
- 28.Salzberg SL. On comparing classifiers: Pitfalls to avoid and a recommended approach. Data Mining and Knowledge Discovery. 1997;1(3):317–328. [Google Scholar]


