

Abstract
Usage data at a high-traffic web site can expose information about external events and surges in popularity that may not be accessible solely from analyses of content and link structure. We consider sites that are organized around a set of items available for purchase or download, consider, for example, an e-commerce site or collection of online research papers, and we study a simple indicator of collective user interest in an item, the batting average, defined as the fraction of visits to an item's description that result in an acquisition of that item. We develop a stochastic model for identifying points in time at which an item's batting average experiences significant change. In experiments with usage data from the Internet Archive, we find that such changes often occur in an abrupt, discrete fashion, and that these changes can be closely aligned with events such as the highlighting of an item on the site or the appearance of a link from an active external referrer. In this way, analyzing the dynamics of item popularity at an active web site can help characterize the impact of a range of events taking place both on and off the site.
Large information repositories are often studied not just in terms of their content, but also in terms of the structures that grow up around this content. In the scientific literature, the network of citations provides a clear example of this type of structure; it can supplement the text of published papers by highlighting work that others have found to be important. This principle extends naturally to the information contained in web sites as well; hyperlinks on the web provide a powerful framework for organization and analysis that parallels the use of citations and cross-references in other media (for an example, see ref. 1).
Web sites and other online documents, however, can be further annotated with information typically not available in traditional print sources: the patterns of usage generated by visitors to the site. At the most basic level, explicit analysis of a web site's usage can play a role similar to that of hyperlink analysis; for instance, uncovering parts of the site that have attracted large numbers of visitors can help to highlight important content for future users. But usage data are considerably more dynamic and volatile than link structure; usage changes quickly in response to external events and surges of popularity, many of which are significant but too transient to leave behind a long-term mark on the site. With effective means for analyzing this usage dynamics, we can thus characterize a web site along a dimension that neither content nor link structure is able to capture.
Our work is based on an analysis of usage data from the Internet Archive (www.archive.org), which maintains a large collection of downloadable media, including movies, music, and books, as well as snapshots of the web itself reaching back to its early history. Our approach, however, is applicable to a wide range of web sites offering items that users may or may not want to acquire (e.g., for sale or download). Such sites typically contain three distinct types of content: navigational structure, item descriptors (an individual page associated with each item, providing a description of the item together with the option to acquire it), and the items themselves. This kind of navigation-description-acquisition structure is common in e-commerce sites, such as amazon.com, and in online libraries or research paper collections such as the e-print arXiv (2) and CiteSeer (3). In the case of the Internet Archive, this structure is manifested through a “details” page for each media item, containing a summary of the content together with user reviews and links for downloading the item.
In the following sections, we develop methods for modeling and tracking the popularity of items at web sites with this structure. We introduce the batting average, the proportion of visits that lead to acquisitions, as a measure of an item's popularity, and we illustrate why it is a useful complement to traditional measures such as visit or acquisition counts alone. We then develop a stochastic model of how the batting average varies over time, and we use it to examine the level of interest in certain items in the Internet Archive. We find that many of the changes in item popularity have a discrete nature, they occur suddenly, and their onset can be related to specific events taking place either on or off the site. Further, we argue that knowledge of these changes and the events surrounding them can be of value both to users of the site and the site's administrators.
The Batting Average of an Online Item
There are several quantitative ways to try to capture an item's popularity. Consider, first, ranking each item in order of its acquisition count, the number of times it has been acquired (e.g., downloaded or purchased). Many web sites offer this type of ranking to users in the form of a “most popular” list. Such lists, while clearly providing useful feedback, suffer from two intrinsic (and related) problems: they typically change very little over time, because the top items on these lists build up large counts that are relatively impervious to localized trends, and they are self-reinforcing in the sense that users are often driven to look at an item simply because it appears on one of these lists.
We have been studying an alternative measure, the batting average; although still simple to define, it exhibits a more complex dynamics. On any web site with a description-acquisition structure, the batting average of an item is defined as the number of acquisitions of the item divided by the number of visits to its description. Thus, the batting average can be thought of as a kind of inherent “appeal” of an item, the probability that a visit will lead to acquisition, averaged over all visitors to the item's description.
Both the acquisition count and the batting average have the potential to change significantly when an item is highlighted in some way, either on the site or by an active off-site referrer, and is thereby exposed to a larger or different population of users. The way in which these two measures generally experience change, however, is quite different. The acquisition count never decreases with increasing exposure of the item, and the magnitude of the increase in large part reflects the extent of the exposure. The batting average, on the other hand, may go up or down when the item is exposed to a new population, depending on whether this new population contains a larger or smaller fraction of users who are interested in acquiring it; in this way, the change to the batting average reflects something about the interests of the new population relative the item's standard set of visitors. More generally, the dynamics of an item's batting average over time can help one to dissect the mix of users who encounter and evaluate it at different times and for different reasons.
As one concrete indication of the different dynamics exhibited by the acquisition count and the batting average, we consider the effects of reporting these quantities as feedback to users. Because its media collections became public, the Internet Archive site has featured continuously updated lists of the items with the highest acquisition count, displayed separately for movies, audio, and texts. Beginning in November 2002, on the same pages, lists of the items with the highest batting averages (corrected for small sample sizes) were added. We find that the lists of most acquired items change very infrequently, reflecting their self-reinforcing or “rich-get-richer” character: users are driven to look at (and then often acquire) these items simply because of their presence on the lists, which increases their acquisition count. The lists of items with the highest batting averages, on the other hand, are significantly more “turbulent”: when an item enters such a list, its visibility on the site increases significantly, and a broader population of users is driven to look at its description. At this point the item's batting average can remain stable or increase if it is of mainstream interest or else the batting average will drop and the item will rapidly leave the top-ranked list. Fig. 1 shows the number of days in each month (November 2002 through April 2003) when the “top-5 acquired” and “top-5 batting averages” lists experienced a change. The greater turbulence of the batting average list is reflected in the fact that it changes every 2-3 days on average, as opposed to every couple of weeks.
Fig. 1.

The number of changes per month in top audio (a) and movie (b) items: ranking by batting average versus ranking by downloads.
We have also observed that the distribution of acquisition counts across all items at the Internet Archive has a heavy-tailed distribution, whereas the distribution of batting averages does not. Heavy-tailed distributions are widely observed in settings that are dominated by rich-get-richer dynamics (4); this is a further quantitative reflection of the contrast between acquisition count and batting average.
Tracking Interest over Time
We have argued that aggregate interest in an item, as measured by the batting average, may change whenever the item is exposed to a new mix of users. Moreover, if we think about the potential causes of an item's increased exposure, many of these are not gradual trends but discrete events, occurring at precise points in time. Consider, for example, the effect of highlighting an item on a top-level page on the site, or the effect of a new link from an active off-site referrer; this highlight or hyperlink first appears at a specific moment, and the item's batting average is particularly susceptible to change at such moments. With a means for identifying discrete changes in the batting average, we can assess the extent of this phenomenon in practice and automatically identify the most significant events that affect interest in each item in the collection.
Thus, we need a way to meaningfully express the “instantaneous batting average” of an item at any point in time, so that we can identify the moments when this quantity changes. Defining such an instantaneous measure is a bit subtle, because at any one particular point in time, we simply have information about a single user's decision to download the item or not. One simple approach would be to average the results of a number of consecutive user visits, obtaining a batting average over a “sliding window” in time, but as we discuss further below, we have found that this is not effective at localizing a small set of changes caused by external events. Instead, we make use of the stochastic modeling framework of hidden Markov models (HMMs) (5), explicitly representing the underlying download probability as a “hidden state” in the process, and identifying the moments when this state changes.
To motivate this, consider first a simple model of an item's batting average: a sequence of users visit the item's description, and each user independently decides whether to acquire the item by flipping a coin of bias b (which, over a long enough sequence of users, will be approximately equal to the observed batting average.) We now consider a richer model in which the underlying bias of the coin can change. Thus, there is an underlying set of possible coin biases 0 < b1 < b2 <... < bn < 1, which we view as the potential states of the process. Users arrive at discrete time steps t = 1,2,..., T and at time t, the decision to download is made with a bias of bit (where 0 < it < n + 1). After each step, there is some probability that the bias will change; specifically, there is a function γ(·, ·) so that, if the current bias at visit t is b, it will change to b′ at visit t + 1 with probability γ (b, b′).
The decision by each of the T visitors to download the item or not can be encoded as a length-T sequence d = (d1, d2,..., dT) of 0s and 1s. Our goal is to find the corresponding sequence of biases b = (bi1, bi2,..., biT) that is most likely given download sequence d; in other words, we want to maximize Pr[b|d]. By Bayes' theorem, this is equivalent to maximizing Pr[d|b]·Pr. The first term decomposes into a sequence of independent download decisions, 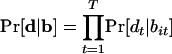 , where each factor is simply the probability of a 0 or 1 given the bias: Pr[1|bit] = bit and Pr[0|bit] = 1 - bit. The second term factors into a sequence of probabilistic transitions according to our model,
 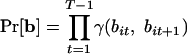 . Finally, it is useful to take the negative logarithm of the expression, so that we are seeking to minimize a sum rather than maximize a product:
 |
1 |
In our case, we use a set of biases {bi} that range from 0.10 to 0.90 in increments of 0.01. We limit the range of biases to avoid values near 0 and 1, where the first term of the summation (corresponding to Pr[1|bit] = bit and Pr[0|bit] = 1 - bit) becomes unbounded. We choose a step size of 0.01 because empirically a smaller step size of 0.001 yields essentially the same results, whereas a larger step size of 0.1 fails to distinguish a number of events.
The quantity -log γ(b, b′) in the second term of Eq. 1 can be viewed as a state transition cost (because we seek to minimize it), and we model it as increasing linearly in relation to the distance between the biases b and b′:
 |
where the ki are positive constants with k1 > k2; these constants are chosen to yield a small number of state transitions per item (≈10-20) in practice. The rationale for the two-slope model underlying the state transition cost is that we want to be able to detect sudden large changes in bias that result from discrete external events such as adding a new link, while at the same time not having the model drift from one bias to another and back again. Thus the higher slope for small changes encourages the system to stay in a given state rather than bouncing around, but at the same time large changes in bias do not incur much more of a penalty than moderate changes. This is a standard kind of “truncated model” used in robust statistics. Many other cost functions, including quadratic (which would correspond to Gaussian distributed transition probabilities) could also be used here.
Intuitively, the two terms in Eq. 1 reflect opposing forces in our tracking of the batting average over time: the first term seeks to produce a sequence of biases that accurately follows each individual download decision, whereas the second term seeks to produce a sequence of biases that is relatively constant, reflecting the notion that discrete changes happen only rarely. Minimizing this expression thus corresponds to a balance between these two qualitative goals. The standard Viterbi algorithm (5) can find the state sequence minimizing Eq. 1 in time O(Tn2). Because we are dealing with extremely long sequences and using a relatively large set of biases, this running time would be prohibitive; to avoid this problem, we use a recently developed algorithm that exploits the structure of the state transition costs to perform the minimization in time O(Tn) (6, 7).
The result of this computation is a sequence of biases that reflects our best estimate of the instantaneous batting average across the full sequence of user visits. With a setting of parameters under which this quantity changes infrequently, these discrete moments of change become natural breakpoints around which to understand the evolution of interest in the item. Because of the large set of possible biases considered by the algorithm, we find that the changes tend to correspond closely to recognizable events involving the site; in contrast, models with a sparser set of possible biases (i.e., with a smaller value of n) produce state transitions that do not track these events well. We have also considered the use of stochastic models for analyzing the rate of item downloads and the rate of visits to item description pages. This approach is analogous to our stochastic analysis of batting averages, but with several differences. First, because download and visit rates are measured in users per unit time, it is natural to use a probabilistic waiting-time model; such a model is more difficult to meaningfully discretize into states than the biases in our coin-flipping model for batting average, which naturally reside in the interval [0,1]. Second, as discussed in the previous section, changes (captured as state transitions) in the batting average tell us about the varying interest level of the underlying population in a way that state transitions corresponding to spikes in the download or visit rate alone do not. For these reasons, we leave the stochastic analysis of download and visit rates outside the scope of the present article.
Before we analyze the set of batting average state transitions systematically, it is useful to consider a single item in some detail, to get a qualitative sense for what one finds from temporal changes in the batting average. Thus, in Fig. 2 we plot the HMM state for the batting average (the value of the hidden bias variable) as a function of time for the Internet Archive's online copy of the 1952 civil defense film What You Should Know About Biological Warfare. Roughly, we see that the batting average begins at a high level (≈0.38), then drops to a lower level (≈0.26), and returns to a higher level again (between 0.40 and 0.50), with the final higher period interrupted by five brief, sharp drops.
Fig. 2.

Tracking the batting average of What You Should Know About Biological Warfare as a function of time, using state transitions in a HMM.
Annotating these transitions in terms of events both on and off the site, a clear picture of the item's history emerges. The initial drop to a lower level in December 2002 occurred when the item was added to the Pick List, an unannotated list of (recommended) titles on a top-level page at the Internet Archive. The subsequent return to a higher level in February 2003 occurred when the item was moved (a week after Colin Powell's testimony on biological weapons to the United Nations Security Council) from the Pick List to the Collection Spotlight, a more extensive means of highlighting in which the title is accompanied by a brief description; visitors arriving at the film's description from the Collection Spotlight were more likely to download it than visitors arriving from the less informative Pick List. Each of the five subsequent sharp drops can also be closely associated in time with an event involving the item. The first coincided with a referring link from the discussion site forums.somethingawful.com and the second with a referring link from the extremely active weblog www.reason.com/hitandrun; in each case, the fraction of visitors arriving over these links who actually downloaded the film was very low. After the traffic from each of these referrers subsided, the batting average jumped back up. The final three drops correspond to technical failures on the site of varying lengths, which made it impossible to download the file.
Above we mentioned that a simpler alternative to HMMs, the computation of a sliding window of contiguous visits, is not effective for performing a comparable localization of events. The example we have been discussing here provides a good illustration of some of the difficulties. Perhaps the most common way of computing this type of sliding window is to convolve the 0-1-valued sequence d = (d1, d2,..., dT) with a Gaussian mask. In other words, letting g(x) denote the Gaussian function 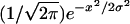 , we create a smoothed sequence
  , where
  for a window size k. In this way, the smoothed quantity
  reflects the average of nearby elements of the original sequence d, damped by the Gaussian multipliers.
In Fig. 3 we perform this computation with a Gaussian where σ = 250 and k = 1,000 (i.e., values are computed out to 4σ). Although the coarse shape of the plot resembles that of Fig. 2, the overall result is much noisier, and it is not clear how to localize particular discrete events. Larger values of σ produce plots that lose the overall shape as well, without becoming substantially less noisy.
Fig. 3.

A noisier method of tracking the batting average for What You Should Know About Biological Warfare, based on a sliding window (Gaussian convolution) of contiguous visits.
The standard approach for identifying change points in such a smoothed signal would be to look for extreme points in the discrete analogue of the first derivative,  for some constant c > 0, but this yields hundreds of such extrema for each item, a quantity that does not decrease significantly even with considerably more smoothing. To create a baseline for comparison with the HMM, we thus looked at just the set of extrema of largest absolute value in the discrete derivative, but we will show in the following section that this still does not perform nearly as well as the HMM at localizing the times of events involving individual items.
In summary, the example in this section suggests that an approach based on a HMM with a large number of underlying states can accurately localize points of discrete change and can capture changes in interest in an item over time scales that range from hours to months in duration.
Aligning Changes in Interest with External Events
The crux of the example in the previous section was that significant changes in the batting average for an active item are often correlated with “real-world events,” both on and off the site, in which this item is featured. How general is this phenomenon? Here, we seek to address this question systematically, by studying the extent to which HMM state transitions can be aligned with events that occur nearby in time. In addition to providing an evaluation of our model's behavior, this type of alignment can have value for both users and administrators of the site. It is a way of identifying, from a large collection of candidate events, those that demonstrated an impact on user behavior by substantially affecting the batting average of an item. Indeed, certain significant events that were not necessarily apparent at the time they occurred can be discovered after the fact through the effect that they have on items' batting averages.
Our approach is as follows. For each of the 100 most downloaded items on the Internet Archive, and for a period from September 2002 to May 2003, we compute all state transitions in the HMM defined in the previous section. We then discard those transitions in which the state changes only by the minimum increment of 0.01, as we are interested in detecting events that had a substantial impact on the batting average, whereas sequences of the minimum-size step of 0.01 occur when the batting average changes “smoothly” from one level to another without a big jump. We call the remaining transitions (257 over all 100 items) major transitions. We then check, for each of these major transitions, whether it occurred close to some observed event involving the item. To construct this set of observed events, we extract information from the Internet Archive's usage logs and a database that records all changes made by site administrators. Our full set of observed events is as follows:
The appearance or disappearance of an item from a Collection Spotlight, Pick List, or top-level list of recent user reviews. (Each of these lists serves to highlight the item in a prominent location on the site.)
The appearance of a link to an item's description from an active off-site referrer. We define this to be the first recorded visit from a referring URL that generated at least 100 visits total, with at least 25 visits occurring within 48 h of the first visit. Although these specific values are somewhat arbitrary, any similar values would achieve the goal of selecting off-site referrers that generated enough traffic to an item's description so as to have a potential impact on its batting average.
The beginning or end of a technical failure on the site that prevented file downloads. These were determined by manual inspection of Internet Archive records and were assumed to involve all items.
There are a total of 1,978 events in this set, over all 100 items. Formally, we test for temporal proximity between major HMM transitions and observed events on the site as follows. We say that a δ-hour alignment between transitions and events is a collection of ordered pairs (r1, e1), (r2, e2),..., (rk, ek), where
Each ri is a major transition and the corresponding ei is an event occurring at most ± hours away in time.
No transition or event occurs in more than one of the ordered pairs.
The effect of condition i is to require the transitions to localize events closely in time; the effect of condition ii is to prevent a single observed event from “explaining” multiple major transitions. Because the ideal is for major transitions to lie near observed events, we will say that such an alignment accounts for the transitions r1, r2,... rk. As a function of δ, the upper curve in Fig. 4 plots the size of the largest δ-hour alignment divided by the total number of major transitions. Thus we see, for example, that there is a 12-h alignment that accounts for roughly half (51.9%) of all major transitions.
Fig. 4.

As a function of a time threshold ±, the upper curve plots the size of the largest ±-hour alignment between major HMM transitions and observed events on the Internet Archive site, normalized by the total number of major transitions. The lower curve is a baseline for comparison: an upper bound on the corresponding quantity, with the set of major transitions replaced by a random set of points in time.
To understand whether this is a significant overlap between transitions and events, we compare it to a random baseline. That is, approximately half of all major transitions can be accounted for by a 12-h alignment; is it likely that if we chose a random set of points in time, we could account for a comparable number? We address this question with the following calculation. There are 100 items under consideration, and we are focusing on a period of 260 days for each; so if we lay the time periods for each item end to end, we get an interval of 26,000 days, which is 624,000 h. Each of the 1,978 observed events “carves out” an interval of 2δ h in this timeline; so if we assume that none of these intervals overlap (which only helps the random baseline), then the probability a random point in time lies within δ hours of one of the observed events is at most (2δ)(1,978)/(624,000) ≈0.00634δ. Thus, the expected fraction of random points that lie sufficiently close to an observed event is at most 0.00634δ, and hence the ratio of the largest ±-hour alignment to the total number of random events can be at most this large. The lower curve in Fig. 4 shows a plot of this fraction as a function of δ. Thus we see, for example, that the maximum-size 12-h alignment will account for at most 7.6% of a random set of points in expectation, significantly less than the 51.9% obtained for the collection of major HMM transitions. Indeed, the probability of seeing a 12-h alignment account for 51.9% of a random sample of 257 points (the number of major transitions) is vanishingly small (≈10-60).
Thus, there is significant overlap between events and transitions. Furthermore, it appears likely that many of the major transitions that went unexplained by observed events in fact have natural explanations that were not included in our event set. For example, when traffic from an active but short-lived referrer leads to a sharp change in the batting average, there is often a second major transition when this traffic dies down, but we do not generally have an observed event to relate this to. Second-order effects from referrers can be even harder to catch, as in a link from slashdot.org to the archive's top-level home page in February 2003 that drove a huge amount of traffic to the site. Certain items experienced a sudden change in batting average just after the appearance of this external link, because they were prominently featured on a top-level archive page and so a fair number of users arriving from slashdot.org went on to look at them, but no observed event was recorded for any of these items because the referring link was not directly to their description pages.
One conclusion from these missed explanations is in fact a promising one: that sharp changes in an item's batting average can often reveal genuine and significant events that are extremely hard to identify directly, even from extensive log data.
In the previous section, we discussed the difficulties with localizing observed events using change points in a Gaussian-smoothed version of the 0-1 sequence of download decisions. Continuing the notation used in that discussion, we took the set of times at which the 257 largest absolute values occurred in the discrete derivative  with c = 6, and computed the largest δ-hour alignment of this set with the observed events as a function of δ. (Empirically, we found that the choice of c = 6 produced the most favorable results for this method, and the choice of the top 257 changes was made so as to produce a set of the same size as the collection of all major HMM transitions.) Although this alignment outperformed the random baseline discussed above, it was significantly smaller than the corresponding alignment of major HMM transitions with observed events, across all values of δ. For example, the largest 12-h alignment in the case of Gaussian smoothing accounted for 19.5% of all points, compared with 7.6% for a random set and 51.9% for major HMM transitions.
As a final point of discussion, we note that we would get much smaller numbers if we studied the converse question: what fraction of observed events in our set occur close in time to a major HMM transition? The point is that although we expect major transitions to align with some observed event, we do not necessarily expect each observed event to correlate with a corresponding change in the HMM. This idea is consistent with an issue addressed earlier, that certain observed events have a measurable impact on an item's batting average, but many do not. Discrete changes in the batting average over time can thus be useful in identifying the extent to which particular links and other forms of highlighting did or did not have an impact on an item's popularity.
Related Work
Much of the prior work on usage data has addressed the problem of collaborative filtering, recommending items to users based on their pattern of past behavior on the site. Research on collaborative filtering has developed approaches that build models of individual users, so as to predict a user's interest in items (8), as well as approaches that build models of item-to-item similarity aggregated over many users, as one sees at sites like amazon.com (9).
More closely related to the issues we consider here is recent work on predicting purchase conversion on an e-commerce site, estimating the probability that an individual user will perform a purchase based on his or her browsing pattern (e.g., refs. 10-12). One key respect in which the work on purchase conversion differs from our approach is in its emphasis on a per-user style of analysis, focusing on a single user's behavior across many items, as opposed to the per-item analysis we undertake here, which considers the behavior of many users in response to a single item.
There has also been work on usage data in the context of information visualization, helping users explore a site by revealing the collective behavior of other users (13, 14). Our analysis of events and their correlation with changes in batting averages offers a way to summarize collective user behavior from a very different perspective, and it would be interesting to see how far these approaches could be integrated.
Finally, it is interesting to note that the success of probabilistic models with explicit state discussed above, compared with algorithms based on local averaging, follows a closely analogous theme in computer vision, where Markov random field models have gained prominence as a technique for dealing with discontinuities in images (15). Our approach here is also motivated by the use of state transitions to model discrete “bursts” in online event sequences (16).
Further Directions
A site as active as the Internet Archive has events of many different kinds impinging on it simultaneously: users view and download items, write reviews, and post messages to discussion boards; active external sites discuss the archive and drive traffic to it; world events generate interest in particular items at the archive. Our probabilistic model for identifying changes in the batting average allows us to analyze one of these streams of actions, the sequence of download decisions, in a principled fashion. Our evaluation in the previous section represents a step toward the simultaneous analysis of multiple streams of events, through the alignment of events on the archive site with discrete changes in the batting average.
It will be interesting to carry this style of analysis further. For example, although we have informally discussed the notion that an external event such as an active referrer may “cause” a change in the batting average, we have refrained from trying to make the concept of causality precise; thus our evaluation above focused purely on proximity in time between events and transitions. Quantifying the notion of causality more precisely is a very natural open question and, from our experience with the data, a difficult one, given the large number of factors that concurrently influence user interest in an item, and the difficulty in isolating the contribution of these factors separately.
Finally, it is clear that tracking just the description-to-acquisition behavior of users has already exposed a rich pattern of activity that varies across time and subpopulations. But it would also be valuable to look at more extensive representations of user behavior, by tracking longer user paths through the site; this offers the chance to make richer inferences about both group and individual user intentions (10-12, 17-20), although it becomes correspondingly harder to interpret the usage data. Ultimately, by considering an increasing level of detail in the dynamics of traffic at an active web site, we can hope to achieve more detailed insight into the collective behavior of the crowds that congregate there.
Acknowledgments
We thank Brewster Kahle for his insights and support throughout the course of this work. This work has been supported in part by a David and Lucile Packard Foundation Fellowship and National Science Foundation Information Technology Research Grant IIS-0081334.
This paper results from the Arthur M. Sackler Colloquium of the National Academy of Sciences, “Mapping Knowledge Domains,” held May 9-11, 2003, at the Arnold and Mabel Beckman Center of the National Academies of Sciences and Engineering in Irvine, CA.
Abbreviation: HMM, hidden Markov model.
References
- 1.Chakrabarti, S. (2002) Mining the Web (Morgan Kaufman, San Francisco).
- 2.Ginsparg, P. (1996) in Electronic Publishing in Science, eds. Shaw, D. & Moore, H. (United Nations Educational, Scientific, and Cultural Organization, Paris), pp. 83-88.
- 3.Lawrence, S., Giles, C. L. & Bollacker, K. (1999) IEEE Computer 32, 67-71. [Google Scholar]
- 4.Mitzenmacher, M. (2003) Internet Math., in press.
- 5.Rabiner, L. (1989) Proc. IEEE 77, 257-286. [Google Scholar]
- 6.Felzenszwalb, P. & Huttenlocher, D. (2000) in Proceedings of the IEEE Computer Vision and Pattern Recognition Conference, eds. Kriegman, D. & Forsyth, D. (IEEE Computer Society Press, Los Alamitos, CA), pp. 66-73.
- 7.Felzenszwalb, P., Huttenlocher, D. & Kleinberg, J. (2003) Adv. Neural Information Processing, in press.
- 8.Resnick, P. & Varian, H. (1997) Commun. ACM 40, 56-58. [Google Scholar]
- 9.Linden, G., Smith, B. & York, J. (2003) IEEE Internet Computing 7, 76-80. [Google Scholar]
- 10.Moe, W. & Fader, P. (2000) University of Pennsylvania Wharton School Marketing Working Paper 00-023 (Univ. of Pennsylvania, Philadelphia).
- 11.Montgomery, A., Li, S., Srinivasan, K. & Liechty, J. (2003) Carnegie Mellon Graduate School of Industrial Administration Working Paper 2003-E26 (Carnegie Mellon, Pittsburgh).
- 12.Sismeiro, C. & Bucklin, R. (2002) UCLA Anderson School Working Paper 2002 (Univ. of California, Los Angeles).
- 13.Eick, S. (2001) Commun. ACM 44, 45-50. [Google Scholar]
- 14.Fry, B. (2000) Master's thesis (Massachusetts Institute of Technology, Cambridge).
- 15.Li, S. (1995) Markov Random Field Modeling in Computer Vision (Springer, Berlin).
- 16.Kleinberg, J. (2002) in Proceedings of the ACM SIGKDD Conference on Knowledge Discovery and Data Mining, eds. Hand, D., Keim, D. & Ng, R. (Assoc. Computing Machinery, New York), pp. 91-101.
- 17.Bucklin, R., Lattin, J., Ansari, A., Gupta, S., Bell, D., Coupey, E., Little, J., Mela, C., Montgomery, A. & Steckel, J. (2002) Marketing Lett. 13, 245-258. [Google Scholar]
- 18.Cadez, I., Heckerman, D., Meek, C., Smyth, P. & White, S. (2003) in Proceedings of the ACM SIGKDD Conference on Knowledge Discovery and Data Mining, eds. Simoff, S. & Zaiane, O. (Assoc. Computing Machinery, New York), pp. 280-284.
- 19.Heer, J. & Chi, E. (2002) in Proceedings of the ACM CHI Conference on Human Factors in Computing Systems, eds. Torveen, L. & Wixon, D. (Assoc. Computing Machinery, New York), pp. 243-250.
- 20.Huberman, B., Pirolli, P., Pitkow, J. & Lukose, R. (1998) Science 280, 95-97. [DOI] [PubMed] [Google Scholar]