

Abstract
Chromosome segregation during mitosis is mediated by spindle microtubules that attach to chromosomal kinetochores with strong yet labile links. The exact molecular composition of the kinetochore–microtubule interface is not known but microtubules are thought to bind to kinetochores via the specialized microtubule-binding sites, which contain multiple microtubule-binding proteins. During prometaphase the lifetime of microtubule attachments is short but in metaphase it increases 3-fold, presumably owing to dephosphorylation of the microtubule-binding proteins that increases their affinity. Here, we use mathematical modeling to examine in quantitative and systematic manner the general relationships between the molecular properties of microtubule-binding proteins and the resulting stability of microtubule attachment to the protein-containing kinetochore site. We show that when the protein connections are stochastic, the physiological rate of microtubule turnover is achieved only if these molecular interactions are very transient, each lasting fraction of a second. This “microscopic” time is almost four orders of magnitude shorter than the characteristic time of kinetochore–microtubule attachment. Cooperativity of the microtubule-binding events further increases the disparity of these time scales. Furthermore, for all values of kinetic parameters the microtubule stability is very sensitive to the minor changes in the molecular constants. Such sensitivity of the lifetime of microtubule attachment to the kinetics and cooperativity of molecular interactions at the microtubule-binding site may hinder the accurate regulation of kinetochore–microtubule stability during mitotic progression, and it necessitates detailed experimental examination of the microtubule-binding properties of kinetochore-localized proteins.
Keywords: Affinity, Cooperativity, Mathematical modeling, Microtubule binding, Phosphorylation
INTRODUCTION
In preparation for division, the replicated chromosomes are captured, aligned and segregated into two identical sets by the microtubule-based mitotic spindle. Failure to divide properly leads to chromosomal instability, a serious threat to human health.40 It is now well established that chromosomal instability frequently arises from a failed regulation of dynamic interactions between microtubules (MTs) and the kinetochores, specialized chromosomal structures.29 Indeed, even low levels of drugs that perturb kinetochore microtubule (KMT) dynamics cause a failure to divide properly.7,8,23 During mitosis the MTs attach and detach from the kinetochore frequently, turning over with a lifetime of only 3–4 min in prometaphase. 8,11,47 As the number of kinetochore-bound MTs increases, these attachments become more stable and their lifetime increases to 7–10 min.11,13 The nature of connections that link chromosomes and the MT ends dynamically, and the molecular mechanisms that regulate KMT turnover remain poorly understood.
Previous theoretical studies have modeled the kinetochore as containing the distinct MT-binding sites, each composed of multiple MT-binding proteins arranged in a cylinder20,21,39 or a ring6,15,25,31 (reviewed in Grishchuk et al.18) (Fig. 1a). These models have brought significant progress to our understanding of how chromosomes move in conjunction with MT dynamics and about the force generation by kinetochore-bound MTs but they have not examined the dynamic nature of these attachments. The classical MT-binding “sleeve” structure contains 65 tubulin-binding proteins, 90–95% of which are bound to the MT at any given time in the absence of a load.20,21 Therefore, the sleeve, as well as the ring model with 16–25 MT-binding proteins,15 is expected to form a highly stable MT attachment that turns over only when a MT end is pulled by force. Since structural studies of the kinetochores in different species have found that the kinetochore–MT interface is likely to contain the mesh-like fibrillar mats,14,30 rather than sleeves, recent theoretical studies have started modeling the kinetochore–MT interactions via an ensemble of multiple MT-associated proteins (MAPs) that are not linked in a rigid structure12,28 (Fig. 1a). However, neither these nor the phenomenological models of kinetochore–MT interactions17,46 have examined in a quantitative and systematic manner how the molecular properties of MAPs affect the lifetime of MT attachments.
FIGURE 1.

Theoretical approaches to study kinetochore–MT interactions. (a) Possible designs of kinetochore–MT binding site. The sleeve and ring models assume that the MAPs are connected rigidly, so their MT binding is not truly independent. In our model, the MAPs can bind and unbind independently, although their apparent dissociation rate is different when two or more MAPs are found next to each other. (b) Schematic of the model for molecular interactions between the MT and N0-independent MAPs comprising one MT-binding site. Arrows and their labels correspond to the sums of all possible transitions between two different states, e.g., the MT bound to j and j + 1 MAPs. For details see “General Model Description”. (c) Scheme of the stochastic simulation algorithm for model of the entire kinetochore interface with multiple MT-binding sites, see section “Numerical Simulations of the Kinetochore Interface with Multiple MT-Binding Sites”.
To fill this gap we have developed a simple mathematical model of the kinetochore–MT interface which contains multiple MT-attachment sites.2,48 The exact molecular composition of real kinetochore sites is not yet known, but they likely contain multiple copies of the NDC80 complex, a key MT-binding component of the KMN network.10 Previous studies have established that NDC80 binding to MTs can be regulated via the phosphorylation by Aurora B kinase.9,13 For example, when Aurora B kinase is inhibited, KMT lifetime increases dramatically up to 200 min.11 The phosphorylation is likely to affect the dissociation constant of NDC80–MT interactions.41 It has also been suggested that phosphorylation regulates the cooperativity of NDC80 binding.3,4 While some of the features of our model are based loosely on these and other properties of the NDC80 protein complex, the calculations were carried out for a wide range of model parameters, so these results are general and can be applied to any kinetochore-associated proteins that form the mitotically significant MT attachments.
MODEL DESCRIPTION
General Model Description
Our approach for mathematical modeling of the MT-kinetochore interface is based on probabilistic, single-molecule interactions between MTs and the kinetochore-associated molecular MAPs. The MT-binding site was modeled as an ensemble of N0 MAPs, which are equivalent in their molecular properties. These MAPs can independently associate and dissociate with one MT (Fig. 1b). A MT was said to be attached to the MT-binding site if it had at least one attached MAP molecule. A MT that lost all attached MAPs was referred to as the detached MT. The stochastic interactions between an individual MAP and MT were described with two parameters: association rate (kon) and dissociation rate (koff). These rates were the same for all MAPs in the site, and they did not depend on the number of MAPs already bound to the MT. Since the MAPs can associate and dissociate with the MT independently, the rate of binding of one MAP to the MT is a product of kon and the number of unbound MAPs at the site; analogously, the rate of losing one MAP is a product of koff and the number MAPs that were already attached to MT (Fig. 1b).
To take into account the cooperative nature of MAPs–MT interactions, we introduced an independent parameter ω which modified the apparent dissociation rate of individual MAPs depending on the number of neighboring complexes bound to the same MT. Parameter ω describes the cooperativity of MAP binding by accounting for the energy of interaction between neighboring MAPs on the MT and its effect on the apparent dissociation rate. Standard free energy of MT-binding reaction of a single MAP is linked to the dissociation constant (KD):
| (1) |
When the MAP forms an additional bond with another MT-bound MAP, the apparent dissociation constant becomes:
| (2) |
where is standard free energy of MAP–MAP interaction, and . Assuming that the association rate kon does not depend on , the above expression leads to , where, is apparent dissociation rate for unbinding of the MAP. Analogously, if one MT-bound MAP has two neighbors, the apparent dissociation rate is given by . During simulations, different MT-bound MAPs may have different number of neighbors. For instance, when three MAPs are bound adjacently, one MAP has two lateral bonds and each of other two MAPs has only one lateral bond, so the average for this group of MAPs is 4/3 bonds per MAP, and the apparent dissociation rate for the group is . For a group of N MAPs the apparent dissociation rate is koff=ωj, where power j depends on the number of molecular neighbors: j = 2(N − 1)/N. When N>2, the value of j was calculated assuming that all MAPs bound next to each other on the MT lattice.
Analytical Solution for the Model of a Single MT-Binding Site
The following symbols were used for the model of a single MT-binding site:
[0]—fraction of time when zero MAPs are attached to the MT (MT-binding site is free),
[m]—fraction of time when m MAPs are attached to the MT; m ≤ N0, the total number of MAPs in the MT-binding site.
The steady state for MAPs–MT interactions schematized in Fig. 1b can then be described with N0 + 1 equilibrium equations:
| (3) |
The system of Eq. (3) was solved in Mathematica (Wolfram Research) to determine [m].
To calculate average KMT lifetime τ (the average time from the attachment of an MT until its detachment) we used the following symbols: τtot—total time of simulation; α total number of MT attachments to the binding site during τtot; τo—total time when zero MAPs were attached to the MT; τat—total time when MT was attached to the binding site.
The average fraction of time when a MT-binding site was occupied at steady-state was the sum of all fractions of time when at least one MAP was attached to MT ( ), therefore:
| (4) |
Considering that τtot = τot + τo, we obtain:
| (5) |
The total time when zero MAPs are attached τo is a product of average time when the site is unoccupied before a subsequent MT attachment, i.e., the dwell time when no MAPs are attached: 1/(kon × No) (Fig. 1b) and the total number of MT attachment events α: τo = α/(kon × No). Analogously, τat can be substituted with the product of the average KMT lifetime τ and α. Thus, we can rewrite expression (5):
| (6) |
Leading to the following expression for the average KMT lifetime:
| (7) |
After determining values [i], i = (0,…N0) from the system (3), the average KMT lifetime was found from Eq. (7). Thus, this model allowed the explicit calculation of the average KMT lifetime for different molecular parameters of MAPs, such as the total number of MAPs per site, kon and koff.
Numerical Simulations of the Kinetochore Interface with Multiple MT-Binding Sites
Model of the entire kinetochore was constructed analogously. The kinetochore was represented with a series of individual MT-binding sites. The number of sites at the kinetochore, Nsites, and the probability of a MT to encounter one site, Pat, were estimated as described in section “Choice of Model Parameters”.
Calculations were carried out using a stochastic simulation algorithm schematized in Fig. 1c. The simulation begins with the kinetochore with all MT-binding sites unoccupied by MTs. The following steps were then executed at each time tn = tn−1 + Δt, where Δt is time of one iteration:
-
Step 1. Binding of MTs to unoccupied MT-binding sites The probability for a MT to bind to unoccupied site Ψat during Δt was calculated as follows:
(8) Then, for each unoccupied site the random number p from the range [0, 1] was generated. If p was smaller than Ψat, the MT-binding site became occupied and one MAP from this site became attaches to this MT. If p was larger than Ψat, the MT-binging site remained free.
-
Step 2. Binding of new MAPs to the site-bound MT The probability Ψon for a MAP to bind to the MT that was already bound to at least one MAP at the site during Δt was calculated as follows:
(9) Then, for each unattached MAPs within the occupied sites, the random number p from the range [0, 1] was generated. If p was smaller than Ψon, this MAP was called “bound” to the MT. If p was larger than Ψon, this MAP remained unbound.
-
Step 3. Detachment of MAPs from the site-bound MT The probability Ψoff for a MAP to dissociate from the MT during Δt was calculated as follows:
(10) where N denoted the number of MAPs associated with this MT. For each attached MAP the random number p from the range [0, 1] was generated. If p was larger than Ψoff, this MAP remained attached to the MT. If p was smaller than Ψoff, the MAP dissociated from the MT.
Step 4. Detachment of the MTs from the kinetochore The calculations were stopped for the MTs that have lost all attachments with MAPs. The unoccupied sites became available immediately for interactions with the incoming MTs (see Step 1).
-
Step 5. For the above iteration sequence we recorded the time t, total number of MTs and lifetimes of all detached MTs to calculate average KMT lifetime τ.
Steps 1–5 were repeated 7.2 × 10⁶ times, which corresponds to simulation time 2 h.
Choice of Model Parameters
Number of MT binding sites per kinetochore (Nsites)
Structural studies using electron microscopy suggest that up to 50 MTs can bind to a kinetochore in PtK1 cells.27 We used this maximum number to reflect the abundance of MT-binding sites at the kinetochore and to allow comparing our results with these structural data.
Number of MAPs per site (N0)
The number of MAPs per site was estimated based on the measured number of NDC80 complexes per KMT at kinetochore. According to Lawrimore et al.24 there are about 20 NDC80 complexes per KMT. Other studies suggest that this number may be smaller.5,22,38 In the model we carried out most of our calculations for N0 = 12 (average of different estimates), but we also show that our main conclusions remain true if the number of MAPs per site is larger. Since the kinetochore proteins other than NDC80 are also involved in binding to KMTs,35 the number of MAPs that bind one KMT is unlikely to be small. For comparison, Dam1 ring contains 16 subunits,44 while in the sleeve model there were 65 MAPs per KMT.20
Association rate for MAP–MT binding (kon)
The plausible range for the association rate of kinetochore MAP was estimated using available in vitro data for NDC80 complex. The approximate volume of the kinetochore in PtK1 cells is estimated based on data from McDonald et al.26: 0.45 × 0.45 × 0.1 = 0.02 μm3, so the approximate concentration of kinetochore-bound NDC80 is 50 μM. From the association rate of S. cerevisiae NDC80 protein measured in vitro (1.2 μM−1 s−1, as reported in Powers et al.33) we estimate that kon is 1.2 × 50/12 = 5 s−1. The analogous estimate for human NDC80 complex is 95 s−1.41 In our simulations we used the range of kon from 1 to 100 s−1.
Dissociation rate (koff) was varied in the model to achieve the physiological KMT lifetime: 3.5–10 min.11,13 This molecular parameter corresponds to the lifetime (= 1/koff) of molecular interaction between MAP and MT, so we also refer to it as MAP’s residency time. Only model solutions for which koff was larger than 2 s−1 were analyzed to ensure that our conclusions do not depend strongly on MT dynamics. Indeed, for residency time <500 ms, the MAP should detach on average faster than the average dissociation of tubulin dimers from the depolymerizing KMT plus-end, assuming that dissociation takes place at 1 μm min−1, the rate of KMT depolymerization.32
The probability of a new MT to encounter one site (Pat) was estimated based on a configuration at steady-state, when the rate of formation of new MT attachments V+ equals to V−—the rate of MTs detachment The rate V+ is proportional to the product of Pat and association rate kon. It is also proportional to the total number of MAPs in one site N0, the total number of binding sites Nsites and the normalized kinetochore area that is available for MT binding. Based on electron microscopy studies,26 which found that in PtK1 cells the KMTs were located at least Lmin distance from each other, each MT occupies the area ( ). This leads to an additional factor in the expression for V+ that corresponds to the ratio between kinetochore area available for MT binding ( ) and the total kinetochore area ( ). Therefore, the rate of formation of new MT attachments V+ is given by:
| (11) |
where Lkin = 450 nm is the linear size of the kinetochore, Lmin = 35 nm is minimal distance between the KMTs.26
If KMT detachments are stochastic, the rate of detachment (V−) is:
| (12) |
where NMT is the average number of MTs in the kinetochore fiber and τ is the average KMT lifetime, which characterizes the rate of KMT turn-over.
At steady-state, such as seen at metaphase kinetochores, there is no net change in the number of MTs. Therefore:
| (13) |
Using NMT = 25 (McDonald et al.26) and τ = 10 min (DeLuca et al.13), we obtain Pat = 1.2 × 10⁻⁵. This parameter was fixed in all model calculations, but we find that its exact value does not affect the major results of our study.
Time step for iterations (Δt) was chosen to be at least two orders of magnitude smaller than the fastest time parameter. For kon = 10 s−1, Δt was chosen as 1 ms.
Cooperativity parameter (ω)
The plausible range for the cooperativity parameter was also estimated from published results for NDC80 complex since it is the most well studied kinetochore MAP. NDC80 binding to MTs is known to be cooperative,10 but the estimated degree of cooperativity based on fluorescent microscopy is low: ω = 3.4, which corresponds to Hill’s coefficient 2.2.41 However, other authors suggest a much more cooperative interaction.3,4 This conclusion was based in part on the highly uneven decoration of the MTs by NDC80 in vitro, as viewed with cryoelectron microscopy (Fig. 2a). To estimate the value of ω that could have produced such heterogeneous decoration, we used a simple stochastic model, in which one protofilament was represented by a linear array of 104 binding sites (Fig. 2b). With this model we calculated the average size of a cluster (number of MAPs bound adjacently on the array) as a function of ω. This dependency was then extrapolated to the cluster size of 90 MAPs (see legend to Fig. 2a), leading to ω = 400 (corresponding to Hill’s coefficient of 8.5). This value is the underestimate since the actual length of the decorated MT was likely longer than that used for our estimate of cluster size. For comparison, the cooperativity of oxygen binding to hemoglobin has Hill’s coefficient 2.3–3.0.19 For our calculations, we varied ω in 1–400 range.
FIGURE 2.
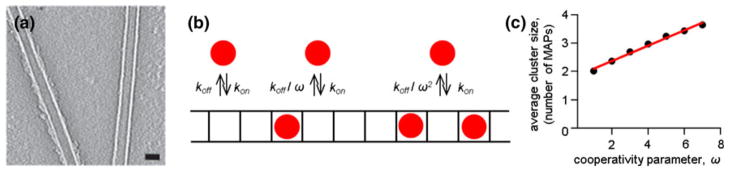
Quantitative estimation of the range of cooperativity parameter for NDC80 complexes. (a) Cryo-electron microscopy image of the MTs pre-incubated with soluble NDC80 protein shows the drastically different degree of protein decoration. The length of MT on the left is about 350 nm, which corresponds to 90 NDC80 complexes bound to each protofilament, assuming that NDC80 binds every tubulin monomer.45 Bar is 25 nm. Reproduced with permission from Alushin et al.4 (b) Simplified model to estimate the degree of cooperativity that leads to complete decoration of one but not the adjacent MT, as seen in (a). All binding sites are unoccupied at the beginning of simulation; then MAPs (red circles) bind with association rate kon but their dissociation is inhibited due to cooperativity. See “Model Description” for details. (c) Plot shows how the cooperativity parameter affects the average size of a cluster of MAPs. Calculated for kon = 1 s−1 and on average 50% occupancy of the binding sites in the linear array.
RESULTS AND DISCUSSION
Fraction of MT-Bound MAPs as a Key Determinant of the Lifetime of MT Attachment
First, we used the model of a single MT-binding site that contained N0 = 12 individual MAPs. The system of Eq. (3) was solved analytically to obtain a steady-state solution for different molecular kinetic rates of the MAP’s binding (kon) and unbinding (koff) reactions. This led to the average KMT lifetime of MT attachment to the MT-binding site, i.e., the time interval during which at least one MAP was found in the MT-bound state. Figure 3a shows that when the molecule rates are varied from 1 to 100 s−1, the average KMT lifetime changes more than 3 orders of magnitude from 1 to 103 min. For all parameters values, however, there was a physiological solution that corresponds to the measured MT stability in metaphase (10 min). With increasing kon, the value of koff that provided the physiological solution also increased. Such solutions were found within a narrow sector on a two-dimensional plot of MT stability (white color, Fig. 3a), suggesting that a ratio of these constants, referred to as the dissociation constant KD = koff/kon, controls the average KMT lifetime. We plotted the average KMT lifetime as a function of the dissociation constant and found that the resulting dependence is very sharp (Fig. 3b). For example, when kon = 10 s−1 (blue curve) only 20% range in KD values spans the physiologically rate of KMT turnover in prometaphase and metaphase and even includes the lifetime of the highly stable MTs in cells with inhibited KMT turnover. Interestingly, changing the kon from 1 to 100 s−1, which includes the likely physiological range for this parameter (see “Choice of Model Parameters” section), shifted this curve slightly, while the range of KD values at which metaphase MT stability was achieved remained in a very narrow range: from 0.5 to 1.2. In this range, the average KMT lifetime depended strongly on KD (Fig. 3b). To analyze the origin of this sharp dependence, we calculated the average number of MAPs that were in contact with the MT for different KD values. When KD vas varied from 0 to 10, the number of MT-bound MAPs decreased sharply from 12, the number of available MAPs in one MT-binding site, to less than 2 MT-bound complexes per KMT (Fig. 3c). Importantly, there was no significant difference in the predicted number of MT-bound MAPs for different values of the association rate kon, and the curves for different kons overlapped completely. For values of KD in the range of 0.5–1.2, the average number MAPs that were bound to MT was very narrow: 6–8, corresponding to the fraction of bound MAPs of 0.50–0.67. The change in MT-binding affinity during mitotic progression is a consequence of a very small increase in the average number of MT-bound MAPs: from 12 available MAPs only 1 more MAP on average is found in the MT-attached state in metaphase vs. prometaphase. We conclude that when the MT-binding site contains multiple MAPs that attach randomly to one MT, the difference in binding of only few molecules spans the entire physiological range of MT stability.
FIGURE 3.

Analysis of a model with single MT-binding site in case of non-cooperative binding. (a) Two-colored chart shows average KMT lifetime at one site with MAPs that bind the MT with indicated association and dissociation rates. Horizontal hatching corresponds to highly unstable MTs with lifetimes <1 min. Vertical hatching corresponds to overly stabilized MTs with lifetimes >103 min. Gray bar at the bottom of the plot indicates the region with model solutions for koff <2 s−1, which was excluded from subsequent analysis. (b) Plots show the relationship between average KMT lifetime and dissociation constant KD for individual MAPs in a MT-binding site for indicated values of kon. Curve for kon = 1 s−1 corresponds to model solutions for which koff <2 s−1, so they were excluded from further analysis. One can see that the impact of absolute value of kon on this dependence is small. “Stabilized” MTs have lifetime 200 min; such stable KMTs are not seen during normal mitosis but can be obtained when Aurora B kinase, which is one of the major MT-destabilizing factors, is inhibited.11 (c) Plots show how the number of NDC80 complexes per KMT depends on the value of dissociation constant for three different values of kon. The predicted results do not depend on the value of kon, so the curves overlap completely. Broken line shows the maximum number of NDC80 complexes per site. Pink bar shows the range of KD that corresponds to the physiological KMT stability. (d) Dependence of the average KMT lifetime on the lifetime of individual MAPs was calculated for KD values from 0.4 to 1; these values correspond to 6–8 MAPs bound to one MT at steady-state (pink vertical bar in (c)). This plot was obtained for kon = 10 s−1 but similar results were obtained for kon ranging from 1 to 100 s−1. Different colors show model solutions for different number of MAPs per MT-binding site (12 and 20).
Highly Transient Molecular Interactions Underlie the Physiological Attachments Between the MT and Kinetochore Binding Site
Although the exact values of the kinetic constants for kinetochore MAPs in vivo are not known, the relatively weak impact of kon on the number of MT-bound MAPs for a given value of KD allows the explicit prediction of the relationship between the time-scales of molecular interactions and the average KMT lifetime. Figure 3d shows that the MT-residency time of the individual MAPs that produces the biologically relevant stability of MT attachments is extremely narrow. Even when the average KMT lifetime as long as 104 s, which corresponds to the highly stabilized KMTs, is included in this range the lifetime of molecular interactions lies between 100 and 250 ms. These results were calculated for the MT-binding site containing 12 MT-binding proteins. The exact number of the molecular links between the kinetochore and one MT is not known, but it is likely to be similar to the number we used or higher. For example, the estimated number of the NDC80 complexes, which represent the major MT-binding component of the kinetochore is 6–20 per MT,5,22,24 and additional attachments can be made by other kinetochore MAPs.35 Importantly, the main conclusions of the MT-site model do not depend on the number of MAPs that form MT binding site. Indeed, with increasing number of MAPs per MT-binding site, the dependency in Fig. 3d shifts to even shorter molecular lifetimes, increasing the disparity between two time scales. This can be seen, for example, from the results of analogous calculation for N0 = 20 MAPs per MT, shown in Fig. 3d in red. Also, with more MAPs per site, the curve becomes steeper, implying that for larger N0, the physiological adjustment of the MT turnover during mitosis requires even smaller changes in the kinetics of molecular interactions. For example, for N0 = 12 the lifetime of MAP’s binding in metaphase is 30 ms longer than in prometaphase, while for N0 = 20 this time difference is 14 ms.
Cooperativity Strongly Amplifies the Influence of Molecular Parameters on MT Attachment Stability
The above calculations were carried out for a model which assumed that MAPs binding to MT was not cooperative (ω = 1). Next we examined how cooperativity, i.e., the enhancement of MAP–MT affinity in the presence of adjacently bound MAPs, affects the average KMT lifetime. Figure 4a shows the predicted average KMT lifetimes for the values of ω from 1 to 8; these values corresponds to Hill’s coefficients 1 and 2.5, respectively. One can see that the average KMT lifetime of 3–10 min could be obtained for all degrees of cooperativity, however, larger degree of cooperativity required larger values of the dissociation constant KD, which increased non-linearly with increasing ω. Figure 4b illustrates that for exceedingly large values of the cooperativity parameter, such as implied by the NDC80–MT binding observed by electron microscopy (see “Choice of Model Parameters” section), the metaphase KMT stability was achieved in the model when MAP–MT interactions were highly unstable. For example, for ω = 400 (Hill’s coefficient 8.5) the dissociation constant reached 4,000. Such weak affinity means that the molecular binding events are highly transient. Figure 4c shows that when ω was varied from 1 to 400, this led to a reduction in the MAP’s residency time on the MT from fractions of a second to fractions of a millisecond, a 103-fold decrease. At the same time, the number of MAPs that were bound to the MT at steady-state increased with increasing ω. This increase was very sharp when ω was varied from 1 to 20, but then this dependency became less steep, and for ω = 50–400 the average number of the MT-bound MAPs was 11. For larger ω it tended to 12, the maximum possible number of MAPs per binding site. Importantly, the cooperative binding strongly amplified the above described effects for the non-cooperative interactions. With increasing ω there was even larger disparity between the molecular and macroscopic time scales (Fig. 4d). Furthermore, when MAP binding is highly cooperative, a very small increase in the lifetime of individual molecules is dramatically amplified within the binding site, thereby strongly stabilizing the MT attachment. For example, for ω = 100 (Hill’s coefficient 7.8), the physiological MT stabilization during mitotic progression would require that ω increases less than 5%. Such high sensitivity to the input values can lead to a strong instability due to random changes in molecular parameters or if there is a slight variability in the number of MAPs per MT-binding site.
FIGURE 4.

Impact of MAP cooperativity on MT-MAP interactions at one MT-binding site. (a) Color chart shows the dependency of average lifetime of MT attachment at MT binding site on the values of cooperativity parameter ω and dissociation constant KD. See legend to Fig. 3a for details. (b) Plot shows values of the cooperativity parameter and dissociation constant KD that produce average KMT lifetime 10 min, mimicking the KMTs in metaphase PtK1 cells. (c) Blue curve shows how the average lifetime of MAP’s binding depends on the cooperativity parameter at the physiological rate of KMT turn-over (10 min). Red curve shows the average number of MT-bound MAPs per KMT for different values of cooperativity. (d) Dependence of the average KMT lifetime on the lifetime of individual MAPs was calculated for kon = 10 s−1. For ω>10 the data are not shown because the curve practically merges with the Y axis.
Kinetochore Interface with Multiple MT-Binding Sites is Highly Sensitivity to the Molecular Parameters of MT-Binding Proteins
Kinetochore–MT interface is thought to contain multiple MT-binding sites, so we examined whether our conclusions obtained with the one-site model were valid when the entire kinetochore–MT interface was considered. As above, each site was modeled as containing 12 MAPs. One MT could simultaneously interact with all proteins forming this, but not the other sites. The total number of binding sites in our model was chosen to match the maximum number of MTs that could bind to the kinetochores in PtK1 cells, as found with electron microscopy (Nsites = 50; McEwen et al.27). Since in the model the total number of sites is twice larger than the average number of KMTs in these cells (25),26,27 the model can examine the kinetochore–MT occupancy without imposing a significant limit on the number of attached MTs. The kinetochore model also has an additional parameter Pat, which describes the probability for a new MT to encounter the kinetochore MT-binding site (Fig. 5a). The value of this parameter was estimated as specified in the section “Choice of Model Parameters” (Table 1). Molecular interactions between MT and MAPs were calculated for ω = 3 (Hill’s coefficient 1.7). For this value of cooperativity, the steady-state rate of KMT turnover was obtained for KD = 2.7. Figure 5b shows that for these parameter values, the number of kinetochore-bound MTs reached a plateau in 10–15 min, which corresponds well to the time of kinetochore fiber maturation in PtK1 cells.27 There is a noticeable stochasticity in the kinetics of KMT attachments but at steady-state, the predicted number of KMTs lies between 20 and 30, which is in a good agreement with experiment26,27 (Fig. 5c). Thus, the model provides good quantitative description of several key aspects of kinetochore–MT interactions, including the rate of KMT turnover, kinetics of the formation of the kinetochore fiber, and its average size.
FIGURE 5.

Model of kinetochore interface with multiple MT-binding sites. (a) Schematic of the kinetochore interface with multiple MT-binding sites (only part of the kinetochore is shown). After MT encounters one of the binding sites with probability Pat, it immediately initiates molecular interactions with all MAPs within this site. Values of model parameters that were used to obtain results in this figure are listed in Table 1. (b) Results of three independent simulations of the kinetochore model. Time zero is a start of calculation, corresponding to the initiation of MT binding to the kinetochore. Grey bar indicates the range for the number of KMTs that was found at metaphase in PtK1 cells.26 (c) Distribution of the number of MTs per kinetochore in the model with multiple MT binding sites at steady-state. The average predicted KMT number is 25.6 per kinetochore, consistent with structural studies in PtK1 cells.26 (d) This graph illustrates how molecular parameters KD or ω need to be adjusted to provide the observed stabilization of KMT attachments during metaphase. The average KMT lifetimes in prometaphase and metaphase were 3.5 and 10 min, respectively.11,13 The average KMT lifetime in prometaphase was obtained for KD = 3.2 and ω = 3; to calculate average KMT lifetime in metaphase, for columns “KD is regulated” the value of ω was not changed, and KD was found to be 2.7, which is 84% of the prometaphase value. For “ω is regulated” columns the value of KD was not changed, and ω was found to be 3.4, which is 113% of its prometaphase value. (e) Schematic that illustrates quantitative relationship between two time-scales in the model: the lifetime of molecular interactions (microscopic parameters KD and ω) and average KMT lifetime (experimentally measured KMT turnover rate).
TABLE 1.
List of model parameters used for stochastic simulations of kinetochore interface with multiple MT-binding sites (data shown in Fig. 5).
| Symbol | Model parameter | Value | Units |
|---|---|---|---|
| kon | association rate for a MAP | 10 | s−1 |
| koff | Dissociation rate for a MAP | 27 | s−1 |
| KD = koff/kon | MAP dissociation constant | 2.7 | Nonea |
| x | Cooperativity parameter for MAPs–MT interactions | 3 | Nonea |
| Pat | The probability of a new MT to encounter one MT-binding site | 1.2 × 10⁻⁵ | Nonea |
| N0 | Number of MAPs per binding site | 12 | Nonea |
| Δt | Time step in the computational algorithm | 1 | ms |
| Nsites | Total number of MT-binding sites per kinetochore | 50 | Nonea |
Dimensionless parameters.
We then examined the range of changes in molecular parameters that could bring about the dynamic changes in average KMT lifetime that are normally seen in mammalian cells as they transition from prometaphase to metaphase. Figure 5d shows the results of two extreme scenarios, in which such stabilization was achieved either by adjusting only the dissociation constant or the cooperativity. If regulation is achieved via changing the KD, the corresponding stabilization would require that it decreases 16%; if the cooperativity parameter ω is the main regulatory factor— it would need to increase by 13%. Obviously, when both parameters are adjusted, the corresponding changes in each of the parameters would be even smaller. Thus, the KMT interface with multiple sites strongly amplifies the molecular features of MT-binding MAPs, such that small changes in their affinity and/or cooperativity have a pronounced effect on the life time of KMT attachments.
In summary, with a stochastic mathematical model, we systematically examined for the first time how the molecular characteristics of a kinetochore MAP influence the experimentally measured behavior of the MT-containing kinetochore fiber. The outcome of such theoretical findings clearly depends on the exact molecular design of the modeled interface between kinetochore and MTs. The design of the MT-binding site described here is simple and straightforward, and we show that the main model conclusions hold true (or are enhanced) for a very wide range of model parameters, most importantly for different number of MAPs per MT-binding site. Even though the physiological rate of KMT turnover can be achieved for all values of binding/unbinding rates, the range of corresponding KD values is very narrow and it indicates that the lifetime of molecular bindings of the kinetochore MAPs must be 4 orders of magnitude shorter than the average KMT lifetime (Fig. 5e). The molecular MAP–MT binding interactions are therefore highly transient and each binding event lasts for only 30–50 ms (Fig. 4d). Importantly, when MT-binding site contains multiple MAPs, the small changes in their molecular constants are predicted to have a strong effect on KMT stability. This conclusion remains valid for the KMT interface containing multiple MT-binding sites regardless of their spatial arrangement, as long as they bind MTs independently of each other.
Future work is necessary to determine molecular details of MT-interactions of the kinetochore protein complexes such as NDC80, Ska1 and others, and to measure how they change during mitotic progression, so that these model predictions can be tested in a quantitative way. It should be noted, however, that binding between MAP and MT might be affected by the dynamic nature of MT polymers. Although our model does not incorporate the MT dynamics explicitly, model solutions considered here correspond only to the MAP–MT interactions that are faster than the rate of tubulin subunit dissociation. In this range of model parameters, the predicted lifetime of KMT attachments should be relatively insensitive to the tubulin dynamics per se. MT dynamics can also manifest itself in MAP–MT interactions if MAP’s binding affinity is modified by tubulin’s biochemistry or shape. While some MAPs, e.g., Ska1 complex, are likely to bind the polymerizing and depolymerizing MT ends with similar affinity, the binding strength of NDC80 to different MT structures is different.4,36 However, high-resolution localization studies suggest that at the kinetochores the NDC80 complex binds to the MT lattice, not MT tip,43 in which case its interactions with the MTs should not depend on its dynamics and the main model conclusion remain unaffected. Much less is known about how these molecular binding events are affected by a load, an important feature of the kinetochore physiology which is not yet included in our model. Experiments with beads coated with purified proteins and isolated kinetochores in vitro show a relatively weak dependence of the MT attachment time on a moderate load,1,16,33,42 but more direct measurements of how the magnitude and direction of force affect single molecule binding events, as modeled here, are not yet available. In this respect we note that if the affinity between MT and kinetochore complexes, such as NDC80, is weakened by force considerably, the model conclusions continue to remain valid but the values of all molecular constants should be interpreted as force-dependent (i.e., the residency time of MAPs in the absence of force could be longer than what is modeled here, while the force-dependent interactions will be expected to be highly transient).
Our modeling also suggests that the MT-binding of the kinetochore MAPs is unlikely to be very cooperative. This conclusion is supported by the recent finding that the cooperativity of MT-NDC80 binding in vitro had cooperativity parameter ω = 3.4 ± 0.5 (Hill’s coefficient 2.2 ± 0.2; Umbreit et al.41). Our results do not support the view that kinetochore–MT interactions are regulated in a significant way by the changes in cooperativity of NDC80–MT binding.3,4 Figure 5d shows that even when cooperativity is weak (Hill’s coefficient 1.7), only a 15% change in KD is sufficient for eliciting the MT stabilization typical to metaphase. Such decrease in the dissociation constant corresponds to the change in energy of MT binding of only 0.24 kBT. When cooperativity is stronger, e.g., Hill’s coefficient is 3, the physiological stabilization will have to rely on roughly twice smaller changes in the MT-binding energy. Such a regulatory mechanism seems highly unlikely because of its sensitivity to natural variability in molecular parameters of MAPs and their number, as well as due to thermal noise. It is not clear why the electron microscopy images of MTs preincubated with highly concentrated solution of recombinant NDC80 produce highly heterogeneous population of MT decoration (Figure 2A, from Alushin et al.4). Similar images are also obtained with other MT-binding proteins, although their biochemical analyses and established biological functions do not involve a high degree of cooperativity.34,37 It seems likely that a high heterogeneity of MT decoration reported by cryo-electron microscopy might be an artifact of some aspect of a sample preparation procedure. Our experimental work with GFP-labeled NDC80 proteins shows the homogeneous decoration of MTs when experiments are carried out with reagents that block the non-specific protein binding to a surface of microscopy chamber, but highly heterogeneous MT decoration is seen when such blocking reagents are omitted (unpublished observation). Future work should examine quantitatively how cooperativity of NDC80–MT binding changes in response to mitotic phosphorylation.
The key feature that sets apart the current model of kinetochore–MT interface and leads to these molecular conclusions is the independent character of individual MT-binding events between kinetochore MAPs and MT. Previous mathematical models of the kinetochore–MT binding site included specific structural features that limited the independence of MAP–MT interactions.6,15,20,21,25,33,39 Lifting this restriction has a surprisingly large effect on the kinetics of MT attachment and this system’s thermodynamics. For example, in Hill’s sleeve model, the number of possible MT–MAPs binding configuration is only 65, which is equal to the number of MAPs in the sleeve.20 This system tends asymptotically to a state with minimum free energy, when the MT is fully inserted and all 65 MAP connections are made. This outcome is not affected significantly by the molecular constants of MAP–MT binding. However, when MAPs can bind to the MT independently, as in our model, the number of possible configurations is significantly larger. For 12 MAPs per binding site, there are 4096 possible MAP–MT configurations, because multiple combinations of MAPs can produce a configuration with the same number of molecular bonds. Consequently, the entropic component in this system is significantly larger than in Hill’s sleeve, and the steady-state solution is achieved when the average number of MT-bound MAPs is less than total number of available MAPs per site. The lifetime of such MT attachments depends strongly on the molecular parameters of MAP–MT binding. This and other new insights into the general aspects of MT interactions with the MAP-containing sites will hopefully promote further theoretical and experimental analysis of the overall design and molecular characteristics of mitotic kinetochore.
Acknowledgments
We thank members of the Grishchuk and Ataullakhanov laboratories, J. DeLuca and E. Ballister for stimulating discussions; A. Potapenko for reading of the manuscript; J.R. McIntosh for supporting this project (GM033787). This work was supported by National Institutes of Health Grant GM098389 to ELG, by Russian Academy of Sciences Presidium Grants “Mechanisms of the Molecular Systems Integration” and “Molecular and Cell Biology programs” and by Russian Fund for Basic Research Grant 12-04-00111-a to FIA. ELG is a Kimmel Scholar.
ABBREVIATIONS
- MAP
Microtubule-associated protein
- MT
Microtubule
- KMT
Kinetochore microtubule
References
- 1.Akiyoshi B, Sarangapani KK, Powers AF, Nelson CR, Reichow SL, Arellano-Santoyo H, Gonen T, Ranish JA, Asbury CL, Biggins S. Tension directly stabilizes reconstituted kinetochore–microtubule attachments. Nature. 2010;468(7323):576–579. doi: 10.1038/nature09594. [DOI] [PMC free article] [PubMed] [Google Scholar]
- 2.Alberts B, Johnson A, Lewis J, Raff M, Roberts K, Walter P. Molecular Biology of the Cell. 5. New York: Garland Science; 2008. pp. 1082–1086. [Google Scholar]
- 3.Alushin GM, Musinipally V, Matson D, Tooley J, Stukenberg PT, Nogales E. Multimodal microtubule binding by the Ndc80 kinetochore complex. Nat Struct Mol Biol. 2012;19(11):1161–1167. doi: 10.1038/nsmb.2411. [DOI] [PMC free article] [PubMed] [Google Scholar]
- 4.Alushin GM, Ramey VH, Pasqualato S, Ball DA, Grigorieff N, Musacchio A, Nogales E. The Ndc80 kinetochore complex forms oligomeric arrays along microtubules. Nature. 2010;467(7317):805–810. doi: 10.1038/nature09423. Molecular Model of a Kinetochore–Microtubule Binding Site. [DOI] [PMC free article] [PubMed] [Google Scholar]
- 5.Aravamudhan P, Felzer-Kim I, Joglekar AP. The budding yeast point centromere associates with two Cse4 molecules during mitosis. Curr Biol. 2013;23(9):770–774. doi: 10.1016/j.cub.2013.03.042. [DOI] [PMC free article] [PubMed] [Google Scholar]
- 6.Armond JW, Turner MS. Force transduction by the microtubule-bound Dam1 ring. Biophys J. 2010;98(8): 1598–1607. doi: 10.1016/j.bpj.2010.01.004. [DOI] [PMC free article] [PubMed] [Google Scholar]
- 7.Bakhoum SF, Genovese G, Compton DA. Deviant kinetochore microtubule dynamics underlie chromosomal instability. Curr Biol. 2009;19(22):1937–1942. doi: 10.1016/j.cub.2009.09.055. [DOI] [PMC free article] [PubMed] [Google Scholar]
- 8.Bakhoum SF, Thompson SL, Manning AL, Compton DA. Genome stability is ensured by temporal control of kinetochore–microtubule dynamics. Nat Cell Biol. 2009;11(1):27–35. doi: 10.1038/ncb1809. [DOI] [PMC free article] [PubMed] [Google Scholar]
- 9.Cheeseman IM, Anderson S, Jwa M, Green EM, Kang J, Yates JR, 3rd, Chan CS, Drubin DG, Barnes G. Phospho-regulation of kinetochore-microtubule attachments by the Aurora kinase Ipl1p. Cell. 2002;111(2):163–172. doi: 10.1016/s0092-8674(02)00973-x. [DOI] [PubMed] [Google Scholar]
- 10.Cheeseman IM, Chappie JS, Wilson-Kubalek EM, Desai A. The conserved KMN network constitutes the core microtubule-binding site of the kinetochore. Cell. 2006;127(5):983–997. doi: 10.1016/j.cell.2006.09.039. [DOI] [PubMed] [Google Scholar]
- 11.Cimini D, Wan X, Hirel CB, Salmon ED. Aurora kinase promotes turnover of kinetochore microtubules to reduce chromosome segregation errors. Curr Biol. 2006;16(17):1711–1718. doi: 10.1016/j.cub.2006.07.022. [DOI] [PubMed] [Google Scholar]
- 12.Civelekoglu-Scholey G, He B, Shen M, Wan X, Roscioli E, Bowden B, Cimini D. Dynamic bonds and polar ejection force distribution explain kinetochore oscillations in PtK1 cells. J Cell Biol. 2013;201(4):577–593. doi: 10.1083/jcb.201301022. [DOI] [PMC free article] [PubMed] [Google Scholar]
- 13.DeLuca JG, Gall WE, Ciferri C, Cimini D, Musacchio A, Salmon ED. Kinetochore microtubule dynamics and attachment stability are regulated by Hec1. Cell. 2006;127(5):969–982. doi: 10.1016/j.cell.2006.09.047. [DOI] [PubMed] [Google Scholar]
- 14.Dong Y, Vanden Beldt KJ, Meng X, Khodjakov A, McEwen BF. The outer plate in vertebrate kinetochores is a flexible network with multiple microtubule interactions. Nat Cell Biol. 2007;9(5):516–522. doi: 10.1038/ncb1576. [DOI] [PMC free article] [PubMed] [Google Scholar]
- 15.Efremov A, Grishchuk EL, McIntosh JR, Ataullakhanov FI. In search of an optimal ring to couple microtubule depolymerization to processive chromosome motions. Proc Natl Acad Sci USA. 2007;104(48):19017–19022. doi: 10.1073/pnas.0709524104. [DOI] [PMC free article] [PubMed] [Google Scholar]
- 16.Franck AD, Powers AF, Gestaut DT, Gonen T, Davis TN, Asbury CL. Tension applied through the Dam1 complex promotes microtubule elongation providing a direct mechanism for length control in mitosis. Nat Cell Biol. 2007;9(7):832–837. doi: 10.1038/ncb1609. [DOI] [PMC free article] [PubMed] [Google Scholar]
- 17.Gardner MK, Pearson CG, Sprague BL, Zarzar TR, Bloom K, Salmon ED, Odde DJ. Tension-dependent regulation of microtubule dynamics at kinetochores can explain metaphase congression in yeast. Mol Biol Cell. 2005;16:3764–3775. doi: 10.1091/mbc.E05-04-0275. [DOI] [PMC free article] [PubMed] [Google Scholar]
- 18.Grishchuk EL, McIntosh JR, Molodtsov MI, Ataullakhanov FI. Comprehensive Biophysics. Vol. 4. Amsterdam: Elsevier; 2012. pp. 93–117. [Google Scholar]
- 19.Hill AV. The possible effects of the aggregation of the molecules of haemoglobin on its dissociation curves. J Physiol. 1910;40:iv–vii. [Google Scholar]
- 20.Hill TL. Theoretical problems related to the attachment of microtubules to kinetochores. Proc Natl Acad Sci USA. 1985;82:4404–4408. doi: 10.1073/pnas.82.13.4404. [DOI] [PMC free article] [PubMed] [Google Scholar]
- 21.Joglekar AP, Hunt AJ. A simple, mechanistic model for directional instability during mitotic chromosome movements. Biophys J. 2002;83(1):42–58. doi: 10.1016/S0006-3495(02)75148-5. [DOI] [PMC free article] [PubMed] [Google Scholar]
- 22.Johnston K, Joglekar A, Hori T, Suzuki A, Fukagawa T, Salmon ED. Vertebrate kinetochore protein architecture: protein copy number. J Cell Biol. 2010;189(6):937–943. doi: 10.1083/jcb.200912022. [DOI] [PMC free article] [PubMed] [Google Scholar]
- 23.Jordan MA, Kamath K. How do microtubule-targeted drugs work? An overview. Curr Cancer Drug Targets. 2007;7(8):730–742. doi: 10.2174/156800907783220417. [DOI] [PubMed] [Google Scholar]
- 24.Lawrimore J, Bloom KS, Salmon ED. Point centromeres contain more than a single centromere-specific Cse4 (CENP-A) nucleosome. J Cell Biol. 2011;195(4):573–582. doi: 10.1083/jcb.201106036. [DOI] [PMC free article] [PubMed] [Google Scholar]
- 25.Liu J, Onuchic JN. A driving and coupling “Pac-Man” mechanism for chromosome poleward translocation in anaphase A. Proc Natl Acad Sci USA. 2006;103(49): 18432–18437. doi: 10.1073/pnas.0608962103. [DOI] [PMC free article] [PubMed] [Google Scholar]
- 26.McDonald KL, O’Toole ET, Mastronarde DN, McIntosh JR. Kinetochore microtubules in PTK cells. J Cell Biol. 1992;118(2):369–383. doi: 10.1083/jcb.118.2.369. [DOI] [PMC free article] [PubMed] [Google Scholar]
- 27.McEwen BF, Heagle AB, Cassels GO, Buttle KF, Rieder CL. Kinetochore fiber maturation in PtK1 cells and its implications for the mechanisms of chromosome congression and anaphase onset. J Cell Biol. 1997;137(7):1567–1580. doi: 10.1083/jcb.137.7.1567. [DOI] [PMC free article] [PubMed] [Google Scholar]
- 28.McIntosh JR, Grishchuk EL, Morphew MK, Efremov AK, Zhudenkov K, Volkov VA, Cheeseman IM, Desai A, Mastronarde DN, Ataullakhanov FI. Fibrils connect microtubule tips with kinetochores: a mechanism to couple tubulin dynamics to chromosome motion. Cell. 2008;135(2):322–333. doi: 10.1016/j.cell.2008.08.038. [DOI] [PMC free article] [PubMed] [Google Scholar]
- 29.McIntosh JR, Grishchuk EL, West RR. Chromosome-microtubule interactions during mitosis. Annu Rev Cell Dev Biol. 2002;18:193–219. doi: 10.1146/annurev.cellbio.18.032002.132412. [DOI] [PubMed] [Google Scholar]
- 30.McIntosh JR, O’Toole E, Zhudenkov K, Morphew M, Schwartz C, Ataullakhanov FI, Grishchuk EL. Conserved and divergent features of kinetochores and spindle microtubule ends from five species. J Cell Biol. 2013;200(4):459–474. doi: 10.1083/jcb.201209154. [DOI] [PMC free article] [PubMed] [Google Scholar]
- 31.Molodtsov MI, Grishchuk EL, Efremov AK, McIntosh JR, Ataullakhanov FI. Force production by depolymerizing microtubules. Proc Natl Acad Sci USA. 2005;102(12):4353–4358. doi: 10.1073/pnas.0501142102. [DOI] [PMC free article] [PubMed] [Google Scholar]
- 32.Nicklas RB. Chromosome velocity during mitosis as a function of chromosome size and position. J Cell Biol. 1965;25:119–135. doi: 10.1083/jcb.25.1.119. [DOI] [PMC free article] [PubMed] [Google Scholar]
- 33.Powers AF, Franck AD, Gestaut DR, Cooper J, Gracyzk B, Wei RR, Wordeman L, Davis TN, Asbury CL. The Ndc80 kinetochore complex forms load-bearing attachments to dynamic microtubule tips via biased diffusion. Cell. 2009;136(5):865–875. doi: 10.1016/j.cell.2008.12.045. [DOI] [PMC free article] [PubMed] [Google Scholar]
- 34.Rank KC, Rayment I. Functional asymmetry in kinesin and dynein dimers. Biol Cell. 2013;105(1):1–13. doi: 10.1111/boc.201200044. [DOI] [PMC free article] [PubMed] [Google Scholar]
- 35.Santaguida S, Musacchio A. The life and miracles of kinetochores. EMBO J. 2009;28(17):2511–2531. doi: 10.1038/emboj.2009.173. [DOI] [PMC free article] [PubMed] [Google Scholar]
- 36.Schmidt JC, Arthanari H, Boeszoermenyi A, Dashkevich NM, Wilson-Kubalek EM, Monnier N, Markus M, Oberer M, Milligan RA, Bathe M, Wagner G, Grishchuk EL, Cheeseman IM. The kinetochore-bound Ska1 complex tracks depolymerizing microtubules and binds to curved protofilaments. Dev Cell. 2012;23(5):968–980. doi: 10.1016/j.devcel.2012.09.012. [DOI] [PMC free article] [PubMed] [Google Scholar]
- 37.Shen QT, Hsiue PP, Sindelar CV, Welch MD, Campellone KG, Wang HW. Structural insights into WHAMM-mediated cytoskeletal coordination during membrane remodeling. J Cell Biol. 2012;199(1):111–124. doi: 10.1083/jcb.201204010. [DOI] [PMC free article] [PubMed] [Google Scholar]
- 38.Shivaraju M, Unruh JR, Slaughter BD, Mattingly M, Berman J, Gerton JL. Cell-cycle-coupled structural oscillation of centromeric nucleosomes in yeast. Cell. 2012;150(2): 304–316. doi: 10.1016/j.cell.2012.05.034. [DOI] [PMC free article] [PubMed] [Google Scholar]
- 39.Shtylla B, Keener JP. A mechanomolecular model for the movement of chromosomes during mitosis driven by a minimal kinetochore bicyclic cascade. J Theor Biol. 2010;263(4):455–470. doi: 10.1016/j.jtbi.2009.12.023. [DOI] [PubMed] [Google Scholar]
- 40.Thompson SL, Bakhoum SF, Compton DA. Mechanisms of chromosomal instability. Curr Biol. 2010;20(6): R285–R295. doi: 10.1016/j.cub.2010.01.034. [DOI] [PMC free article] [PubMed] [Google Scholar]
- 41.Umbreit NT, Gestaut DR, Tien JF, Vollmar BS, Gonen T, Asbury CL, Davis TN. The Ndc80 kinetochore complex directly modulates microtubule dynamics. Proc Natl Acad Sci USA. 2012;109(40):16113–16118. doi: 10.1073/pnas.1209615109. [DOI] [PMC free article] [PubMed] [Google Scholar]
- 42.Volkov VA, Zaytsev AV, Gudimchuk N, Grissom PM, Gintsburg AL, Ataullakhanov FI, McIntosh JR, Grishchuk EL. Long tethers provide high-force coupling of the Dam1 ring to shortening microtubules. Proc Natl Acad Sci USA. 2013;110(19):7708–7713. doi: 10.1073/pnas.1305821110. [DOI] [PMC free article] [PubMed] [Google Scholar]
- 43.Wan X, O’Quinn RP, Pierce HL, Joglekar AP, Gall WE, DeLuca JG, Carroll CW, Liu ST, Yen TJ, McEwen BF, Stukenberg PT, Desai A, Salmon ED. Protein architecture of the human kinetochore microtubule attachment site. Cell. 2009;137(4):672–684. doi: 10.1016/j.cell.2009.03.035. [DOI] [PMC free article] [PubMed] [Google Scholar]
- 44.Westermann S, Wang HW, Avila-Sakar A, Drubin DG, Nogales E, Barnes G. The Dam1 kinetochore ring complex moves processively on depolymerizing microtubule ends. Nature. 2006;440(7083):565–569. doi: 10.1038/nature04409. [DOI] [PubMed] [Google Scholar]
- 45.Wilson-Kubalek EM, Cheeseman IM, Yoshioka C, Desai A, Milligan RA. Orientation and structure of the Ndc80 complex on the microtubule lattice. J Cell Biol. 2008;182(6):1055–1061. doi: 10.1083/jcb.200804170. [DOI] [PMC free article] [PubMed] [Google Scholar]
- 46.Wollman R, Civelekoglu-Scholey G, Scholey JM, Mogilner A. Reverse engineering of force integration during mitosis in the Drosophila embryo. Mol Syst Biol. 2008;4:195. doi: 10.1038/msb.2008.23. [DOI] [PMC free article] [PubMed] [Google Scholar]
- 47.Zhai Y, Kronebusch PJ, Borisy GG. Kinetochore microtubule dynamics and the metaphase–anaphase transition. J Cell Biol. 1995;131(3):721–734. doi: 10.1083/jcb.131.3.721. [DOI] [PMC free article] [PubMed] [Google Scholar]
- 48.Zinkowski RP, Meyne J, Brinkley BR. The centromere–kinetochore complex: a repeat subunit model. J Cell Biol. 1991;113(5):1091–1110. doi: 10.1083/jcb.113.5.1091. [DOI] [PMC free article] [PubMed] [Google Scholar]