Abstract
Although much progress has been made in understanding how gene expression patterns are established during development, much less is known about how these patterns are related to the growth of biological shapes. Here we describe conceptual and experimental approaches to bridging this gap, with particular reference to plant development where lack of cell movement simplifies matters. Growth and shape change in plants can be fully described with four types of regional parameter: growth rate, anisotropy, direction, and rotation. A key requirement is to understand how these parameters both influence and respond to the action of genes. This can be addressed by using mechanistic models that capture interactions among three components: regional identities, regionalizing morphogens, and polarizing morphogens. By incorporating these interactions within a growing framework, it is possible to generate shape changes and associated gene expression patterns according to particular hypotheses. The results can be compared with experimental observations of growth of normal and mutant forms, allowing further hypotheses and experiments to be formulated. We illustrate these principles with a study of snapdragon petal growth.
Research in developmental biology over the last two decades has led to a broadly accepted view of how patterns are elaborated during development of multicellular organisms (1–3). Regional identity is specified by a combination of transcription factors, which can be modified in response to signaling molecules, sometimes called morphogens. Changes in identity may in turn lead to production of further signaling molecules, allowing the pattern of identities to become progressively elaborated. Although this process can account for the establishment of regions with different gene activities, it is unclear how it is coupled to the generation of shape. For example, the mechanisms by which the developing Drosophila wing becomes subdivided through the action of signaling molecules, such as Dpp, has been studied extensively (4), yet the link between these processes and the final shape of the wing remains unknown.
One reason for this lack of progress is that, whereas some aspects of regional patterns can be described qualitatively, growth and shape require quantitative descriptions. For example, it is possible to convey a repeating pattern (e.g., of spots, stripes, hairs, or leaves) or a sequence of regional distinctions along an axis without giving detailed measurements. Similarly, branching topology can be described qualitatively. Mutations that affect particular aspects of such patterns can therefore be recognized and interpreted through their qualitative effects. By contrast, recognizing growth patterns requires detailed measurements of lengths and angles over time (metric descriptions). It is therefore more difficult to interpret mutations affecting shape simply from visual inspection of the phenotype. This means that understanding shape transformations requires a quantitative framework.
Changes in the shape of a developing multicellular structure can be driven by three types of behavior: (i) Tissue growth, involving cell proliferation and/or enlargement. In some cases, growth alone accounts for the shape changes observed. This situation applies to plants where cell walls normally prevent cells from sliding relative to each other (5). (ii) Cell movement, such as cell migration or rearrangement. There are many shape changes that rely purely on movement. For example, in Dictyostelium, the movements of the slug and its transformation into the stalk and fruiting body are driven by cell migration and rearrangement (6). Similarly, gastrulation and the generation of the tubular structures during Drosophila embryogenesis largely involve cell movement (7). There are also many systems, such as the vertebrate limb bud, in which both growth and cell movement contribute to development. Conceptually, growth and cell movement can be distinguished from each other, because they represent distinct cellular behaviors. However, the distinction is less easy to make experimentally, because both growth and rearrangements cause cells to be displaced. (iii) Cell death, which can lead to local arrest of growth or loss of tissue.
In this review, we consider the frameworks needed to understand the generation of shape associated with tissue growth. Principles are illustrated by presenting a preview of ongoing research. Most of the examples are drawn from plant development, where the lack of cell movement simplifies issues. Many of the principles, however, may also be extended to aspects of animal development.
Measuring Growth and Shape Changes
One way of comprehensively describing the growth of a structure is by the velocities at which its points move relative to a fixed coordinate system. These displacement velocities can be represented by vectors, which may vary from point to point, forming what is known mathematically as a vector field. For example, a velocity vector field for a disk growing uniformly in all directions at all positions (isogonic growth) is shown in Fig. 1a. In this case, velocity increases linearly with increasing distance from the central reference point (if the disk doubles in radius, a point 1 mm away from the center will travel a distance of 1 mm, whereas a point 10 mm from the center will travel 10 mm).
Fig. 1.
Velocity fields for a growing disk. (a) Isogonic growth with velocities shown relative to the center. (b) Growth mainly near the rim with velocities shown relative to the center. (c) Isogonic growth with velocities shown relative to the base of the disk.
There are many different ways in which a transformation in overall shape can be brought about. Enlargement of a disk, for example, could reflect radially directed growth mainly near the rim rather than isogonic growth, corresponding to a different velocity field (Fig. 1b). The changing outline of a structure alone therefore gives little indication of the underlying velocity field. Consequently, velocity fields need to be determined experimentally by using internal markers.
The most direct way of obtaining this information is by tracking the position of multiple landmark positions over time. For example, growth of individual leaves has been tracked with ink dots or natural landmarks (8–13). This is limited to later stages of development, when leaves are large enough to be tracked effectively. Earlier stages have been monitored by using scanning electron microscopy of epoxy resin casts of plants to track cell outlines (14–16). In animals, cell-labeling experiments have mostly been used to follow particular lineages rather than for defining velocity fields, although fluorescent-labeled cells have been used to derive quantitative data on neural elongation in Xenopus explants (17).
Although velocity fields can give a comprehensive account of growth, they are not the most useful representation from a biological perspective, because they refer to properties of points rather than regions. In the isogonically growing disk, for example, the relevant biological property is that each region grows at the same rate in all directions. This is not conveyed directly by the velocity field (Fig. 1a). Moreover, the velocity field depends on the choice of reference point. If velocities are measured relative to the base of the disk instead of the center, the field will look quite different (Fig. 1c).
A more useful description of growth is in terms of the local growth characteristics of regions (18–22). If we subdivide a structure into a large number of small regions (ideally of infinitesimal size), each region may undergo changes during growth that can be accounted for by four types of parameter (Fig. 2). (i) Growth rate, the rate at which a region changes in size (e.g., area or volume), which may eventually drop to zero as the structure attains a final size. (ii) Anisotropy, the degree to which growth occurs preferentially in any direction, which can be expressed by the ratio in growth rate along orthogonal axes. These axes correspond to directions of maximal or minimal growth (also known as the principal directions of growth). If growth is equal in all directions, then growth is isotropic. (iii) Direction, the angles at which the principal directions of growth are oriented. One of these will be the direction of maximal growth (i.e., main direction of growth). (iv) Rotation rate, the angle through which the region turns relative to other regions per unit time. Unlike the other parameters, rotation is not a regional growth property, because there is no change in shape or size, only a change in relative orientation.
Fig. 2.
Four types of regional parameter for describing growth properties.
For a 2D structure, four parameters are needed to specify the behavior of each region during a given time step (one for growth rate in area, one for anisotropy, one for direction, and one for rotation rate), whereas for a 3D structure, nine parameters are needed (one for growth rate in volume, two for anisotropy, three for direction, and three for rotation). These parameters can also be captured by a single measure termed a growth tensor, with four or nine components, depending on dimensionality (21). Once the parameters are known, the way a region will be deformed during a time step and hence the velocities of its vertices can be computed. Conversely, once the velocities of the vertices are known, it is possible to estimate the growth parameters for a region.
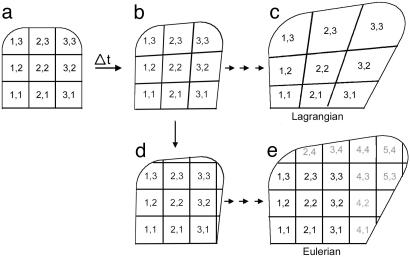
When describing shape changes, we need to consider growth parameters for multiple regions over multiple time steps, which can be done in two ways, depending on how regions are specified (19). For example, suppose we start with a 2D structure divided into a regular grid of nine regions, labeled with a pair of indices (1,1), (2,1)... (i,j) according to their spatial coordinates (Fig. 3a). Over a time step Δt, growth will deform the grid and give corresponding regions at a slightly later time (Fig. 3b).
Fig. 3.
Initial shape with nine regions (a) grows during a time interval Δt to a new shape (b). With a Lagrangian specification, the same material points are progressively followed, leading to a deformed grid (c). With an Eulerian specification, regions are redefined at each time step according to a fixed coordinate system (d), leading to further regions being added to a regular grid (e).
For the next time step, we have two options. The Lagrangian approach is to use the deformed grid (Fig. 3b) as a new starting point and to determine how each of its regions is deformed further. Repeated application of this option over successive time intervals will lead to an increasingly deformed array of regions (Fig. 3c). Conceptually, the Lagrangian approach defines regions in terms of their material constituents. The pattern of connections between regions (regional topology) is maintained, but the indices of regions at later times are not directly related to their spatial coordinates. Thus, regions reflect history rather than absolute position in space.
With the Eulerian approach, regions are respecified after the first time step according to the original spatial coordinate system (Fig. 3d). The newly defined regular array is then used as the starting point for the next growth step. Repeating this procedure of growth followed by grid adjustment over successive time steps leads to the introduction of more regions as the structure occupies more of the predefined space (Fig. 3e). As the structure grows, each region effectively remains fixed while material of the structure passes through it. Thus, cells in the region labeled (1,1) at a later time need not be derived from cells of region (1,1) at an earlier time. Regions are defined on the basis of position rather than history.
In describing changes in overall shape of a structure in terms of its component regions, we have assumed that the connectivity between regions is maintained as the structure grows (i.e., regions do not slide relative to each other). This situation applies to plant development where cell movement is restricted. For animal development, this assumption may not hold when regions correspond to individual cells, because these can often slide relative to each other. However, it may be a reasonable approximation for some multicellular regions. For example, connectivity is broadly preserved during wing formation in Drosophila, as evidenced by the fact that marked clones remain contiguous. For vertebrate limb bud development, cells from clones can become intermixed with neighboring cells. However, even here cell dispersion is limited, allowing reliable fate maps with preserved connectivity to be generated (23, 24).
Regional Specification
Because growth parameters may vary from region to region, a first step in explaining shape is to account for how regional differences are elaborated during development. Although Lagrangian (material) and Eulerian (spatial) specifications are useful for describing shape changes over time (i.e., the outcome of development), they are much less appropriate for understanding how regional differences are established, because regional specification during development is neither a Eulerian nor a Lagrangian process.
In the Eulerian view, regions are specified by position relative to a fixed external coordinate system. However, in biological development, regions are largely specified through interactions within the organism rather than with respect to a fixed external framework. A Lagrangian system might therefore seem more appropriate, because it deals with regions based on the organism's material parts. However, a full Lagrangian description would require a correspondence to be established between material in the final state (e.g., the adult or mature organ) and that in the initial state (e.g., the egg or primordium). Such a one-to-one mapping can be performed only if all of the regions in the mature structure are already present in the earlier state (e.g., a mosaic egg or primordium with all of the regions of the mature structure already specified). However, a key feature of development is that regions arise progressively rather than being prefigured.
One way of dealing with this might be to retain the Lagrangian approach but specify new material points and subregions as the structure grows. For example, as region (1,1) grows larger, it could be subdivided into two regions, distinguished by a further index as (1,1,A) and (1,1,B). With further growth, more subdivisions could be added, with labels reflecting the lineage of each region. This approach has been used, for example, to describe Caenorhabditis elegans development in terms of cell lineage (each region corresponding to a cell). However, although such an approach is reasonable for documenting the outcome of development, it does not capture the mechanism by which regions are specified, because these do not depend on cell lineage alone, even in the case of C. elegans (e.g., ref. 25).
To understand the mechanisms by which regions arise during development, we therefore need different frameworks for referring to regions and their dynamics. These frameworks are based on local interactions and combine spatial and historical aspects of development.
Mechanistic Modeling
One approach is to treat the organism as a continuum, with regions identified by local properties, such as the concentration of a particular substance. Regional properties are not specified by reference to a fixed coordinate system, but arise through a series of local interactions that operate over infinitesimal neighborhoods. The pattern of concentrations observed at any time depends on the history of these local interactions. Mathematically, this behavior can be captured by partial differential equations (i.e., equations that differentiate with respect to both space and time), an important class of which are reaction–diffusion systems (26, 27). These types of model have been used extensively to generate patterns such as spots and stripes observed on organisms (28, 29). The approach can also be combined with the notion of thresholds to define discrete regions, such as a region where the concentration of a substance is greater than a certain amount.
A problem with this approach is that it does not naturally capture the modular aspects of development. For example, discrete cellular properties are not inherent to a system that treats the organism as a continuum. To address this problem, we can consider regions as reflecting local interactions between discrete modules (e.g., cells). Changes in module state are driven by processes within the module and by interactions with neighboring modules. This approach has been used to model the expression pattern of transcription factors or signaling molecules in the Drosophila embryo, considered as a linear sequence of nuclei (30) or cells (31). It has also been used to model genetic interactions controlling lateral inhibition (32). These models are based on systems of nonlinear ordinary differential equations (i.e., equations that differentiate only with respect to time).
Local mechanisms for regional specification may be considered within growing or static structures. For growing systems, we need to consider the effect of growth on regional differences. For example, growth may change the distance between sources and sinks of substances, thus changing the overall pattern of their concentrations. Capturing these effects requires methods for incorporating growth into continuous or discrete frameworks.
For continuous models, growth can be implemented by introducing growth parameters defined in a continuous manner over the whole structure. For example, a structure could extend by local isotropic growth with a rate that is uniform throughout (isogonic growth) or that varies continuously from one region to the other. Because the structure is treated as a continuum, the concentrations of substances will be modified according to the various processes operating within it (33–36).
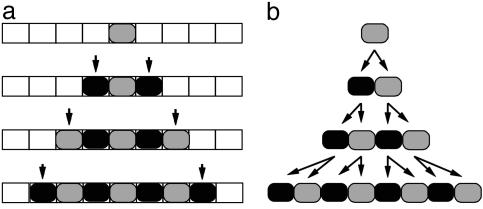
In discrete models, growth can involve two processes: change in module dimensions (i.e., shape and size) and change in module number. To capture change in module dimensions, each module can be treated as a region that grows continuously according to certain parameters. Change in module number has typically been dealt with in two ways. In the case of models based on cellular automata (37–39), new modules can be added only to the outer boundaries of the structure (accretion; Fig. 4a). In the case of Lindenmayer systems, also called L-systems (40, 41), new modules can also arise by subdivision within the structure (Fig. 4b).
Fig. 4.
Growth in module number, illustrated with a 1D filament. (a) For cellular automata, the array is predefined, and modules are added by accretion (arrows). (b) In L-systems, the array grows in parallel with subdivision of modules.
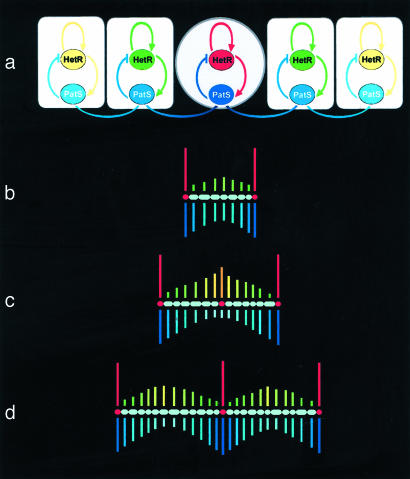
Understanding the generation of shape requires defining not only how growth may affect regional differences, but also how regional differences influence growth. This two-way interaction between growth and patterning can be illustrated by the filamentous bacterium Anabaena. In environments that do not contain nitrogenous compounds, each filament of this organism comprises dividing vegetative cells and evenly spaced nondividing heterocysts. Heterocyst differentiation is mediated by a genetic network, at the heart of which is the interaction between two genes: HetR, producing a protein responsible for the maintenance of the heterocyst identity, and PatS, producing a diffusible protein that inhibits the differentiation of new heterocysts in the neighborhood of the existing ones (42). The genes interact such that HetR up-regulates its own activity and that of PatS, whereas PatS down-regulates the activity of HetR (Fig. 5a).
Fig. 5.
(a) Core gene regulation network that controls heterocyst differentiation in an Anabaena filament. Nondiffusing protein HetR is responsible for the maintenance of the heterocyst state. Diffusing protein PatS inhibits differentiation of new heterocysts in the neighborhood of the existing ones. Red indicates high concentration of HetR, and dark blue indicates high concentration of PatS (courtesy of Carla Davidson, University of Calgary). (b–d) Development of an Anabaena filament, simulated by using an L-system model based on ref. 45. Vertical bars above filaments indicate concentrations of HetR protein; bars below filaments indicate concentrations of PatS protein. High concentration of HetR (red) indicates heterocysts. (b) Two heterocysts separated by a sequence of vegetative cells. (c) Vegetative cells grow and divide, moving the heterocysts apart. As a result, the concentration of inhibitor near the center of the filament decreases and the concentration of the activator increases, leading to differentiation of a new heterocyst. (d) The new heterocyst modifies the distribution of the inhibitor, which prevents clustering of heterocysts.
The observed spacing pattern of heterocysts has been captured by using several L-system models (41, 43–45). In the last of these models, the regulatory network is described by a growing system with reaction–diffusion equations of the activator–inhibitor type (27) and represents the gene regulation network shown in Fig. 5a (45). The spacing pattern results from a two-way coupling between genes and growth. On the one hand, growth and division of vegetative cells influence the expression of genes HetR and PatS by moving heterocysts, sources of inhibitor PatS protein, away from each other. On the other hand, HetR influences growth by promoting differentiation of vegetative cells into nondividing heterocysts (Fig. 5 b–d).
In this example, growth needs to be considered along only one dimension, because Anabaena is a filamentous organism. This means that only a single (scalar) regional growth parameter, the local growth rate in length, needs to be considered. However, for growth in two or three dimensions, all components of the growth tensor need to be accounted for, covering the four types of regional parameter: growth rate, anisotropy, direction, and rotation. In trying to relate these parameters to gene activity, it is helpful to consider how they might be specified at the cellular level.
Specifying Growth Rate, Anisotropy, and Direction
Two of the regional parameters, growth rate and anisotropy, could in principle be specified by local levels of gene activity within a cell. For growth rate, the level of gene activity could influence chemical processes in a cell that lead to a change in cell size. This growth may be coupled to cell division so that average cell size is maintained over time, or it may occur without division, leading to larger cells. In the case of anisotropy, if a cell has defined main axes, based for example on its cytoskeleton, then levels of gene activity might influence the relative rate of growth along these different axes.
This begs the question of how the main axes, and hence the principal directions of growth of a cell, might be specified and coordinated within a tissue. One mechanism would be for cells to align their main axes along morphogen gradients. The gradients could arise through gene activity in particular regions leading to the production of signaling molecules that diffuse and decay or flow away to sinks. A problem with this model is that for a gradient operating over many cells, the differences in concentration across individual cells might be very small. One way of resolving this problem would be for small concentration differences across a cell to be amplified by intracellular mechanisms (46). However, this would have a tendency to introduce errors through amplification and fixation of random fluctuations.
An alternative to long-range gradients is to have a relay mechanism whereby signaling molecules act locally on neighboring cells, which in turn produce further signals. Although this mechanism can align nearby cells, directions may tend to drift over a longer range (47). Thus, although such a mechanism may contribute to local coordination of direction, other mechanisms may still be needed to coordinate direction over greater distances (48).
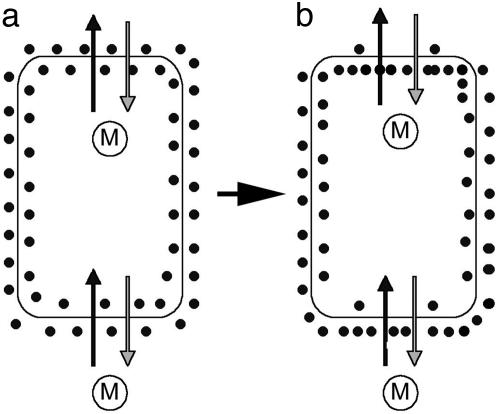
A further possibility would be for cells to measure the direction of morphogen flow rather than the gradient in concentration (49, 50). However, it has been unclear how, in principle, a cell might measure direction of flow. One suggestion is that the morphogen releases a chemical fragment before passing through a channel between two cells and then binds the fragment on emerging from the channel (51). This is a specific example of a general solution, which is to couple morphogen movement across cell membranes to the transport, synthesis, or release of a specific molecule (Fig. 6). Because, on average, more morphogen will pass in one direction than the other over time, the coupled molecule would effectively keep a tally of net morphogen flow. If the tally molecule were localized at the membrane, its concentration would be raised or lowered on one side according to whether the morphogen flows into or out of the cell. In the example illustrated in Fig. 6, the concentration of tally molecule on the inner side of the cell membrane is raised at the top of the cell, where morphogen is flowing out, and lowered at the base of the cell, where morphogen is flowing in. This process allows a difference in tally molecule concentration to be built up across the inside of the cell, which could then be used to orient the cell axis. The mechanism effectively amplifies the initial gradient by integrating morphogen flow over time, in contrast to other amplification mechanisms that amplify the gradient present at a particular time.
Fig. 6.
Model for coupling cell polarity to direction of morphogen flow. Morphogen molecules M diffuse (or are transported) in and out of the cell, whereas tally molecules (black dots) are localized at the cell membrane. The gradient of M is such that there is a net flow from the bottom of the cell to the top (vertical black arrows). M also crosses the membrane in the opposite way, but to a slightly lesser extent (gray arrows). Passage of M across the cell membrane is coupled to the movement (or synthesis/degradation or release/capture) of a tally molecule so that the tally molecule is transported across the membrane in the opposite direction to M. (a) Initially there is an equal concentration of tally molecules on each side of the membrane. (b) With time, the internal concentration of tally molecules increases at the top and decreases at the bottom of the cell until equilibrium is reached. The distribution of tally molecules would change gradually when the gradient of M changes orientation, leading to a change in cell polarity.
Whatever the detailed mechanism for aligning cell axes with gradients, these considerations indicate that morphogens play two distinct roles in the generation of shape. The first is a regionalizing role, involved in elaborating differences between regions, such as levels of gene activity, growth rate, or anisotropy. The second is a polarizing role, involved in specifying directions of cell axes. Morphogens with a regionalizing role often act by influencing transcription factors, which in turn can affect parameters such as growth rate and anisotropy. Cells respond only to the overall concentration of these morphogens, not to the direction of their gradient. Morphogens with a polarizing role, on the other hand, influence the orientation of cell axes and can hence determine the principal directions of growth. Cells respond to the highest slope of the morphogen gradient or to the direction of morphogen flow. Such responses are unlikely to be mediated by transcription factors, as the directional information would be lost through conversion to a gene expression level.
In principle, regionalizing and polarizing roles could reflect the action of a single type of molecule. However, this would place great constraints on the range of growth patterns, because different types of parameter (e.g., growth rate and direction) would be correlated. It is therefore more likely that these roles often involve distinct types of molecule, which may be conveniently referred to as regionalizing morphogens and polarizing morphogens.
Signaling molecules that specify directions (i.e., polarizing morphogens) have been invoked in studies on the polarity and movement of cells (46, 50, 53, 54). For instance, the genes controlling bristle orientation on a fly wing are thought to act by influencing responses to underlying polarizing morphogens (48). It is possible that the polarizing morphogens that influence cell polarity and movement are related to the polarizing morphogens that influence growth. The bristles on a fly wing, for example, tend to be oriented along the main direction of wing growth, raising the possibility that a common polarizing morphogen underlies the orientation of both bristles and growth. In support of this, some of the genes implicated in establishing bristle orientation, such as four-jointed, also have effects on proximodistal growth (54).
Growth Integration
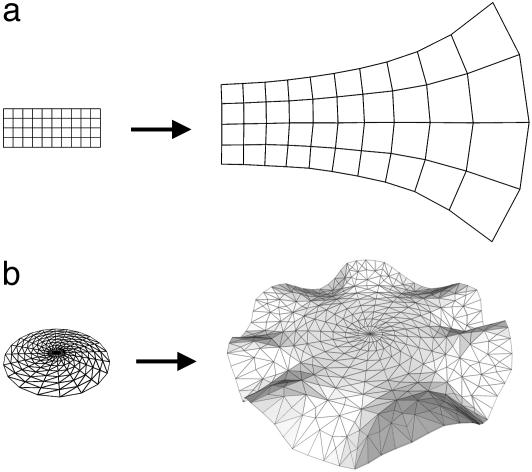
If all regions in a structure grow with the same growth rate, anisotropies, and directions, then it is relatively straightforward to calculate the changes in overall shape as the structure develops. For example, if each region extends in a similar way along a given direction, this will result in the structure as a whole undergoing a stretch in that direction. However, for many biological structures, growth is not uniform throughout, so regions are forced to rotate relative to each other as they are displaced. For example, consider a rectangle in which growth is locally isotropic but the rate of growth increases from one end to the other (Fig. 7a). As growth proceeds, the regions at the faster-growing end will start to rotate relative to each other, and the initially parallel lines will diverge because of the way neighboring regions displace each other. In this case, the regions rotate within the plane of the figure, but it is also possible for regions to rotate out of the plane. For example, if a disk grows isotropically with a higher rate or for a longer period at the periphery than in the center, it will bend out of the plane to form a wavy edge (Fig. 7b).
Fig. 7.
(a) Rectangle with isotropic growth rate increasing exponentially from left to right gives a curved final shape. (b) Flat disk with isotropic growth rate greater at the margins than at the center results in bending out of the plane and a wavy edge.
According to this view, the effect of genes on rotation stems from the way growing regions are connected to each other rather than being a property that is directly specified for each region. For example, leaves of Antirrhinum normally grow as approximately planar structures. However, in cincinnata (cin) mutants, leaves show extensive rippling at the edges, reflecting greater growth at the margins (55). This effect on curvature results from a delay in growth arrest at the margins of the leaf. Thus, the CIN gene influences rotation rate by affecting relative growth, which leads to bending because of the way regions are interconnected.
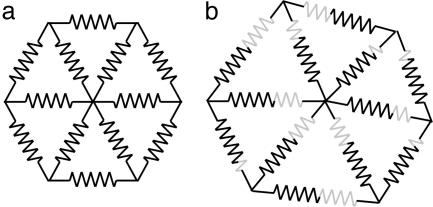
To understand the generation of shape, it is therefore essential to take account of rotations that result from regional interconnections. One way of incorporating this into modeling frameworks is to assign elastic properties to components of the structure so that regions can adjust to each other during growth (56). Such mutual adjustment allows all four types of regional parameter (growth rate, anisotropy, direction, and rotation) to be integrated within a single model. In the simplest case, points in the structure can be interconnected with springs (41, 57). Growth occurs by changing the resting lengths of the springs according to the specified growth rates, anisotropies, and directions. Increasing the resting length of a spring is equivalent to inserting an extra length of spring material into it (Fig. 8). Rotation rate can then be computed by finding the equilibrium where the energy stored in the springs is minimized (i.e., the forces balance). An alternative to springs is to treat the regions themselves as comprising elastic material by using 2D or 3D finite elements (58). In this case, growth is implemented by changing the resting shape and size of the elements.
Fig. 8.
Modeling growth with springs. Growth of each region shown in a is implemented by changing the resting lengths of the springs and letting them equilibrate (b), which is equivalent to inserting extra lengths of material (gray segments in b) into the springs.
To capture the effects of genes on growth, continuous or discrete regional models can be incorporated within interconnected frameworks, allowing the growth properties of each region in the framework to be influenced by gene action. As described in previous sections, growth rate and anisotropy can be specified through local interactions involving regionalizing morphogens. Directions can be specified through responses to polarizing morphogens. Rotation rates then emerge from the way interconnected regions grow in relation to each other. The resulting changes in shape and size will in turn modify the local interactions. This provides a general approach for modeling shape change as a two-way interaction between patterning and growth.
Modeling growth in this way may lead to stresses accumulating in a structure as it grows. For example, consider a sphere in which growth is locally isotropic but for which the rate of growth at the core of the sphere is greater than in the outer layer. This sphere would be modeled by increasing the resting lengths of elements in the core to a greater extent than elements near the surface. However, because the regions are interconnected, the inner and outer elements would constrain each other. The inner elements would be under compression and not attain their resting lengths, whereas the outer elements would be under tension and exceed their resting lengths (the magnitude of the forces would depend on element stiffness). Equilibrium would be reached when these compressive and tensile forces balance. The extent to which such stresses develop would depend on the geometry of the structure and the growth parameters that are applied.
It is possible that stresses that arise within a growing organism could themselves influence growth by feedback. For example, if a region is under tension or compression, this might be sensed, say by mechanoreceptors, leading to modified growth of the region (59). This could be modeled by adjusting the resting lengths of the elements according to the stresses that accumulate. Such feedback mechanisms may be an important way of adjusting growth, ensuring that excessive stresses do not build up.
A Case Study: Genes and Petal Shape
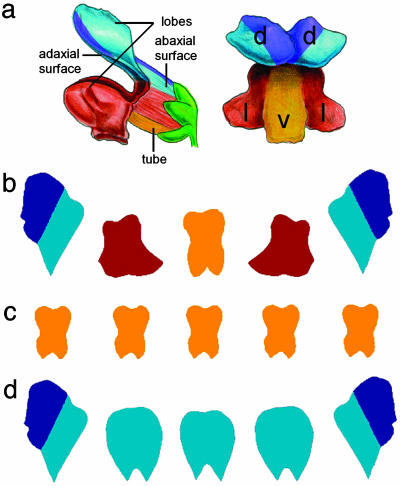
These issues will be illustrated further with the generation of petal shape in Antirrhinum (snapdragon). Antirrhinum flowers have five petals, which are united in their proximal regions to form a tube, whereas their distal regions form five distinct lobes (Fig. 9a). The flower is asymmetric along its dorsoventral axis, having two dorsal petals, two lateral petals, and one ventral petal. The dorsal and lateral petals are asymmetric, whereas the ventral petal is bilaterally symmetric, which is more readily seen when the petal lobes are removed and flattened (Fig. 9b).
Fig. 9.
(a) Antirrhinum flower shown in side view (Left) or face view (Right). Regions are color coded as blue (dorsal), brown (lateral), and yellow (ventral). The dorsal half of the dorsal petal is shown in darker blue [reproduced with permission from ref. 60 (Copyright 2003, Nature Publishing Group, www.nature.com).] (b–d) Flattened petal lobes of wild-type (b), cyc dich double mutant (c), and mutant expressing CYC ectopically (d).
The asymmetry of petals and of the flower as a whole depends on the activity of the CYCLOIDEA (CYC) and DICHOTOMA (DICH) genes (61–63). In cyc dich double mutants, all petals resemble ventral petals (Fig. 9c). Conversely, mutants that express CYC ectopically have petals with dorsal identity in all positions (Fig. 9d). CYC and DICH encode proteins belonging to the TCP family of transcription factors and are both expressed in dorsal regions of the flower from an early stage of development. CYC is expressed throughout the dorsal domain, whereas DICH is restricted to the dorsal half of each dorsal petal (dark blue region in Fig. 9). How does regional activity of these transcription factors influence petal shape?
To begin to address this question, parameters underlying growth of the dorsal petal lobe were determined through clonal analysis (60), which involves genetically marking dividing cells followed by identification of their mitotic descendants (64). Some growth parameters can be inferred by analysis of the resulting clone patterns. For example, clones induced at various times in developing leaves or Drosophila wings have provided estimates of the distribution and rates of cell division (65–71).
Although less direct than tracking for monitoring growth, the advantage of clonal analysis is that information can be extracted when the structure is at an easily accessible stage (often the mature organ). However, the approach does not permit rotations and hence overall shape changes to be calculated directly. This limitation can be overcome by incorporating clonal analysis data within a spring model (60). This allows changes in shape and associated rotations to be computed for a sequence of developmental stages (Fig. 10).
Fig. 10.
Shape changes in petal lobe from early to late stages. Lines show main directions of growth for each region at each stage when anisotropy was >1.05 per cell division. Petals have been scaled to the same size and aligned such that the average direction of growth is vertical. The scaling factor in area between P32 and P46 is 105.
Comparisons among simulations using observed and simplified parameters show that the major determinant of petal lobe asymmetry is the overall direction of anisotropic growth, rather than heterogeneities in growth rates within the petal lobe. The amount of anisotropy determines the extent to which the petal elongates, whereas the main direction of growth determines petal asymmetry.
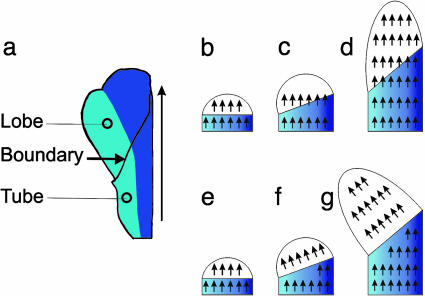
As the flower grows, the base of the petal lobe gradually turns through an angle of ≈45° relative to the proximodistal axis of the flower. The rotation reflects greater growth on the most dorsal side of the tube (Fig. 11 b–d). Despite this rotation, growth direction in the petal lobe is maintained roughly parallel to the proximodistal axis throughout development, suggesting that a polarizing morphogen (arrows in Fig. 11 b–d) acts continuously during development to maintain growth direction along the proximodistal axis of the petal as a whole. If growth directions were fixed at an early stage, they would rotate with the lobe, which, therefore, would not become asymmetric (Fig. 11 e–g).
Fig. 11.
(a) Flattened dorsal petal color coded as in Fig. 9 showing boundary between tube and lobe. Vertical arrow indicates the proximodistal axis. (b–d) Change in shape when growth direction is continuously coordinated along the whole petal (arrows arbitrarily shown pointing up rather than down). Lobe is white and tube is blue, with dorsal regions darker blue. Initially, the lobe is bilaterally symmetrical (b). Dorsal side of the tube grows preferentially, resulting in a change in the orientation of the tube-lobe boundary (c). As growth direction is maintained parallel to the proximodistal axis, anisotropic growth results in the lobe becoming asymmetric (d). (e and f) Change in shape if the direction of growth becomes fixed at an early stage. Initially (e), growth direction is vertical as in b, but, as the tube-lobe boundary changes orientation, the direction of growth within the lobe rotates together with the lobe (f), leading to a bilaterally symmetrical lobe (g).
To see whether this hypothesis could account for what is observed, a growth model for the developing dorsal petal was constructed by using 2D finite elements (our unpublished work). The model starts with several regional identities, which can act in a combinatorial fashion where they overlap (Fig. 12). These identities provide distinctions along different petal axes: a tube and lobe region along the proximodistal axis, a dorsal and lateral half along the dorsoventral axis, and three regions along the mediolateral axis (Fig. 12 a–c). Finally, the base of the tube is defined as a source of a polarizing morphogen, for which the distal edge of the lobe is a sink: this forms a gradient along the proximodistal axis (Fig. 12d). The various regional identities proposed in Fig. 12 a–d can be considered as having arisen through responses to regionalizing morphogens.
Fig. 12.
Wild-type dorsal petal at an early stage of development with regional identities distinguished along different axes. (a) The petal is divided along the proximodistal axis into a tube (pale-pink) and lobe (dark-pink) region. (b) The petal is divided along the dorsoventral axis of the flower into a more dorsal (dark-blue) and lateral (light-blue) half. (c) The petal is divided along its mediolateral axis into middle (light-green), intermediate (mediumgreen), and side (dark-green) regions. (d) A region is defined at the base of the petal (bright yellow) that provides a source of polarizing morphogen that diffuses (arrows) toward a distal sink (brown). (e) Subdivision of petal into finite elements.
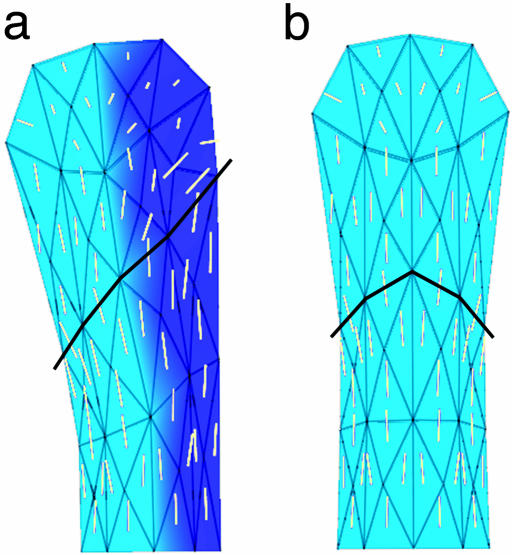
As a first approximation to normal petal development, growth parameters can be set in the following way. The main direction of growth is set by the gradient of polarizing morphogen, which acts continuously during petal growth. This alignment tends to orient growth along the proximodistal axis. Growth rate is enhanced in the lobe (dark pink), in the middle of the tube (light green and pale pink), and in the dorsal side of the tube (dark blue, dark green, and pale pink). Anisotropy is enhanced in the tube (pale pink). In addition, the base and dorsal edge of the tube are kept horizontal and vertical, respectively, because they are constrained through connections to other parts of the flower. Finally, to minimize rotation of the sink relative to the source, the sink is rendered inactive at the lateral edge of the lobe (brown, dark green, and pale blue).
A simulation based on these assumptions gives a reasonable match to the observed shape (Fig. 13a). This does not prove that all features of the model are correct, because other assumptions may also be compatible with the observations, but shows that the model provides one plausible explanation for the recorded growth patterns. The model can also be used to simulate growth of a mutant, backpetals, in which CYC is expressed ectopically (62). This mutant gives some petals that resemble mirror image duplications of the lateral half of a dorsal petal (Fig. 9d). In the model, this mutant should correspond to removing the distinction between the dorsal (dark-blue) and lateral (light-blue) halves of the petal, such that both have a more lateral (light-blue) identity. The petal shape predicted by this is a reasonable match to the observed dorsalized petals in the ectopic mutant (Fig. 13b).
Fig. 13.
Final petal shapes resulting from growth models operating on the starting shape shown in Fig. 12. Only distinctions along the dorsoventral axis are color-coded. Tube-lobe boundary is highlighted in black, and the main directions of growth is indicated with short pale-yellow lines. (a) Model of wild-type dorsal petal with direction determined by a polarizing morphogen acting continuously during growth. (b) Same as a except that dark blue has been removed, capturing the development of the backpetal mutant.
A general point to emerge from this analysis is that shape changes during growth can arise from the interplay among three components: regionalizing morphogens, regional identities, and polarizing morphogens. By incorporating these within an interconnected framework of regions, it is possible to generate shape changes according to particular hypotheses. The results can be compared to observed parameters and shapes. The hypotheses can also be further examined by seeing how well they account for mutants.
The combination of modeling, genetics, and growth analysis described here begs many questions, such as the nature of the morphogens, the targets they affect, as well as what causes regional shapes to change or stop changing. Nevertheless, we believe the approach provides a useful quantitative and testable framework for beginning to assess the interplay between gene action and shape.
Acknowledgments
We thank James Sharpe, Nick Brown, and Dorota Kwiatkowska for thoughtful comments on the manuscript. This research was supported in part by grants from the Human Frontier Science Program (to E.C. and P.P.) and the Natural Sciences and Engineering Research Council of Canada Discovery (to P.P.).
This contribution is part of the special series of Inaugural Articles by members of the National Academy of Sciences elected on May 1, 2001.
See accompanying Biography on page 4725.
References
- 1.Lawrence, P. A. (1992) The Making of a Fly (Blackwell Scientific, Oxford).
- 2.Wolpert, L., Brockes, J., Jessell, T., Lawrence, P. & Meyerowitz, E. (1998) Principles of Development (Oxford Univ. Press, Oxford).
- 3.Coen, E. (2000) The Art of Genes (Oxford Univ. Press, Oxford).
- 4.Teleman, A., Strigini, M. & Cohen, S. M. (2001) Cell 105, 559–562. [DOI] [PubMed] [Google Scholar]
- 5.Steeves, T. A. & Sussex, I. M. (1989) Patterns in Plant Development (Cambridge Univ. Press, Cambridge, U.K.).
- 6.Bretschneider, T., Vasiev, B. & Weijer, C. J. (1999) J. Theor. Biol. (1999) 199, 125–136. [DOI] [PubMed] [Google Scholar]
- 7.Hogan, B. L. & Kolodziej, P. A. (2002) Nat. Rev. Genet. 3, 513–523. [DOI] [PubMed] [Google Scholar]
- 8.Avery, G. S. (1933) Am. J. Bot. 20, 565–592. [Google Scholar]
- 9.Richards, O. W. & Kavanagh, A. J. (1943) Am. Nat. 77, 385–399. [Google Scholar]
- 10.Erickson, R. O. (1966) J. Exp. Bot. 17, 390–403. [Google Scholar]
- 11.Erickson, R. O. (1976) Annu. Rev. Plant Physiol. 27, 407–434. [Google Scholar]
- 12.Wolf, S. D., Silk, W. K. & Plant, R. E. (1986) Am. J. Bot. 73, 832–846. [Google Scholar]
- 13.Granier, C. & Tardieu, F. (1999) Plant Physiol. 119, 609–619. [DOI] [PMC free article] [PubMed] [Google Scholar]
- 14.Williams, M. H. & Green, P. B. (1988) Protoplasma 147, 77–79. [Google Scholar]
- 15.Hernandez, F., Havelange, A., Bernier, G. & Green, P. B. (1991) Planta 185, 139–147. [DOI] [PubMed] [Google Scholar]
- 16.Dumais, J. & Kwiatkowska, D. (2002) Plant J. 31, 229–241. [DOI] [PubMed] [Google Scholar]
- 17.Elul, T., Koehl, M. A. R. & Keller, R. (1997) Dev. Biol. 191, 243–258. [DOI] [PubMed] [Google Scholar]
- 18.Richards, O. W. & Kavanagh, A. J. (1945) in Essays on Growth and Form, eds. Le Gros Clark, W. E. & Medawar, P. B. (Oxford Univ. Press, Oxford), pp. 188–230.
- 19.Silk, W. K. & Erickson, R. O. (1979) J. Theor. Biol. 76, 481–501. [DOI] [PubMed] [Google Scholar]
- 20.Hejnowicz, Z. (1982) J. Theor. Biol. 96, 161–173. [Google Scholar]
- 21.Hejnowicz, Z. & Romberger, J. A. (1984) J. Theor. Biol. 110, 93–114. [Google Scholar]
- 22.Goodall, C. R. & Green, P. B. (1986) Bot. Gaz. 147, 1–15. [Google Scholar]
- 23.Vargesson, N., Clarke, J. D. W., Vincent, K., Coles, C., Wolpert, L. & Tickle, C. (1997) Development (Cambridge, U.K.) 124, 1909–1918. [DOI] [PubMed] [Google Scholar]
- 24.Mercader, N., Leonardo, E., Piedra M. E., Martinez-A, C., Ros, M. A. & Torres, M. (2000) Development (Cambridge, U.K.) 127, 3961–3970. [DOI] [PubMed] [Google Scholar]
- 25.Tax, F. E. & Thomas, J. H. (1994) Curr. Biol. 4, 914–916. [DOI] [PubMed] [Google Scholar]
- 26.Turing, A. M. (1952) Philos. Trans. R. Soc. London B 237, 37–72. [Google Scholar]
- 27.Meinhardt, H. (1982) Models of Biological Pattern Formation (Academic, London).
- 28.Meinhardt, H. (1995) The Algorithmic Beauty of Sea Shells (Springer, Berlin).
- 29.Murray, J. D. (2002) Mathematical Biology (Springer, Berlin), 3rd Ed.
- 30.Reinitz, J. & Sharp, D. H. (1995) Mech. Dev. 49, 133–158. [DOI] [PubMed] [Google Scholar]
- 31.von Dassow, G., Meir, E., Munro, E. M. & Odell, G. M. (2000) Nature 406, 188–192. [DOI] [PubMed] [Google Scholar]
- 32.Meir, E., von Dassow, G., Munro, E. & Odell, G. M. (2002) Curr. Biol. 12, 778–786. [DOI] [PubMed] [Google Scholar]
- 33.Kulesa, P. M., Cruywagen, G. C., Lubkin, S. R., Maini, P. K., Sneyd, J., Ferguson, M. W. J. & Murray, J. D. (1996) J. Theor. Biol. 180, 287–296. [Google Scholar]
- 34.Painter, K. J, Maini, P. K. & Othmer, H. G. (1999) Proc. Natl. Acad. Sci. USA 96, 5549–5554. [DOI] [PMC free article] [PubMed] [Google Scholar]
- 35.Crampin, E. J., Gaffney, E. A. & Maini, P. K. (2002) J. Math. Biol. 44, 107–128. [DOI] [PubMed] [Google Scholar]
- 36.Madzvamuse, A., Thomas, R. D., Maini, P. K. & Wathen, A. J. (2002) Bull. Math. Biol. 64, 501–530. [DOI] [PubMed] [Google Scholar]
- 37.von Neumann, J. (1966) Theory of Self-Reproducing Automata (Univ. of Illinois Press, Urbana, IL).
- 38.Ermentrout, G. B. & Edelstein-Keshet, L. (1993) J. Theor. Biol. 160, 97–133. [DOI] [PubMed] [Google Scholar]
- 39.Wolfram, S. (2002) A New Kind of Science (Wolfram Media, Champaign, IL).
- 40.Lindenmayer, A. (1968) J. Theor. Biol. 18, 280–315. [DOI] [PubMed] [Google Scholar]
- 41.Prusinkiewicz, P. & Lindenmayer, A. (1990) The Algorithmic Beauty of Plants (Springer, New York).
- 42.Adams, D. G. (2000) Curr. Opin. Microbiol. 3, 618–624. [DOI] [PubMed] [Google Scholar]
- 43.Baker, R. & Herman, G. T. (1972) Int. J. Biomed. Comput. 3, 201–215, 251–267.51.5043365 [Google Scholar]
- 44.de Koster, C. G. & Lindenmayer, A. (1987) Acta Biotheor. 36, 249–273. [Google Scholar]
- 45.Hammel, M. & Prusinkiewicz, P. (1996) Proc. Graphics Interface 96, pp. 246–258. [Google Scholar]
- 46.Weiner, O. D. (2002) Curr. Opin. Cell Biol. 14, 196–202. [DOI] [PMC free article] [PubMed] [Google Scholar]
- 47.Ma, D., Yang, C.-h., McNeill, H., Simon, M. A. & Axelrod, J. D. (2003) Nature 421, 543–546. [DOI] [PubMed] [Google Scholar]
- 48.Tree, D. R. P., Ma, D. & Axelrod, J. D. (2002) Semin. Cell Dev. Biol. 13, 217–224. [DOI] [PubMed] [Google Scholar]
- 49.Swarup, R., Marchant, A. & Bennett, M. J. (2000) Biochem. Soc. Trans. 28, 481–448. [PubMed] [Google Scholar]
- 50.Sachs, T. (1991) Pattern Formation in Plant Tissues, eds. Barlow, P. W., Bray, D., Green, P. B. & Slack, J. M. W. (Cambridge Univ. Press, Cambridge, U.K.).
- 51.Mitchison, G. J. (1980) Proc. R. Soc. London Ser. B 207, 79–109. [Google Scholar]
- 52.Adler, P. N. (2002) Dev. Cell 2, 525–535. [DOI] [PubMed] [Google Scholar]
- 53.Wallingford, J. B., Fraser, S. E. & Harland, R. M. (2002) Dev. Cell 2, 695–706. [DOI] [PubMed] [Google Scholar]
- 54.Tokunaga, C. & Gerhart, J. C. (1976) J. Exp. Zool. 198, 79–96. [DOI] [PubMed] [Google Scholar]
- 55.Nath, U, Crawford, B. C. Carpenter, R. & Coen, E. (2003) Science 299, 1404–1407. [DOI] [PubMed] [Google Scholar]
- 56.Green, P. B. (1996) Ann. Bot. 78, 269–281. [DOI] [PubMed] [Google Scholar]
- 57.de Boer, M. J. M., Fracchia, F. D. & Prusinkiewicz, P. (1992) in Lindenmayer Systems, Impacts on Theoretical Computer Science, Computer Graphics, and Developmental Biology, eds. Rozenberg, G. & Salomaa, A. (Springer, Berlin), pp. 351–370.
- 58.Taber, L. A. (1995) Appl. Mech. Rev. 48, 487–545. [Google Scholar]
- 59.Lynch, T. M. & Lintilhac, P. M. (1997) Dev. Biol. 181, 246–256. [DOI] [PubMed] [Google Scholar]
- 60.Rolland-Lagan, A.-G., Bangham J. A. & Coen, E. (2003) Nature 422, 161–163. [DOI] [PubMed] [Google Scholar]
- 61.Luo, D., Carpenter, R., Vincent, C., Copsey, L. & Coen, E. (1996) Nature 383, 794–799. [DOI] [PubMed] [Google Scholar]
- 62.Luo, D., Carpenter, R., Copsey, L., Vincent, C., Clark, J. & Coen, E. (1999) Cell 99, 367–376. [DOI] [PubMed] [Google Scholar]
- 63.Galego, L. & Almeida, J. (2002) Genes Dev. 16, 880–891. [DOI] [PMC free article] [PubMed] [Google Scholar]
- 64.Subtelny, S. & Sussex, I. M., eds. (1978) The Clonal Basis of Development (Academic, New York).
- 65.Poethig, R. S. & Sussex, I. M. (1985) Planta 165, 170–184. [DOI] [PubMed] [Google Scholar]
- 66.Poethig, R. S. & Szymkowiak, R. J. (1995) Maydica 40, 67–76. [Google Scholar]
- 67.Poethig, R. S. (1987) Am. J. Bot. 74, 581–594. [Google Scholar]
- 68.Dolan, L. & Poethig, R. S. (1998) Am. J. Bot. 85, 315–321. [PubMed] [Google Scholar]
- 69.Garcia-Bellido, A. & Merriam, J. R. (1971) Dev. Biol. 24, 61–87. [DOI] [PubMed] [Google Scholar]
- 70.Gonzalez-Gaitan, M., Capdevila, M. P. & Garcia-Bellido, A. (1994) Mech. Dev. 40, 183–200. [DOI] [PubMed] [Google Scholar]
- 71.Resino, J., Salama-Cohen, P. & Garcia-Bellido, A. (2002) Proc. Natl. Acad. Sci. USA 99, 7502–7507. [DOI] [PMC free article] [PubMed] [Google Scholar]


