Background: Cannabinoids induce potent myeloid-derived suppressor cells (MDSCs) in vivo.
Results: Functional MDSCs induced by THC show distinct miRNA expression patterns.
Conclusion: Specific miRNA may play important roles in MDSC development and function by regulating target genes involved in myeloid cell differentiation.
Significance: Select miRNA could be important molecular targets to manipulate MDSC activity in cancer and inflammatory diseases.
Keywords: Cannabinoids, Cell Differentiation, Immunosuppression, MicroRNA, Myeloid Cell, MDSC, Myeloid-derived Suppressor Cell
Abstract
Δ9-Tetrahydrocannabinol (THC), the major bioactive component of marijuana, has been shown to induce functional myeloid-derived suppressor cells (MDSCs) in vivo. Here, we studied the involvement of microRNA (miRNA) in this process. CD11b+Gr-1+ MDSCs were purified from peritoneal exudates of mice administered with THC and used for genome-wide miRNA profiling. Expression of CD31 and Ki-67 confirmed that the THC-MDSCs were immature and proliferating. THC-induced MDSCs exhibited distinct miRNA expression signature relative to various myeloid cells and BM precursors. We identified 13 differentially expressed (>2-fold) miRNA in THC-MDSCs relative to control BM precursors. In silico target prediction for these miRNA and pathway analysis using multiple bioinformatics tools revealed significant overrepresentation of Gene Ontology clusters within hematopoiesis, myeloid cell differentiation, and regulation categories. Insulin-like growth factor 1 signaling involved in cell growth and proliferation, and myeloid differentiation pathways were among the most significantly enriched canonical pathways. Among the differentially expressed, miRNA-690 was highly overexpressed in THC-MDSCs (∼16-fold). Transcription factor CCAAT/enhancer-binding protein α (C/EBPα) was identified as a potential functional target of miR-690. Supporting this, C/EBPα expression was attenuated in THC-MDSCs as compared with BM precursors and exhibited an inverse relation with miR-690. miR-690 knockdown using peptide nucleic acid-antagomiR was able to unblock and significantly increase C/EBPα expression establishing the functional link. Further, CD11b+Ly6G+Ly6C+ and CD11b+Ly6G−Ly6C+ purified subtypes showed high levels of miR-690 with attenuated C/EBPα expression. Moreover, EL-4 tumor-elicited MDSCs showed increased miR-690 expression. In conclusion, miRNA are significantly altered during the generation of functional MDSC from BM. Select miRNA such as miR-690 targeting genes involved in myeloid expansion and differentiation likely play crucial roles in this process and therefore in cannabinoid-induced immunosuppression.
Introduction
Mature microRNA (miRNA)2 are a class of small (19–25 nucleotides), single-stranded, noncoding RNAs that play a crucial role in gene regulation. miRNA act as adaptors that guide RNA-induced gene silencing complex to target mRNAs by complementary base pairing, primarily within the 3′-UTR, which results in target gene silencing either by inhibition of translation or degradation of the mRNA, or both (1, 2). Although effective and functional target interaction does not require perfect complementarity between miRNA and mRNA sequences, a nearly perfect base pairing of a 7-nucleotide “seed sequence” at the 5′ end (positions 2–8) of miRNA appears to be one of the key determinants of target recognition (2, 3). Most mammalian mRNAs are believed to be conserved targets of miRNA (4). The pattern of miRNA expression is organ- and cell type-specific, and significant changes in their expression are associated with processes such as cancer, inflammation, and infectious diseases in mice and humans (1, 5).
miRNA regulate several aspects of the immune system. They influence various innate and acquired immunological processes (6–8). Significant changes in miRNA expression have been observed during cell development and differentiation (8–10). Genome-wide analysis of miRNA expression has been performed for various immune cell types such as mouse lymphocyte subsets (11) and human B and T lymphocytes (5, 9, 11). Moreover, unique miRNA expression profiles are known to be associated with immune cells or their differentiation states (10, 12).
Myeloid-derived suppressor cells (MDSCs) are defined by their myeloid origin, immature state, and potent T cell-suppressive function. In mice, MDSC population are commonly identified by CD11b+ and Gr-1+ expression and T cell-suppressive activity (13–15). MDSCs are believed to regulate immune responses in normal state as well as during inflammation, infection, and cancer (15–18). MDSCs can potently suppress cytotoxic activities of natural killer (NK) and NKT cells, as well as the adaptive immune response mediated by CD4+/CD8+ T cells. MDSCs use multiple pathways to dampen T cell activity including production of arginase 1 and up-regulation of nitric-oxide synthase 2. Arginase 1 and nitric-oxide synthase 2 metabolize l-arginine needed for T cells and thereby block translation of the T cell CD3 zeta chain, inhibit T cell proliferation, and promote T cell apoptosis. In addition, MDSCs can also secrete immunosuppressive cytokines and induce regulatory T cell development in certain cases.
MDSCs are induced rapidly in various pathological conditions mainly infections, inflammatory diseases, and cancer. They accumulate in the blood, bone marrow, and secondary lymphoid organs of tumor-bearing mice and play an important role in causing immune suppression and tumor evasion. Although it is evident that MDSCs may serve as potential therapeutic targets to promote anti-tumor immune responses or to inhibit inflammatory responses such as in the case of autoimmune disease or during transplant rejection, further characterization is necessary with respect to molecular markers and pathways to determine how functional MDSCs develop and accumulate.
Our recent studies have explored the mechanism of immune regulation by several natural compounds such as cannabinoids and resveratrol involving induction of MDSCs (19–23). We made an exciting observation that activation of cannabinoid receptors by immunosuppressive, natural cannabinoids from marijuana such as THC lead to robust induction of functional MDSCs in mice (22). To understand the nature and origin of THC-induced functional MDSCs, in this study, we sought to explore the miRNA expression so as to identify cell type-specific miRNA pertaining to MDSCs and their target pathways. To this end, we performed a genome-wide analysis of miRNA expression by microarray-based profiling in highly immunosuppressive CD11b+Gr-1+ MDSCs induced by THC in vivo, relative to control CD11b+Gr-1+ precursor cells from naïve bone marrow, as well as various other myeloid cells from the periphery. We identified differentially expressed miRNA unique to functional MDSCs induced by THC. Further, highly predictive target genes and putative pathways were analyzed using the latest genomics and bioinformatics computational tools. One of the highest differentially expressed miRNA in functional MDSC, miR-690, was further explored with respect to regulation of target transcription factor and myeloid regulator C/EBPα.
EXPERIMENTAL PROCEDURES
Reagents
THC was provided by the National Institute on Drug Abuse, National Institutes of Health (Rockville, MD). THC was initially dissolved in Me2SO and diluted in sterile PBS for injections. The mAbs, FITC-conjugated anti-CD11b, phycoerythrin (PE)-conjugated anti-Gr-1 (clone RB6–8C5), PE anti-Ly6-G (clone IA-8), PE anti-CD11c, PE-Cy7 anti-Ly6-C (clone HK1.4), PE anti-F4/80, PE anti-Ki67, PE anti-CD31, and purified mouse Fc block (anti-CD16/CD32) were purchased from BioLegend. Anti-CD11b and anti-PE microbeads, magnetic sorting columns, and equipment were from Miltenyi Biotech. [3H]Thymidine was purchased from GE Healthcare. Mouse G-CSF and GM-CSF were from R&D Systems. Red blood cell lysis buffer and all other chemicals and reagents were from Sigma-Aldrich or Invitrogen.
Mice
Adult female C57BL/6 (WT) mice, 8–10 weeks of age, were procured from the National Cancer Institute, National Institutes of Health (Frederick, MD). The mice were maintained under typical pathogen-free conditions in the animal resource facility of the University of South Carolina School of Medicine. All experiments and procedures were authorized by the Institutional Animal Care and Use Committee.
Cells
The mice were injected with THC (25 mg/kg) intraperitoneally to induce MDSCs as described previously (22). After 16 h, infiltrating cells in the peritoneal cavity were harvested by performing lavage with sterile, ice-cold PBS (5 ml × 3). The cells were spun down and reconstituted in FACS buffer (PBS + 2% FBS) for immunostaining and flow cytometry. CD11b+Gr-1+ MDSCs were purified to ∼93% by FACS sorting (FACS AriaTM; Becton Dickinson). T cell-suppressive activity of THC-MDSC were confirmed by a standard T cell proliferation assay as described previously (22). CD11b+Ly6-G+Ly6C+ granulocytic and CD11b+Ly6-G−Ly6-C+ monocytic subsets were purified by FACS sorting to >96% purity. Various control myeloid cells were purified to >90% purity either by immunomagnetic separation (Miltenyi Biotech) or FACS sorting (19, 21–23). Briefly, naïve splenocytes were obtained from WT mice after preparing a single cell suspension of the spleen followed by RBC lysis. Bone marrow cells naïve WT mice were prepared by flushing tibia with ice-cold PBS followed by RBC lysis (22). Naïve spleen CD11b+Gr-1+ cells (control SPL-MDSC) and CD11b+Gr-1+ precursors from naïve BM (control BM MDSC precursors) were purified by immunolabeling and FACS sorting. Naïve spleen dendritic cells were sorted following labeling with anti-CD11c-PE antibody. Control spleen CD11b+Gr-1− macrophages were purified by a two-step magnetic bead isolation-positive selection with CD11b microbeads followed by negative selection using anti-Gr-1-PE antibody and anti-PE microbeads. CD11b+Gr-1+ tumor-induced MDSC were purified from spleens of BL/6 tumor-bearing mice on day 12 following inoculation with EL-4 tumor cells. All sorted cells were tested for purity (>90%) by flow cytometry before total RNA isolation.
Total RNA Extraction
Total RNA including small RNAs were extracted using QIAzol lysis reagent and a miRNeasy mini kit (Qiagen) according to the manufacturer's instructions. The concentration of RNA was determined using a spectrophotometer, and the RNA integrity was verified using Agilent 2100 BioAnalyzer (Agilent Tech, Palo Alto, CA). Total RNA from PNA-anti-miR transfection experiments were extracted using RNAqueous® phenol-free total RNA extraction kit (Ambion) as recommended.
miRNA Expression Profiling: Labeling and Hybridization
The Affymetrix GeneChip® miRNA 1.0 array platform described previously (24) was used for profiling miRNA expression as per the manufacturer's instructions. The array included oligonucleotide probe sets for 609 mouse miRNA from Sanger miRBase (v11) (25) with multiple probes for each mature miRNA sequence. Total RNA containing small RNA were labeled with biotin using FlashTag Biotin HSR RNA labeling kit (Genisphere, Hatfield, PA). Prelabeled spike control oligonucleotides were spiked in to the controls used for labeling and hybridization, as well as for data normalization purposes. The hybridization mixture contained premixed hybridization controls (bioB, bioC, bioD, and cre). Each labeled sample was hybridized to the array at 48 °C and 60 rpm for 16 h, then washed, and stained with fluorescent-conjugated streptavidin on a Fluidics Station. The stained chip was washed and scanned on GeneChip Scanner (Affymetrix) to generate the chip image and the data file. Total RNA isolated from three independent cell sorts for THC-induced MDSCs and control BM MDSC precursors and two independent cell sorts for control spleen MDSCs, control spleen macrophages, and control spleen dendritic cells were pooled before high throughput analysis. Each cell sort represents cells obtained and purified from three to five mice. These samples were analyzed separately in real time qPCR validation.
Data Handling
The microarray image data were analyzed using Affymetrix miRNA QC Tool software for data summarization, normalization, and quality control. Hybridization signals that that showed aberrant properties and were <3 standard deviations over the mean background value were excluded. Statistical significance (p values) for “detection calls” were determined by Affymetrix test. Probe sets with a p value lower than 0.05 were called present (true). The log-transformed fluorescence intensity values were mean-centered and visualized by heat maps. Comparisons were made between miRNA expression profile for THC-MDSC and control BM precursors and other control myeloid cells from naïve WT mice. The miRNA that showed >2-fold higher or lower values in THC-MDSC were considered as differentially expressed. Fold change heat maps, Venn diagrams, and scatter plots were further used for differential expression analysis and visualization.
Real Time qPCR
Several miRNA were validated by real time qPCR assays. Total RNA were reverse transcribed to obtain cDNA using miScript kit (Qiagen). For the detection of mature miRNA: mmu-miR-22, mmu-miR-20a, mmu-miR-15b, mmu-miR-335-5p, and control RNU_1A, qPCR was performed using miScript primer assays containing specific forward primer and a universal reverse primer and QuantiTect SYBR Green PCR master mix (Qiagen) using StepOne real time PCR thermal cycler (Applied Bio). For mmu-miR-690 and internal control U6, primer sets were obtained from Applied Biological Materials Inc. (Richmond, Canada). Relative quantification was calculated by 2(−ΔΔCq) method and expressed relative to endogenous controls RNU_1A or U6. Total RNA isolated from two or three independent cell sorts from three to five mice per sample obtained as mentioned above were analyzed separately in this assay to obtain standard deviation. Relative quantification values were compared using Student's t test. Real time qPCR primers for Cebpa and other target genes were synthesized from IDT DNA Technologies (Table 1).
TABLE 1.
Real time qPCR primers used in the study
| Gene | Primer | Sequence (5′ → 3′) |
|---|---|---|
| Cebpa | Cebpa-F | CAA GAA CAG CAA CGA GTA CCG |
| Cebpa-R | GTC ACT GGT CAA CTC CAG CAC | |
| Nedd4 | Nedd4-F | TCG GAG GAC GAG GTA TGG G |
| Nedd4-R | GGT ACG GAT CAG CAG TGA ACA | |
| Ptpn11 | Ptpn11-F | ATG ACA TCG CGG AGA TGG TTT |
| Ptpn11-R | GGG TTA CTC TTA CTG GGC CTT | |
| Runx1 | Runx1-F | GCA GGC AAC GAT GAA AAC TAC T |
| Runx1-R | GCA ACT TGT GGC GGA TTT GTA | |
| E2f1 | E2f1-F | CTC GAC TCC TCG CAG ATC G |
| E2f1-R | GAT CCA GCC TCC GTT TCA CC | |
| Rn18s | 18S-F | GCC CGA GCC GCC TGG ATA C |
| 18S-R | CCG GCG GGT CAT GGG AAT AAC |
Computational Analysis of miRNA Targets and Pathways: miRNA Target Prediction
We analyzed differentially expressed miRNA in THC-MDSC versus BM precursors in silico for their target genes. We used TargetScan, version 5.1 (2, 4), RNAhybrid (v2.1) (26), and miRanda (27) miRNA algorithms via miRWalk suite (28). We restricted our searches to minimum miRNA seed length of 7 nucleotides and binding sites on the 3′-UTR of target mRNA. Probability distribution of random matches was set at 0.05 (Poisson p value). Targets with p ≤ 0.05 and predicted by at least two of the three algorithms were identified as predicted targets. For experimentally supported targets curated from the literature, we used miRecords (29) and the latest version of TarBase 6.0 (30).
Pathway Analysis
Ingenuity pathway analysis (IPA) software (Ingenuity® Systems) was used to identify the molecular and functional annotations and canonical biological pathways potentially influenced by target genes of differentially expressed miRNA. Significant enrichment of target genes into functional annotation categories was determined and ranked based on (i) the ratio of the number of molecules from the data set that map to the annotation category divided by the total number of molecules associated with the category and (ii) the p value from the right-tailed Fisher's exact test representing the probability that the association between the genes in the data set and the annotation is due to chance alone. Similarly, pathway analysis was performed using IPA to identify the significantly enriched canonical pathways most relevant to the target gene data set from the IPA pathway library sourced from the Kyoto Encyclopedia of Genes and Genomes (31).
Gene Ontology Mapping
Gene Ontology (GO) enrichment analysis and mapping of miRNA target genes was performed using Cytoscape suite, an open source bioinformatics platform for analyzing and visualizing complex networks (32) equipped with ClueGo and CluePedia plugins (33).
PNA-miRNA Inhibitors
PNA anti-miRs against the mature form of mmu-miR-690 were synthesized by PNABio (Thousand Oaks, CA). A scrambled sequence PNA anti-miR was used as the negative control. In addition, we used a fluorescently conjugated (5-FAMTM, green fluorescence) negative control PNA to check transfection efficiency and optimize the transfection.
Transfection and Knockdown of miR-690
THC-induced MDSCs obtained from the peritoneum of mice were plated in DMEM without antibiotics and containing 10 ng/ml GM-CSF and 50 ng/ml G-CSF. PNA inhibitors were suspended in nuclease-free water and completely dissolved by heating to 60 °C for 5–10 min. PNA inhibitors contain a conjugated cell-penetrating peptide and can be used without a transfection regent; however, transfection reagent could be added to further facilitate cell penetration. For the primary MDSCs, we optimized and used a transfection mixture containing control or miR-690 PNA anti-miR to a final concentration of 0.5 μm with a low concentration of Lipofectamine 2000 (0.2 μl; 0.04% final concentration). Cells were supplemented with complete medium after 12 h and harvested after 24 h. Total RNA and protein were extracted for analysis.
Western Blotting
Protein extracts (∼20 μg) were separated by 10% polyacrylamide gel electrophoresis containing 0.1% SDS and transferred to nitrocellulose membrane. The membranes were probed with antibodies against C/EBPα or control β-actin (Santa Cruz Biotechnology). Blots were developed with HRP-conjugated secondary antibody and visualized using the ECL system (Pierce).
RESULTS
Functional CD11b+Gr-1+ MDSCs Exhibit Distinct miRNA Expression Profile
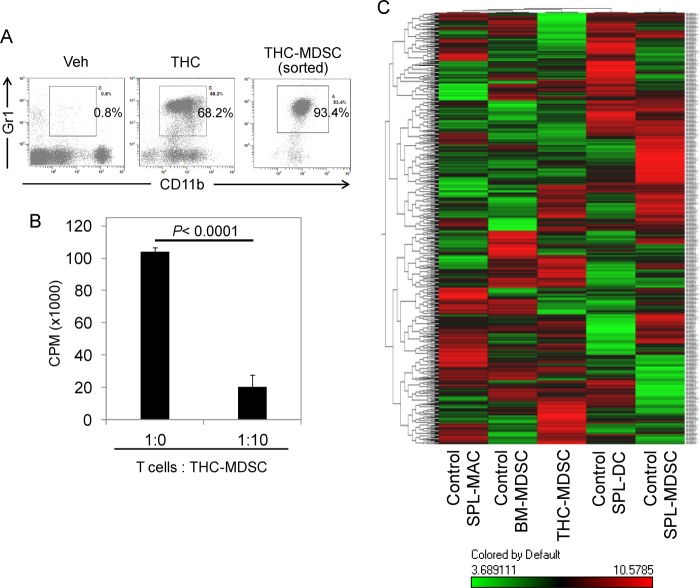
Although miRNA have been shown to play a critical role in the differentiation of myeloid cells, the global miRNA expression in MDSCs when compared with other myeloid populations, specifically to characterize cell type-specific miRNA, has not been performed. Administration of THC triggers massive induction of MDSCs (22). We therefore sought to determine and compare the miRNA expression of these MDSCs with other cells. We administered THC into C57BL/6 (WT) mice to obtain large numbers of CD11b+Gr-1+ cells (Fig. 1A) in the peritoneal cavity as reported previously (22). The cells were further enriched by sorting to ∼93% purity. We corroborated their immunosuppressive functions, by testing their ability to suppress T cell proliferation (Fig. 1B). To compare THC-induced MDSCs with other cell types, we used the following cells: normal CD11b+Gr-1+ cells (control BM-MDSC precursors) purified from the bone marrow; normal splenic MDSCs (CD11b+Gr-1+), normal splenic macrophages (Gr-1−CD11b+[high]), and normal splenic dendritic cells (CD11c+) all sorted from naïve WT mice with >90% purity.
FIGURE 1.
miRNA expression profiling of THC-induced functional MDSCs. A, flow cytometric analysis of cells harvested from peritonea of mice, 16 h after in vivo administration of THC or vehicle (Veh) showing robust induction of CD11b+Gr-1+ MDSCs. THC-induced MDSCs were sorted to >93% purity. B, purified THC-MDSCs co-cultured with syngenic T cells polyclonally stimulated with concanavalin A showing significant T cell-suppressive activity as determined by thymidine incorporation. C, false color dendrogram representing unsupervised hierarchical clustering of relative expression values for mouse miRNA in purified cell types as indicated determined using Affymetrix GeneChip miRNA array shows distinct signature in THC-induced MDSCs. Mean expression values were log-transformed and mean-centered. Each sample column represents data from total RNA pooled from two to three independent cell sorts using groups of up to five mice each. In the color scale, red denotes expression above mean, and green denotes expression below mean. SPL, spleen; MAC, macrophage; DC, dendritic cell.
Total RNA including small RNAs were isolated, and the miRNA transcript expression profile was determined using Affymetrix GeneChip® array. The array had 609 mouse miRNA probes. The normalized relative expression values were analyzed by unsupervised hierarchical clustering and visualized in the form of dendrograms (Fig. 1C). THC-induced functional MDSCs showed distinct miRNA expression profile as compared with control BM-MDSC precursors (BM-MDSC) from naïve mice. miRNA expression profile of THC-MDSCs was also distinctly different from that of control spleen MDSCs, CD11b+(Gr-1−) mature macrophages, and CD11c+ dendritic cells, all obtained from spleens of WT mice.
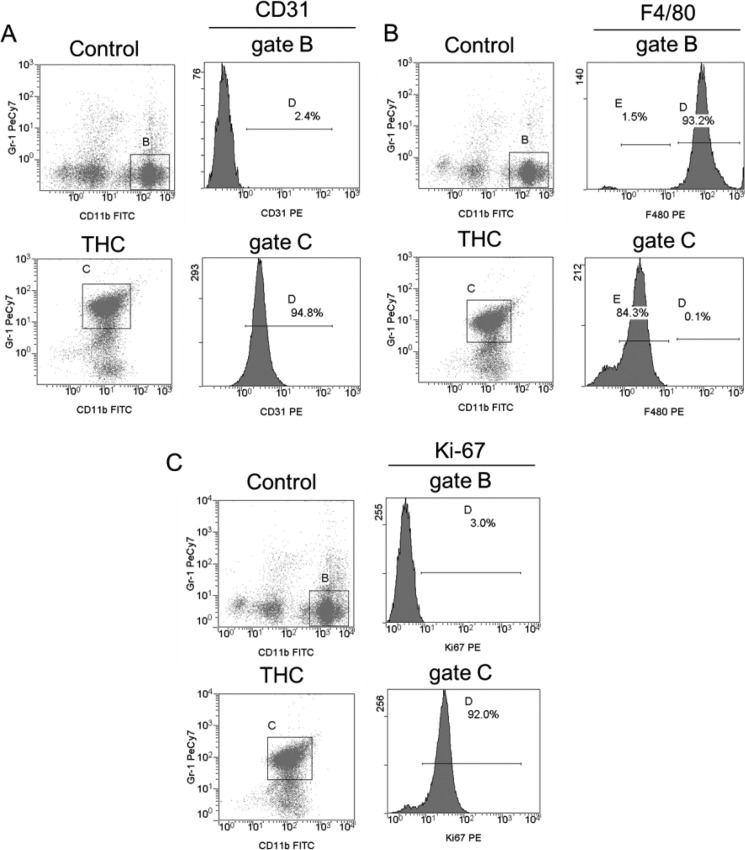
THC-induced MDSC have been characterized as immature myeloid cells derived from BM that have attained a potent immunosuppressive phenotype (22). To further corroborate this, we tested these cells for the expression of immature myeloid marker CD31. The majority of CD11b+Gr-1+ MDSCs induced by THC expressed CD31 (Fig. 2A). In comparison, the classical, CD11bhigh mature macrophages from control peritoneum did not express CD31. Further, gated THC-MDSCs showed relatively low expression of F4/80 when compared to CD11bhigh macrophages (Fig. 2B). Intranuclear staining for Ki-67 revealed that ∼92% of THC-induced MDSCs were undergoing proliferation at 16 h after THC injection (Fig. 2C). These data further confirmed the immature nature of THC-induced MDSCs and ruled out the possibility that they may consist of reprogrammed mature myeloid cells.
FIGURE 2.
Analysis of immature, mature myeloid, and proliferation markers on THC-MDSC. Peritoneal cells harvested at 16 h from control and THC-injected mice were triple-stained for CD11b and Gr-1 along with CD31 (A), F4/80 (B), or Ki-67 (C) and analyzed by FACS. Expression of CD31 or F4/80 or Ki-67 (histograms) on gated CD11bhigh classical mature macrophages from control peritoneum and CD11b+Gr-1+ MDSC from THC-treated mice is shown. A representative plot for each treatment is shown, and frequencies of gated population are indicated.
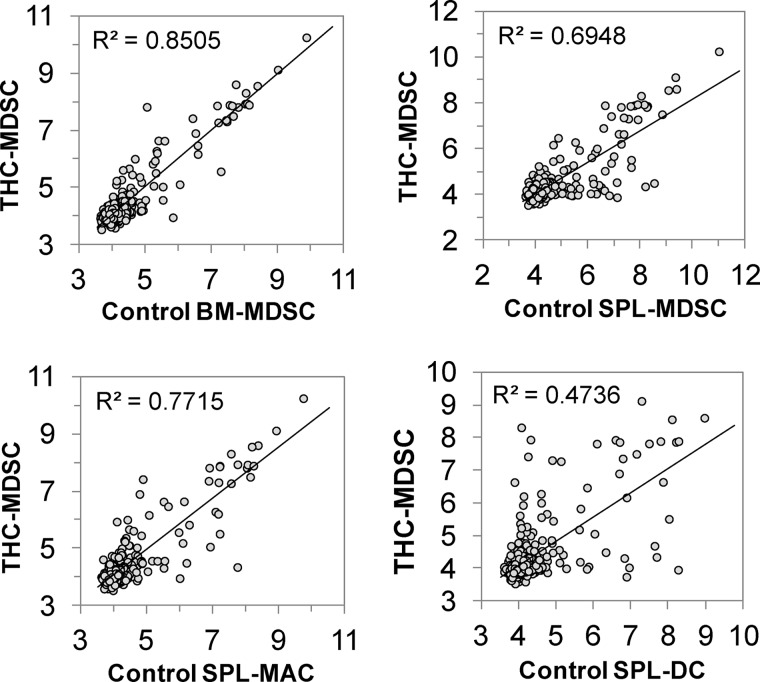
Correlation scatter plots of miRNA expression values between THC-induced functional MDSC and various control myeloid cells are shown in Fig. 3. The R2 values highlight the difference in miRNA expression of THC-MDSCs compared with control myeloid cells. As shown, miRNA expression of THC-MDSCs was found to be highly distinct compared with control dendritic cells (R2 = 0.4736) and was much closer to control BM-MDSC precursors (R2 = 0.8505).
FIGURE 3.
Pairwise correlation comparison of miRNA expression in THC-MDSC with other myeloid cells. Pearson correlation scatter plots of mouse miRNA log2 expression values (signal intensity) for in vivo THC-induced MDSCs versus various control myeloid cells purified from naïve mice. The R2 coefficients for each comparison are shown.
Differentially Expressed miRNA in Functional CD11b+Gr-1+ MDSCs
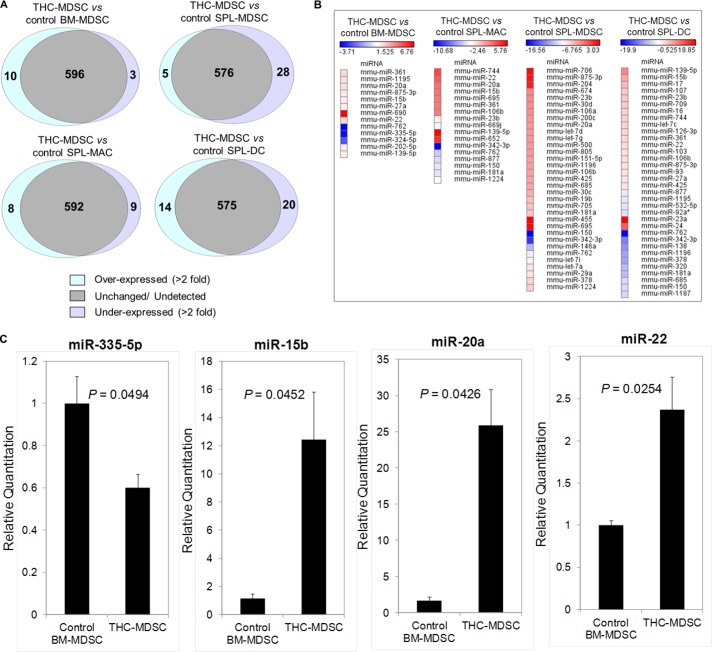
We compared the level of expression of miRNA in THC-MDSCs relative to control MDSCs and other myeloid cells. A large number of miRNA among the 609 mouse miRNA analyzed were undetectable or were unchanged (<2-fold) in THC-MDSC compared with other samples. We identified differentially expressed miRNA showing greater than 2-fold differences in expression in THC-MDSC. The number of miRNA that were overexpressed, unchanged, or underexpressed in THC-MDSCs for each comparison is represented in Venn diagrams (Fig. 4A). The heat map of differentially expressed miRNA in THC-MDSCs and their corresponding fold changes (Fig. 4B) indicates that a small number of miRNA were markedly altered in functional THC-induced MDSCs compared with their bone marrow precursors or other control myeloid cells.
FIGURE 4.
Differential expression of miRNA in THC-induced functional MDSCs. A, Venn diagrams representing number of up-regulated, down-regulated, and unchanged mouse miRNA in THC-MDSC compared with control myeloid cells as indicated. B, heat map of fold changes of differentially expressed miRNA in THC-MDSC showing >2-fold difference in expression as compared with control myeloid cells. C, real time qPCR validation. Total RNA from THC-MDSC and control BM-MDSC were analyzed for the indicated mouse miRNA expression by real time quantitative PCR normalized to internal control RNU-1A. Total RNA isolated from two or three independent cell sorts from groups of up to five mice for each sample were analyzed separately, and standard deviations are represented as error bars.
Next, to investigate putative miRNA and their targets that may be potentially associated with the differentiation of BM precursors to immunosuppressive functional MDSCs in vivo, we focused on miRNA altered in THC-MDSCs relative to control BM-MDSC. A list of 13 differentially regulated miRNA (10 overexpressed and 3 underexpressed) with their seed sequences, chromosome locations, and miRBase accession numbers is shown in Table 2. mmu-miR-690 was the most highly overexpressed in THC-MDSC with a +6.7-fold difference, and mmu-miR-762 was the highly underexpressed with a −3.7-fold difference in expression. We validated some of the differentially expressed miRNA in THC-MDSC using real time qPCR. As shown in Fig. 4C, mmu-miR-15b, mmu-miR-20a, and mmu-miR-22 were significantly overexpressed, whereas mmu-miR-335-5p was significantly underexpressed in THC-MDSCs relative to control BM-MDSCs, which corroborated the overall trend observed with the high throughput array results.
TABLE 2.
Differentially expressed (>2-fold) miRNA in THC-induced MDSC relative to control BM precursors
| miRNA | Fold change | Chromosome location | Seed sequencea | miRBase accession number |
|---|---|---|---|---|
| Overexpressed | ||||
| mmu-miR-690 | 6.8 | Chr16 | AAGGCUA | MIMAT0003469 |
| mmu-miR-22 | 2.5 | Chr11 | AGCUGCC | MIMAT0000531 |
| mmu-miR-361 | 2.4 | ChrX | UAUCAGA | MIMAT0000704 |
| mmu-miR-1195 | 2.3 | Chr17 | GAGUUCG | MIMAT0005856 |
| mmu-miR-20a | 2.2 | Chr14 | AAAGUGC | MIMAT0000529 |
| mmu-miR-875-3p | 2.1 | Chr15 | CUGAAAA | MIMAT0004938 |
| mmu-miR-15b | 2.1 | Chr3 | AGCAGCA | MIMAT0000124 |
| mmu-miR-27a | 2.0 | Chr8 | UCACAGU | MIMAT0000537 |
| mmu-miR-139-5p | 2.0 | Chr7 | CUACAGU | MIMAT0000656 |
| mmu-miR-202-5p | 2.0 | Chr7 | UCCUAUG | MIMAT0004546 |
| Underexpressed | ||||
| mmu-miR-324-5p | −2.0 | Chr11 | GCAUCCC | MIMAT0000555 |
| mmu-miR-335-5p | −3.3 | Chr6 | CAAGAGC | MIMAT0000766 |
| mmu-miR-762 | −3.7 | Chr7 | GGGCUGG | MIMAT0003892 |
a 7-mer seed sequence (bases 2–8).
Predicted Targets of Differentially Expressed miRNA in Functional MDSCs
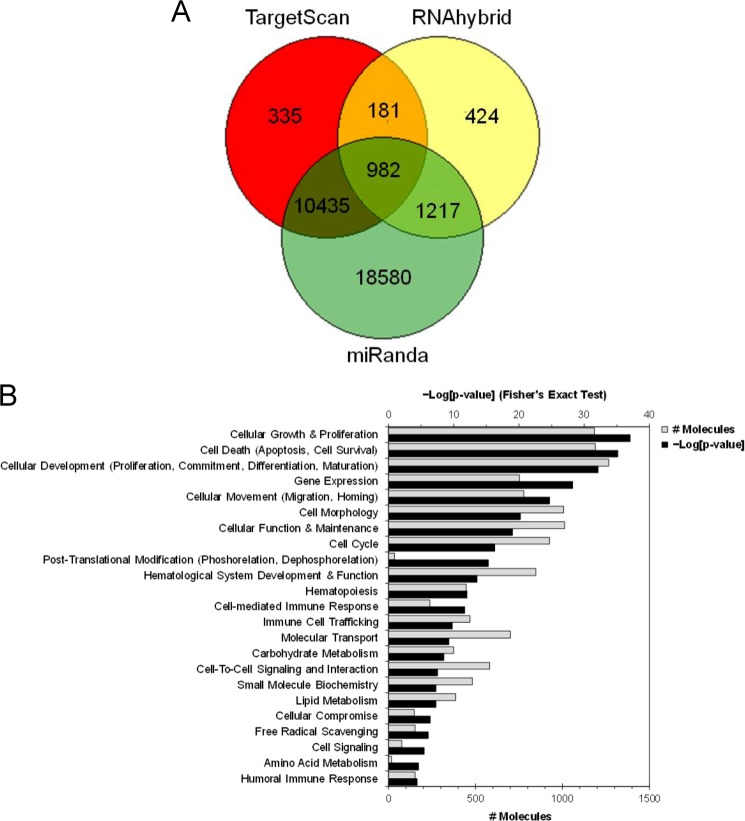
To identify putative target genes regulated by miRNA in functional MDSCs, we employed multiple computational prediction tools as described under “Experimental Procedures.” Targets of differentially expressed miRNA in THC-MDSC predicted by at least two of the three leading and reliable algorithms (TargetScan, RNAhybrid and miRanda) with a p value of <0.05 were identified as predicted targets (supplemental Table S1). It should be noted that TargetScan predictions are based on sequence complementarity to target sites with an emphasis on base pairing in the seed region as well as target mRNA UTR conservation (2, 3). RNAhybrid (26) is based on calculations of stability of secondary structures and energetically favorable hybridization between miRNA and target mRNA. miRanda with mirSVR scoring (27) uses weighted dynamic programming to compute optimal sequence complementarity and free energy (thermodynamic stability) of miRNA:mRNA duplex estimated by Vienna package as the secondary filter. Thus a combination of these tools provides a robust approach to identify high predictive, potential functionally relevant miRNA-target gene interactions. In addition to the conserved targets, this unique approach helps identify good targets that are poorly conserved, consistent with increasing experimental evidence supporting the fact that such interactions could also be functionally important (3, 34). Distribution of the number of targets predicted by the three software programs is represented in the form of a Venn diagram (Fig. 5A). A total of 12,815 genes were predicted by at least two of the three algorithms, among which 982 target genes were common to all three. Further, we used TarBase and miRecords databases and identified 21 experimentally supported targets for six of the differentially expressed miRNA in THC-MDSC. The predicted and the experimentally validated targets were merged and used as a single data set for pathway analysis.
FIGURE 5.
miRNA target prediction and functional annotation analysis. A, Venn diagram showing distribution of number of gene targets for differentially expressed miRNA in THC-MDSC predicted by three algorithms as indicated. B, a combined set containing predicted and experimentally supported target genes for the differentially expressed miRNA in THC-MDSC were analyzed using Ingenuity® pathway analysis for significant enrichment of genes into functional annotation categories (Fisher's exact test p value). Significantly enriched categories excluding cancer and the neuronal annotations are shown with −log[p value] and the number of miRNA gene targets.
Functional Annotation Enrichment Analysis
The enrichment of target genes into major functional annotation categories with respective enrichment p values and a number of associated target molecules is shown in Fig. 5B. We observed that cellular growth and proliferation, cell death including cell survival, and cellular development including cell differentiation and maturation were the most highly enriched categories for the miRNA targets in THC-MDSC. In addition, hematopoiesis and cell migration, particularly immune cell trafficking, were significantly enriched as well. Highly significant association (p < 0.001) of a number of targets of differentially expressed miRNA in THC-MDSC versus BM precursors with these functional categories suggests that these functions are most likely influenced or regulated by miRNA altered during the development and differentiation of functional MDSCs from BM precursors.
GO Enrichment Mapping
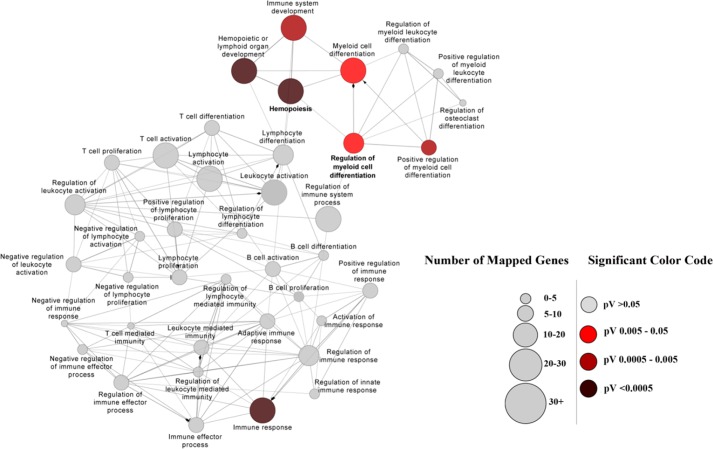
Gene Ontology enrichment analysis of miRNA target genes in THC-MDSC was performed and mapped for biological process: GO:0002376 immune system process (Fig. 6). We found highly significant overrepresentation of immune response (GO:0006955) and hemopoiesis (GO:0030097) in the target genes, with corrected p values for false positive discovery being <0.0005. In addition, interestingly, we saw significant overrepresentation of myeloid cell differentiation (GO:0030099) and regulation of myeloid cell differentiation (GO:0045637) GO classifications (p < 0.05), suggesting the putative involvement and significance of differentially expressed miRNA in THC-MDSC in the regulation of target genes associated with these processes.
FIGURE 6.
GO enrichment mapping. miRNA target genes in THC-MDSC were analyzed for GO enrichment and mapped for GO category: immune system process, using Cytoscape suite with ClueGo and CluePedia plugins. Two-sided hypergeometric statistic was performed with Kappa score threshold setting of 0.3. Enrichment and depletion were calculated based on Benjamini-Hochberg corrected p values (pV). GO clusters with enrichment p values >0.05 and hence not significant are shown in gray. Significantly enriched GO groups with corrected p values of <0.05 are denoted and color-coded for different significance levels as indicated. The diameter of each circle represents the number of miRNA target genes in each cluster scaled as shown.
miRNA Target Pathways in Functional MDSC
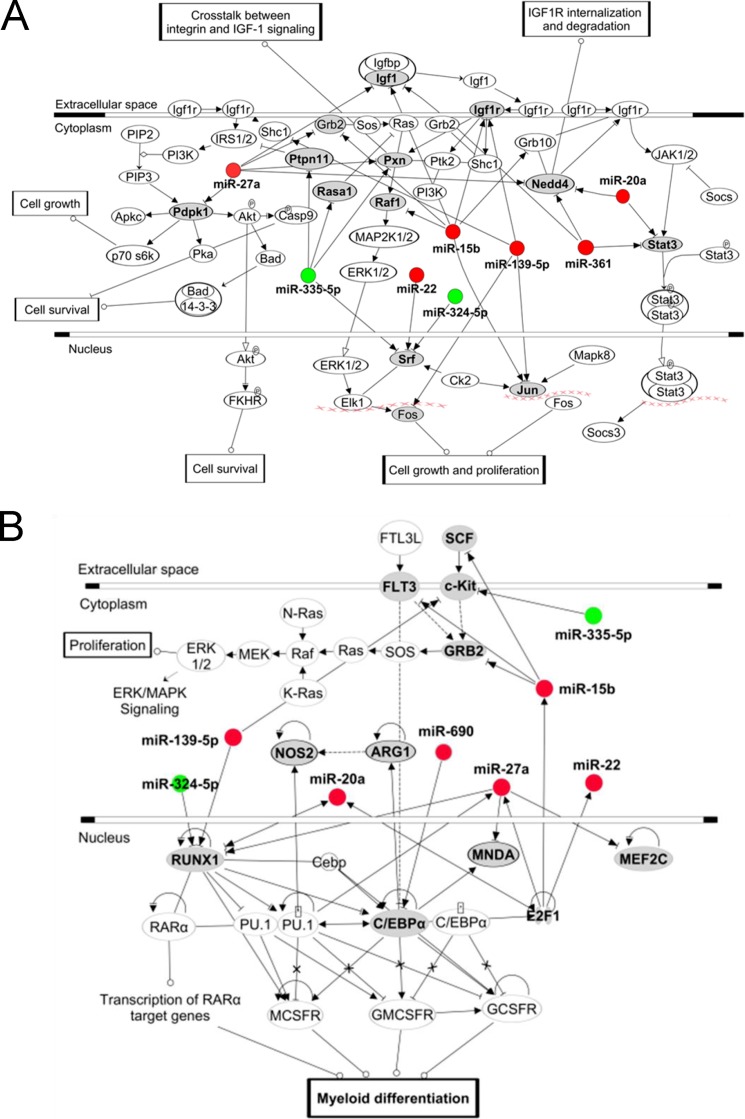
The predicted and experimentally supported target genes of differentially expressed miRNA in THC-MDSC were combined and analyzed for their significant association with canonical pathways (supplemental Table S2). Several significantly predicted pathways appeared to be relevant to cell growth and proliferation in general, as well as development, differentiation, and function of myeloid cells. These molecular pathways were most likely to be influenced by the differentially regulated miRNA during the development and differentiation of BM precursors into functional MDSCs. Pathway maps for the top predicted pathways, (i) insulin-like growth factor 1 (Igf1) pathway (Fig. 7A), which regulates cell growth and proliferation in general, and (ii) multiple pathways involved in myeloid differentiation and function (Fig. 7B), are shown highlighting the target genes of overexpressed and underexpressed miRNA in THC-MDSC. Likely crucial transcription factors and target molecules are listed in Table 3. Several important molecules in these pathways appear to be direct targets of differentially expressed miRNA in THC-MDSC, identifying multiple interesting miRNA-mediated regulatory nodes with likely roles in the differentiation of BM precursors into MDSCs and in the regulation of their expansion and function.
FIGURE 7.
Enriched canonical pathways of miRNA target genes. A, IGF1 signaling pathway. The pathway map of Kyoto Encyclopedia of Genes and Genomes-derived IGF-1 signaling pathway drawn using IPA, which was the top significantly enriched canonical pathway for differentially expressed miRNA targets in THC-MDSC versus BM MDSC precursors (supplemental Table S2). B, miRNA targets were analyzed for their association with pathways involved in myeloid development, differentiation, and function using IPA. Differentially expressed miRNA in THC-MDSC are highlighted in red for overexpressed and in green for underexpressed. The direct targets of differentially expressed miRNA in the pathway are indicated in bold letters and denoted with gray ovals.
TABLE 3.
Important transcription factor and gene targets of differentially expressed miRNA in THC-induced MDSC
| miRNA | Targetsa |
|---|---|
| mmu-miR-690 | C/ebpα |
| mmu-miR-22 | Srf |
| mmu-miR-1195 | Igf1, Nedd4, Stat3 |
| mmu-miR-20a | Nedd4, Stat3b,c, Runx1 |
| mmu-miR-15b | Igf1, Igf1r, Jun, Raf1, Grb2, Grb10, Scf, Flt3 |
| mmu-miR-27a | Igf1, Nedd4, Pxn, Pdpk1, Grb2, Mef2c, MNDA, Runx1b |
| mmu-miR-139-5p | Jun, Fos, Igf1r, Shc1, c-Kit, Runx1 |
| mmu-miR-324-5p | Srf, Runx1 |
| mmu-miR-335-5p | Srf, Pxn, Rasa1, Ptpn11, c-Kit |
a Important targets involved in cell growth and proliferation, myeloid cell development, differentiation, and function pathways as highlighted in Fig. 7.
b Experimentally validated miRNA targets from the curated database TarBase.
c Experimentally validated miRNA targets from the curated database miRecords.
Experimental Validation of Predicted Target Genes
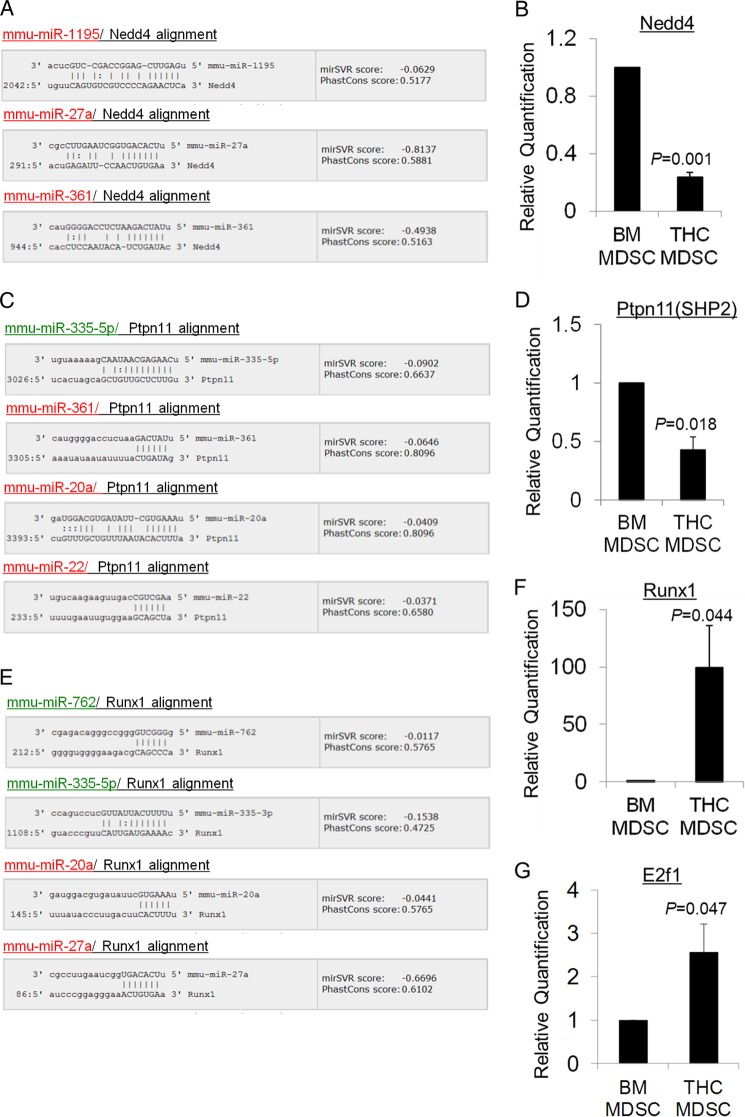
To test the biological relevance of these predictions, we determined the levels of some of the important predicted target gene transcripts in THC-MDSC by real time qPCR assays. Multiple up-regulated miRNA in THC-MDSC were found to target Nedd4 (Fig. 7A), which is a ubiquitin ligase known to regulate Igf1-Igf1r signaling. Putative binding sites for miR-27a, miR-361, and miR-1195 on the 3′-UTR of Nedd4 mRNA are depicted in Fig. 8A. We found that Nedd4 mRNA levels were down-regulated in THC-MDSC relative to BM precursors by ∼3-fold (Fig. 8B).
FIGURE 8.
Experimental validation of in silico predicted miRNA target genes. Some of the predicted target genes of differentially expressed miRNA in THC-MDSC relative to BM precursors involved in top enriched pathways were validated by qPCR. miRanda-generated alignments of target binding sites on 3′-UTR of Nedd4, Ptpn11, and Runx1 with seed sequence of differentially expressed miRNA with good mirSVR scores are shown (A, C, and E). 6-mer or better seed match and mirSVR score cutoff of ≤−0.01 was used, and the top four predictions are shown for each. mirSVR down-regulation scores represent the likelihood of target mRNA down-regulation (log fold change) for each miRNA-mRNA predicted target site and are based on a regression model that takes into account sequence match as well as structure-stability features and is calibrated to correlate linearly with the extent of down-regulation. PhastCons conservation scores for the UTR target sites are also shown. Up-regulated miRNA are highlighted in red, and down-regulated miRNA are in green. The results of real time qPCR analysis of gene transcripts normalized to 18 S in purified control BM precursors and THC-induced MDSCs are depicted in B, D, F, and G.
Unlike Nedd4, protein-tyrosine phosphatase Ptpn11(SHP-2) involved in Igf1 signaling (Fig. 7A) was targeted by several up-regulated miRNA and miR-335-5p, which was down-regulated in THC-MDSC (Fig. 8C). Ptpn11 mRNA levels were significantly decreased in THC-MDSC compared with BM control (Fig. 8D).
Runt-related transcription factor 1 (RUNX1), a regulator of normal hematopoiesis, plays an important role in myeloid differentiation (Fig. 7B). Target binding sites for multiple up-regulated and down-regulated miRNA in THC-MDSC were found on Runx1 3′-UTR (Fig. 8E). However, we observed a dramatic increase in the Runx1 transcript level in THC-MDSC over control precursors by close to 100-fold (Fig. 8F).
Transcription factor E2F1 is known to promote the expression of a number of miRNA including miR-27a and miR-22 that were up-regulated in THC-MDSC. When tested by qPCR, E2f1 mRNA levels were significantly higher in THC-MDSC relative to BM controls (Fig. 8G).
Role of miR-690 in the Regulation of C/EBPα
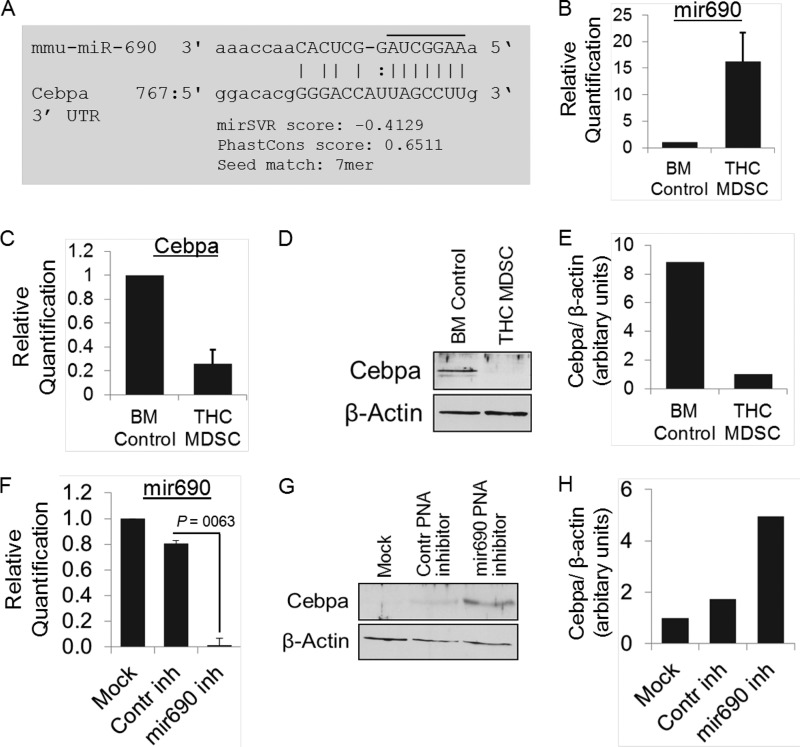
miR-690 was the most highly overexpressed among altered miRNA in THC-MDSC over BM precursors (Table 2). The transcription factor C/EBPα is an important regulator of cell differentiation, particularly terminal differentiation of granulocytes. Interestingly, C/EBPα was one of the high predictive targets of miR-690 (Fig. 9A) based on multiple algorithms (miRanda-mirSVR and TargetScan). Validation by real time qPCR confirmed the significant up-regulation of miR-690 in THC-induced MDSC (Fig. 9B). Cebpa mRNA levels and protein expression were assessed by qPCR (Fig. 9C) and Western blotting (Fig. 9, D and E), respectively. BM precursors showed high expression of C/EBPα, which was attenuated in THC-MDSC both at the transcript and protein levels. The expression of miR-690 and its target C/EBPα were inversely correlated. These results indicated that C/EBPα might be a functional target regulated by miR-690.
FIGURE 9.
Regulation of C/EBPα by miR-690 in MDSCs. A, target prediction of mmu-miR-690 using miRanda-mirSVR and TargetScanS showing alignment of mature miRNA with 3′-UTR of C/ebpα mRNA. miR-690-binding site with 7-mer-m8 seed match (an exact match to positions 2–8 of the mature miRNA (the seed + position 8)) resides at nucleotide positions 782–788 of C/ebpα mRNA 3′-UTR. B, real time qPCR determination of miR-690 normalized to endogenous control U6 in BM precursors and THC-MDSC. C, real time qPCR analysis of C/ebpα mRNA in THC-MDSC versus BM precursors normalized to 18 S. D, Western blotting analysis of C/EBPα protein expression. E, densitometry of Western blotting showing relative expression of C/EBPα normalized to control β-actin. F and G, total RNA was extracted from THC-MDSCs transfected with negative control PNA anti-miR or PNA anti-miR-690 (500 nmol/liter) in the presence of Lipofectamine 2000 reagent. F, miR-690 expression analyzed by real time qPCR and normalized to U6 shows effective knockdown of miRNA-690 in THC-MDSC. G, analysis of C/EBPα by Western blotting following miR-690 knockdown in THC-MDSC. H, relative expression normalized to control β-actin as determined by densitometry. inh, inhibitor.
Regulation of C/EBPα by miR-690 was further studied by transient knockdown of the miRNA using stable antisense inhibitors with modified PNA backbone. PNA anti-miRs are a new class of modified nucleic acid antisense miRNA inhibitors that are resistant to nuclease and protease activity, thereby capable of causing sustained silencing of miRNA. In addition, they exhibit superior affinity and specificity to target RNA compared with regular DNA oligonucleotides and hence are utilized as ideal antisense reagents to inhibit miRNA effectively (35, 36). Transfection of THC-MDSCs with control anti-miR PNA did not significantly alter the expression of miR-690 as compared with mock transfection with transfection reagent alone, whereas cells transfected with anti-miR-690 PNA showed highly reduced levels of miR-690, indicating effective knockdown of the miRNA (Fig. 9F). Western blotting analysis showed markedly higher expression of C/EBPα protein in cells transfected with anti-miR-690 as compared with controls (Fig. 9, G and H), indicating unblocking and enhanced expression of C/EBPα following miR-690 knockdown. Overall, these data suggest that miR-690, which is relatively highly expressed in THC-induced functional MDSCs relative to its BM precursors, may play an important role by regulating and silencing C/EBPα in these cells.
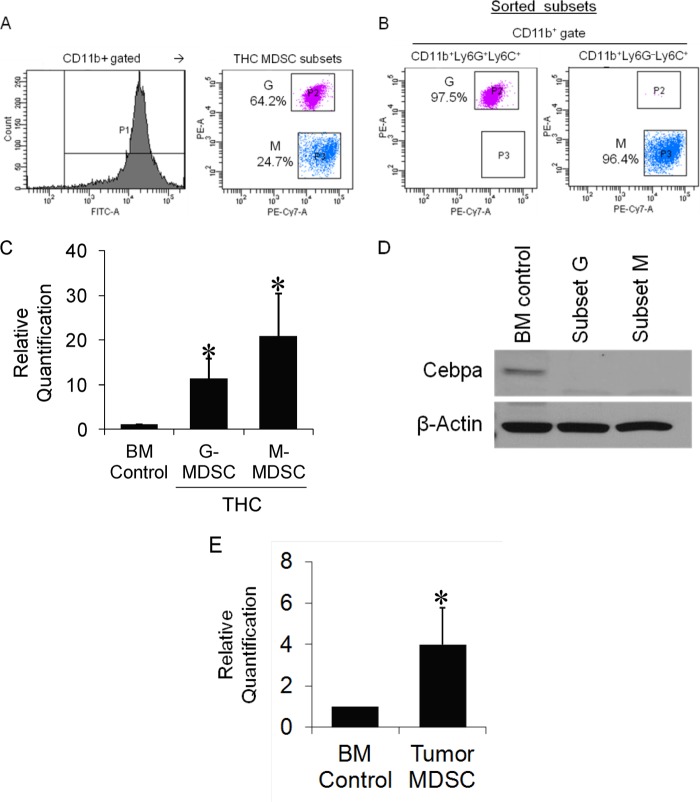
To further assess the role of miR-690 and C/EBPα in MDSC subsets, we purified THC-induced CD11b+Ly6G+Ly6C+ granulocytic (G) and CD11b+Ly6G−Ly6C+ monocytic (M) subtypes by FACS sorting to >96% purity (Fig. 10, A and B) and determined their levels. Real time qPCR analysis showed marked increases in the expression of miR-690 in both subsets over control BM precursors (Fig. 10C). Moreover, C/EBPα protein expression was suppressed in both the subsets compared with BM controls (Fig. 10D). These results suggested that miR-690 is likely a pan-MDSC regulator.
FIGURE 10.
Determination of miR-690 and C/EBPα in MDSC subsets. A and B, MDSCs harvested from the peritoneum of THC-injected mice were triple stained and FACS sorted for CD11b+Ly6G+Ly6C+ and CD11b+Ly6G−Ly6C+ subsets to >96% purity and used for extraction of total RNA and protein. C and D, miR-690 levels were determined by real time qPCR and normalized to control miRNA U6 (C) and C/EBPα protein expression by Western blotting (D). E, analysis of miR-690 in tumor-induced MDSCs. CD11b+Gr-1+ MDSCs from spleens EL-4 tumor-bearing mice were purified by sorting, and total RNA was extracted. miR-690 levels were determined by qPCR and normalized to U6 and compared with control BM precursors. *, p < 0.05 compared with BM control.
To test whether miR-690 is common to MDSCs induced in response to diverse stimuli or rather unique to THC-MDSCs, we used an additional system for induction of MDSCs for comparison. We used tumor-induced MDSCs because they have been well characterized. BL/6 mice were inoculated with syngenic EL-4 tumor cells, and CD11b+Gr-1+ MDSCs from spleens of tumor-bearing mice were purified on day 14. EL-4 tumor-induced MDSCs showed a smaller yet significant increase in miR-690 over BM control (Fig. 10E). Relatively, miR-690 expression appeared to be more pronounced in THC-MDSCs.
DISCUSSION
Myeloid cells such as neutrophils, monocytes-macrophages, and dendritic cells are derived from BM marrow progenitors. Immature myeloid cells leave the BM to migrate to the periphery as they undergo differentiation and maturation. Some myeloid cells remain or get arrested in an immature state and acquire a potent functional capacity to suppress T cell responses. These are referred to as myeloid-derived suppressor cells (15, 18, 37–41). In mice, MDSCs characteristically co-express myeloid cell lineage differentiation antigen Gr-1 and CD11b (αM-integrin). CD11b+Gr-1+ cells are present in very small numbers in the spleen and periphery of naïve mice, whereas CD11b+Gr-1+ cells constitute 18–50% of normal bone marrow cells (22, 38, 42). These BM precursors are usually the primary source of MDSCs. CD11b+Gr-1+ cells from naïve BM are not immunosuppressive and need multiple signals and activation as they migrate and differentiate into functional MDSCs, at the same time their terminal differentiation is arrested so that they remain as an immature population.
MDSCs were first identified as an expanding population in response to tumors, capable of suppressing the anti-tumor immune response (37, 38, 40). MDSCs also accumulate during infectious pathologies and inflammatory conditions (39, 41, 43). Recently, we have demonstrated that natural immunosuppressive compounds such as marijuana THC can induce large numbers of CD11b+Gr-1+ functional MDSCs from bone marrow in vivo (22). THC-induced MDSC were found to be highly immunosuppressive capable of suppressing T cell responses in vitro and upon adoptive transfer in vivo (22).
Regulation of gene expression by miRNA is believed to be crucial in a wide range of biological processes. Emerging evidence suggests that miRNA regulate the development, differentiation, and function of a variety of immune cells including myeloid cells (8, 10, 44, 45). However, a global miRNA expression profile specific to a functional MDSC population is not known. Having made the unique observation that THC administration triggers induction of functional MDSCs (22), here we sought to investigate and compare the global miRNA expression profile of THC-MDSCs with cells of myeloid lineage to determine cell type-specific miRNA expression profile. To identify the miRNA that may be important in MDSC differentiation and function, we compared the miRNA expression between THC-MDSC and control BM precursors and identified highly differentially expressed (>2-fold) miRNA in functional THC-MDSCs. High throughput profiling was validated by real time qPCR determination of a few differentially expressed miRNA. We used a combination of computational algorithms to predict the targets of differentially expressed miRNA in functional MDSC. The miRNA targets were further analyzed for their involvement in molecular functions and pathways. We have identified several interesting and potentially important molecular interactions involved in MDSC differentiation and function.
Insulin-like growth factor (IGF1) signaling was the top canonical pathway likely influenced by target genes of differentially expressed miRNA in MDSCs induced by THC. This was particularly interesting given the fact that G-CSF was found to be a factor in the induction of MDSCs by THC (22) and was shown to have a positive effect on IGF1 signaling (46). IGF1-IGF1R signaling stimulates cell proliferation, growth, and survival in normal and malignant cells (47). Several up-regulated miRNA in THC-MDSC were found to target ubiquitin ligase Nedd4 in this pathway, which mediates IGF1R internalization and degradation. In fact, we found that Nedd4 mRNA levels were decreased in THC-MDSC. This may play a role in promoting proliferation and survival of MDSCs in periphery by enhancing IGF1R signaling. In addition, several molecules in this pathway namely, serum response factor (Srf), Ptpn11, RAS p21 protein activator 1 (Rasa1), and paxillin (Pxn) were targets of down-regulated miR-335-5p and miR-324-5p, which could influence the regulation of these targets in MDSCs by unblocking. However, Ptpn11, which was also targeted by up-regulated miRNA, was found to be down-modulated at the mRNA level in THC-MDSC.
A number of transcription factors play pivotal roles in regulating the differentiation of myeloid cells into active mediators of the innate immune system. Several among them, namely PU.1, RUNX1, C/EBPα, and c-JUN, were found to be the direct targets of differentially expressed miRNA in THC-MDSC. Extensive cross-talk between these transcription factors is further known to control complex pathways of monocytic and granulocytic differentiation (48). Runx1 stimulates proliferation and differentiation of myeloid progenitors (49). Multiple overexpressed and underexpressed miRNA in THC-MDSC had good binding sites on Runx1 mRNA 3′-UTR, which indicated a typically complex, probably finely tuned miRNA regulatory circuit. Among these, miR-27-Runx1 was noted to be experimentally supported based on curated database TarBase. Nonetheless, Runx1 transcripts were found to be relatively abundant in THC-MDSC versus BM precursors. miR-335-5p and/or miR-762, which are expressed higher in BM precursors and down-regulated in THC-MDSC (thus unblocking the target Runx1), may be playing a more predominant role here. For multiple altered miRNA targeting the same 3′-UTR as in this case, the relative kinetics of expression of those miRNA (appearance or disappearance) during differentiation most likely determines the dominant interactions and outcome.
The E2F family of transcription factors can enhance the expression of a number of miRNA, for example miR-15b, miR-20a, miR-22, and miR-27a, likely by directly binding to the promoters and activating their transcription (50, 51). Interestingly, E2f1 was increased, and all these miRNA were overexpressed in THC-induced MDSCs.
It is an exciting and major finding that miR-690, highly overexpressed in THC-MDSC relative to control BM-MDSC precursors, targets C/EBPα. C/EBPα is an important transcription factor involved in the development of granulocyte-monocyte progenitors and their subsequent terminal differentiation (52, 53). C/ebpα(−/−) null mice lack mature granulocytes (54); activation of C/EBPα in mice expressing its inducible form leads to increases in mature granulocytes and myeloid progenitors (55). These studies demonstrate the critical nature of C/EBPα in the terminal differentiation granulocytes. We observed higher expression of C/EBPα in BM MDSC precursors and attenuated levels in THC-MDSCs, with a reciprocal relationship with miR-690 expression. We further established the functional link between these two by inhibiting miR-690 in THC-MDSCs, which appeared to unblock leading to significant up-regulation of C/EBPα. Regulation of some E2F family proteins by C/EBPα plays a role in its ability to induce terminal granulocyte differentiation (56). Master transcription factor PU.1 regulates macrophage differentiation (57), and interaction of PU.1 with C/EBPα contributes to this process (52). We have shown here as well as previously (22) that THC induces both granulocytic and monocytic MDSC subsets. Furthermore, C/EBPα is also known to block cell cycle progression by interacting with E2F proteins so that a loss of C/EBPα leads to increased myeloid proliferation (58). We have seen significant proliferation of THC-induced MDSCs in vivo in the periphery (22), further demonstrated here by Ki67 staining. This, coupled with the detection of immature myeloid marker CD31, supports the hypothesis that they are derived from BM precursors and arrested at an immature state acquiring potent suppressive activity. These observations also rule out the possibility of reprogramming of mature myeloid cells into suppressor cells by THC. Both MDSC subsets induced by THC express high levels of miR-690 with attenuated C/EBPα expression. Moreover, a smaller but significant increase in miR-690 expression could be seen in tumor-induced MDSCs. Therefore, we propose here that up-regulation of miR-690 and silencing of C/EBPα play crucial roles during the development of functional MDSC in general, by blocking or slowing their terminal differentiation while maintaining the immature immunosuppressive state at the same time aiding their proliferation.
A few studies have explored the role of specific miRNA associated with development of MDSCs recently, particularly in tumor models (59–62). miR-223 was reported to suppress the accumulation of BM-derived MDSCs (59). However, it is inconclusive, because in another study, miR-223 null mice were found to exhibit enhanced, hypermature neutrophilic phenotype (60). Further, miR-223 was found to negatively regulate progenitor proliferation, granulocyte differentiation, and activation in a MEF2C-dependent manner (60). miR-494 expression induced by tumor-derived TGF-β1 was shown to play a critical role in the regulation of accumulation and function of tumor-expanded MDSCs by specifically targeting PTEN (61). miR-17-5p and miR-20a could decrease the expression of reactive oxygen species and suppressive function of tumor-induced MDSCs by targeting Stat3 (62). In the current study, miR-223, miR-494, and miR-17-5p expression levels were <2-fold between THC-MDSCs and BM precursors and hence not significantly altered, whereas miR-20a was found to be up-regulated, suggesting possible unique differences between tumor-induced and THC-induced MDSC with regards to miRNA regulatory circuits. It should be noted that tumor-induced expansion of MDSCs involves tumor-derived factors such as IL-1β, IL-6, TGF-β1, S100 proteins, prostaglandin E2, or various cytokines and chemokines such as CXCL12 (SDF1) and G-CSF (16, 63–65), whereas expansion of MDSCs in response to THC was found to be primarily mediated by G-CSF in association with CXCL1 (22).
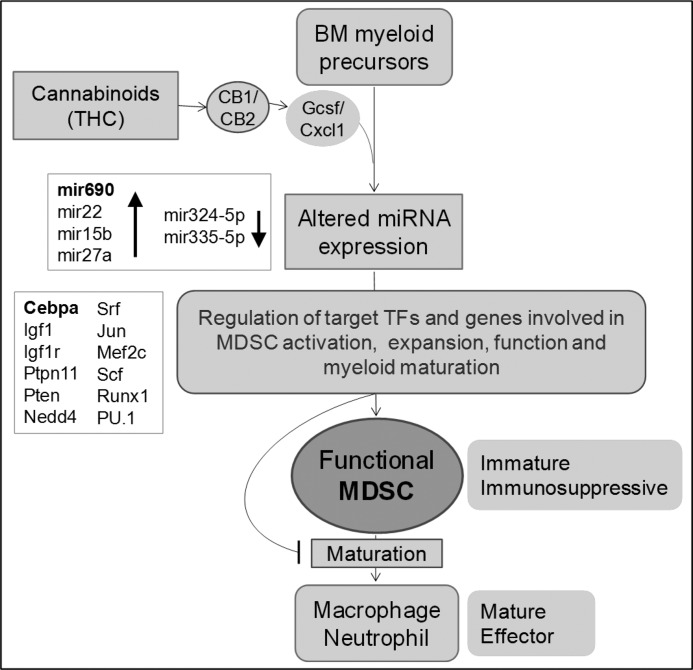
In this report, we have presented the miRNA expression profile of CD11b+Gr-1+ functional MDSCs induced by the immunosuppressive cannabinoid THC in vivo. We have identified the select set of differentially expressed miRNA in functional MDSCs that are significantly altered when compared with their BM precursors. We have identified several interesting miRNA-target interactions involved in cell growth and proliferation and myeloid differentiation with potential functional role in MDSC development, expansion, and function. Distinct miRNA expression in MDSCs also highlights how unique they are compared with various other myeloid cells with respect to molecular signatures. Our conclusions and proposed mechanisms are presented in a schematic summary (Fig. 11). miRNA expression profiling and pathway analysis of target genes leads us to conclude that miRNA may play a crucial role in the generation of functional MDSCs by regulating several important transcription factors and target genes, thereby promoting myeloid differentiation, MDSC expansion, and function, at the same time blocking their terminal maturation. Select differentially expressed miRNA such as miR-690, which appears to regulate C/EBPα as identified here, will be attractive molecular targets to manipulate MDSC activity in inflammatory diseases as well as cancer.
FIGURE 11.
Schematic representation of proposed involvement of miRNA and their target genes in the induction of functional MDSC from bone marrow. We have previously shown that induction of functional MDSCs by THC in vivo is dependent on cannabinoid receptor activation and is primarily mediated by G-CSF and CXCL1 chemokines (22). Here we demonstrate distinct, altered miRNA expression profile of THC-induced functional MDSCs relative to BM precursors. We propose that select miRNA play important roles in the generation of functional MDSC by targeting and regulating crucial transcription factors, genes, and pathways involved in MDSC generation, expansion, and function. Moreover, miRNA may be crucial in the arrest of MDSCs in an immature state by negatively regulating genes involved in their terminal differentiation into mature granulocytes and macrophages.
This work was supported, in whole or in part, by National Institutes of Health Grants P01AT003961, P20RR032684, R01AT006888, R01ES019313, and R01MH094755. This work was also supported by Veterans Affairs Merit Award 1 01BX001357 (to P. S. N. and M. N.).

This article contains supplemental Tables S1 and S2.
- miR/miRNA
- microRNA(s)
- C/EBPα or Cebpa
- CCAAT/enhancer-binding protein α
- GO
- Gene Ontology
- MDSC
- myeloid-derived suppressor cell
- THC
- Δ9-tetrahydrocannabinol
- qPCR
- quantitative PCR
- IGF
- insulin-like growth factor
- PNA
- peptide nucleic acid
- PE
- phycoerythrin
- G-CSF
- granulocyte colony-stimulating factor
- GM-CSF
- granulocyte/macrophage colony-stimulating factor
- IPA
- Ingenuity pathway analysis
- BM
- bone marrow.
REFERENCES
- 1. Pasquinelli A. E. (2012) MicroRNAs and their targets. Recognition, regulation and an emerging reciprocal relationship. Nat. Rev. Genet. 13, 271–282 [DOI] [PubMed] [Google Scholar]
- 2. Grimson A., Farh K. K., Johnston W. K., Garrett-Engele P., Lim L. P., Bartel D. P. (2007) MicroRNA targeting specificity in mammals. Determinants beyond seed pairing. Mol. Cell 27, 91–105 [DOI] [PMC free article] [PubMed] [Google Scholar]
- 3. Bartel D. P. (2009) MicroRNAs. Target recognition and regulatory functions. Cell 136, 215–233 [DOI] [PMC free article] [PubMed] [Google Scholar]
- 4. Friedman R. C., Farh K. K., Burge C. B., Bartel D. P. (2009) Most mammalian mRNAs are conserved targets of microRNAs. Genome Res. 19, 92–105 [DOI] [PMC free article] [PubMed] [Google Scholar]
- 5. Landgraf P., Rusu M., Sheridan R., Sewer A., Iovino N., Aravin A., Pfeffer S., Rice A., Kamphorst A. O., Landthaler M., Lin C., Socci N. D., Hermida L., Fulci V., Chiaretti S., Foà R., Schliwka J., Fuchs U., Novosel A., Müller R.-U., Schermer B., Bissels U., Inman J., Phan Q., Chien M., Weir D. B., Choksi R., De Vita G., Frezzetti D., Trompeter H.-I., Hornung V., Teng G., Hartmann G., Palkovits M., Di Lauro R., Wernet P., Macino G., Rogler C. E., Nagle J. W., Ju J., Papavasiliou F. N., Benzing T., Lichter P., Tam W., Brownstein M. J., Bosio A., Borkhardt A., Russo J. J., Sander C., Zavolan M., Tuschl T. (2007) A mammalian microRNA expression atlas based on small RNA library sequencing. Cell 129, 1401–1414 [DOI] [PMC free article] [PubMed] [Google Scholar]
- 6. Guan H., Fan D., Mrelashvili D., Hao H., Singh N. P., Singh U. P., Nagarkatti P. S., Nagarkatti M. (2013) MicroRNA let-7e is associated with the pathogenesis of experimental autoimmune encephalomyelitis. Eur. J. Immunol. 43, 104–114 [DOI] [PMC free article] [PubMed] [Google Scholar]
- 7. Singh N. P., Singh U. P., Guan H., Nagarkatti P., Nagarkatti M. (2012) Prenatal exposure to TCDD triggers significant modulation of microRNA expression profile in the thymus that affects consequent gene expression. PLoS One 7, e45054. [DOI] [PMC free article] [PubMed] [Google Scholar]
- 8. O'Connell R. M., Rao D. S., Chaudhuri A. A., Baltimore D. (2010) Physiological and pathological roles for microRNAs in the immune system. Nat. Rev. Immunol. 10, 111–122 [DOI] [PubMed] [Google Scholar]
- 9. Rossi R. L., Rossetti G., Wenandy L., Curti S., Ripamonti A., Bonnal R. J., Birolo R. S., Moro M., Crosti M. C., Gruarin P., Maglie S., Marabita F., Mascheroni D., Parente V., Comelli M., Trabucchi E., De Francesco R., Geginat J., Abrignani S., Pagani M. (2011) Distinct microRNA signatures in human lymphocyte subsets and enforcement of the naive state in CD4+ T cells by the microRNA miR-125b. Nat. Immunol. 12, 796–803 [DOI] [PubMed] [Google Scholar]
- 10. Neilson J. R., Zheng G. X., Burge C. B., Sharp P. A. (2007) Dynamic regulation of miRNA expression in ordered stages of cellular development. Genes Dev. 21, 578–589 [DOI] [PMC free article] [PubMed] [Google Scholar]
- 11. Kuchen S., Resch W., Yamane A., Kuo N., Li Z., Chakraborty T., Wei L., Laurence A., Yasuda T., Peng S., Hu-Li J., Lu K., Dubois W., Kitamura Y., Charles N., Sun H. W., Muljo S., Schwartzberg P. L., Paul W. E., O'Shea J., Rajewsky K., Casellas R. (2010) Regulation of microRNA expression and abundance during lymphopoiesis. Immunity 32, 828–839 [DOI] [PMC free article] [PubMed] [Google Scholar]
- 12. Monticelli S., Ansel K. M., Xiao C., Socci N. D., Krichevsky A. M., Thai T.-H., Rajewsky N., Marks D. S., Sander C., Rajewsky K., Rao A., Kosik K. S. (2005) MicroRNA profiling of the murine hematopoietic system. Genome Biol. 6, R71. [DOI] [PMC free article] [PubMed] [Google Scholar]
- 13. Waight J. D., Netherby C., Hensen M. L., Miller A., Hu Q., Liu S., Bogner P. N., Farren M. R., Lee K. P., Liu K., Abrams S. I. (2013) Myeloid-derived suppressor cell development is regulated by a STAT/IRF-8 axis. J. Clin. Invest. 123, 4464–4478 [DOI] [PMC free article] [PubMed] [Google Scholar]
- 14. Xia S., Sha H., Yang L., Ji Y., Ostrand-Rosenberg S., Qi L. (2011) Gr-1+ CD11b+ myeloid-derived suppressor cells suppress inflammation and promote insulin sensitivity in obesity. J. Biol. Chem. 286, 23591–23599 [DOI] [PMC free article] [PubMed] [Google Scholar]
- 15. Gabrilovich D. I., Nagaraj S. (2009) Myeloid-derived suppressor cells as regulators of the immune system. Nat. Rev. Immunol. 9, 162–174 [DOI] [PMC free article] [PubMed] [Google Scholar]
- 16. Ostrand-Rosenberg S., Sinha P. (2009) Myeloid-derived suppressor cells. Linking inflammation and cancer. J. Immunol. 182, 4499–4506 [DOI] [PMC free article] [PubMed] [Google Scholar]
- 17. Lees J. R., Azimzadeh A. M., Bromberg J. S. (2011) Myeloid derived suppressor cells in transplantation. Curr. Opin. Immunol. 23, 692–697 [DOI] [PubMed] [Google Scholar]
- 18. Bronte V., Serafini P., Mazzoni A., Segal D. M., Zanovello P. (2003) l-arginine metabolism in myeloid cells controls T-lymphocyte functions. Trends Immunol. 24, 302–306 [DOI] [PubMed] [Google Scholar]
- 19. Singh U. P., Singh N. P., Singh B., Hofseth L. J., Taub D. D., Price R. L., Nagarkatti M., Nagarkatti P. S. (2012) Role of resveratrol-induced CD11b+ Gr-1+ myeloid derived suppressor cells (MDSCs) in the reduction of CXCR3+ T cells and amelioration of chronic colitis in IL-10−/− mice. Brain Behav. Immun. 26, 72–82 [DOI] [PMC free article] [PubMed] [Google Scholar]
- 20. Rieder S. A., Nagarkatti P., Nagarkatti M. (2012) Multiple anti-inflammatory pathways triggered by resveratrol lead to amelioration of staphylococcal enterotoxin B-induced lung injury. Br. J. Pharmacol. 167, 1244–1258 [DOI] [PMC free article] [PubMed] [Google Scholar]
- 21. Guan H., Singh N. P., Singh U. P., Nagarkatti P. S., Nagarkatti M. (2012) Resveratrol prevents endothelial cells injury in high-dose interleukin-2 therapy against melanoma. PLoS One 7, e35650. [DOI] [PMC free article] [PubMed] [Google Scholar]
- 22. Hegde V. L., Nagarkatti M., Nagarkatti P. S. (2010) Cannabinoid receptor activation leads to massive mobilization of myeloid-derived suppressor cells with potent immunosuppressive properties. Eur. J. Immunol. 40, 3358–3371 [DOI] [PMC free article] [PubMed] [Google Scholar]
- 23. Hegde V. L., Nagarkatti P. S., Nagarkatti M. (2011) Role of myeloid-derived suppressor cells in amelioration of experimental autoimmune hepatitis following activation of TRPV1 receptors by cannabidiol. PLoS One 6, e18281. [DOI] [PMC free article] [PubMed] [Google Scholar]
- 24. Juhila J., Sipilä T., Icay K., Nicorici D., Ellonen P., Kallio A., Korpelainen E., Greco D., Hovatta I. (2011) MicroRNA expression profiling reveals miRNA families regulating specific biological pathways in mouse frontal cortex and hippocampus. PLoS One 6, e21495. [DOI] [PMC free article] [PubMed] [Google Scholar]
- 25. Kozomara A., Griffiths-Jones S. (2011) miRBase. Integrating microRNA annotation and deep-sequencing data. Nucleic Acids Res. 39, D152–D157 [DOI] [PMC free article] [PubMed] [Google Scholar]
- 26. Rehmsmeier M., Steffen P., Hochsmann M., Giegerich R. (2004) Fast and effective prediction of microRNA/target duplexes. RNA 10, 1507–1517 [DOI] [PMC free article] [PubMed] [Google Scholar]
- 27. Betel D., Koppal A., Agius P., Sander C., Leslie C. (2010) Comprehensive modeling of microRNA targets predicts functional non-conserved and non-canonical sites. Genome Biol. 11, R90. [DOI] [PMC free article] [PubMed] [Google Scholar]
- 28. Dweep H., Sticht C., Pandey P., Gretz N. (2011) miRWalk database. Prediction of possible miRNA binding sites by “walking” the genes of three genomes. J. Biomed. Inform. 44, 839–847 [DOI] [PubMed] [Google Scholar]
- 29. Xiao F., Zuo Z., Cai G., Kang S., Gao X., Li T. (2009) miRecords. An integrated resource for microRNA-target interactions. Nucleic Acids Res. 37, D105–D110 [DOI] [PMC free article] [PubMed] [Google Scholar]
- 30. Vergoulis T., Vlachos I. S., Alexiou P., Georgakilas G., Maragkakis M., Reczko M., Gerangelos S., Koziris N., Dalamagas T., Hatzigeorgiou A. G. (2012) TarBase 6.0. Capturing the exponential growth of miRNA targets with experimental support. Nucleic Acids Res. 40, D222–D229 [DOI] [PMC free article] [PubMed] [Google Scholar]
- 31. Kanehisa M., Goto S., Sato Y., Furumichi M., Tanabe M. (2012) KEGG for integration and interpretation of large-scale molecular data sets. Nucleic Acids Res. 40, D109–D114 [DOI] [PMC free article] [PubMed] [Google Scholar]
- 32. Cline M. S., Smoot M., Cerami E., Kuchinsky A., Landys N., Workman C., Christmas R., Avila-Campilo I., Creech M., Gross B., Hanspers K., Isserlin R., Kelley R., Killcoyne S., Lotia S., Maere S., Morris J., Ono K., Pavlovic V., Pico A. R., Vailaya A., Wang P.-L., Adler A., Conklin B. R., Hood L., Kuiper M., Sander C., Schmulevich I., Schwikowski B., Warner G. J., Ideker T., Bader G. D. (2007) Integration of biological networks and gene expression data using Cytoscape. Nat. Protoc. 2, 2366–2382 [DOI] [PMC free article] [PubMed] [Google Scholar]
- 33. Bindea G., Mlecnik B., Hackl H., Charoentong P., Tosolini M., Kirilovsky A., Fridman W.-H., Pagès F., Trajanoski Z., Galon J. (2009) ClueGO. A Cytoscape plug-in to decipher functionally grouped gene ontology and pathway annotation networks. Bioinformatics 25, 1091–1093 [DOI] [PMC free article] [PubMed] [Google Scholar]
- 34. Pang K. C., Frith M. C., Mattick J. S. (2006) Rapid evolution of noncoding RNAs. Lack of conservation does not mean lack of function. Trends Genet. 22, 1–5 [DOI] [PubMed] [Google Scholar]
- 35. Oh S. Y., Ju Y., Park H. (2009) A highly effective and long-lasting inhibition of miRNAs with PNA-based antisense oligonucleotides. Mol. Cells 28, 341–345 [DOI] [PubMed] [Google Scholar]
- 36. Fabbri E., Manicardi A., Tedeschi T., Sforza S., Bianchi N., Brognara E., Finotti A., Breveglieri G., Borgatti M., Corradini R., Marchelli R., Gambari R. (2011) Modulation of the biological activity of microRNA-210 with peptide nucleic acids (PNAs). ChemMedChem. 6, 2192–2202 [DOI] [PubMed] [Google Scholar]
- 37. Kusmartsev S., Gabrilovich D. I. (2002) Immature myeloid cells and cancer-associated immune suppression. Cancer Immunol. Immunother. 51, 293–298 [DOI] [PMC free article] [PubMed] [Google Scholar]
- 38. Bronte V., Apolloni E., Cabrelle A., Ronca R., Serafini P., Zamboni P., Restifo N. P., Zanovello P. (2000) Identification of a CD11b+/Gr-1+/CD31+ myeloid progenitor capable of activating or suppressing CD8+ T cells. Blood 96, 3838–3846 [PMC free article] [PubMed] [Google Scholar]
- 39. Delano M. J., Scumpia P. O., Weinstein J. S., Coco D., Nagaraj S., Kelly-Scumpia K. M., O'Malley K. A., Wynn J. L., Antonenko S., Al-Quran S. Z., Swan R., Chung C.-S., Atkinson M. A., Ramphal R., Gabrilovich D. I., Reeves W. H., Ayala A., Phillips J., Laface D., Heyworth P. G., Clare-Salzler M., Moldawer L. L. (2007) MyD88-dependent expansion of an immature GR-1+CD11b+ population induces T cell suppression and Th2 polarization in sepsis. J. Exp. Med. 204, 1463–1474 [DOI] [PMC free article] [PubMed] [Google Scholar]
- 40. Li Q., Pan P.-Y., Gu P., Xu D., Chen S.-H. (2004) Role of immature myeloid Gr-1+ cells in the development of antitumor immunity. Cancer Res. 64, 1130–1139 [DOI] [PubMed] [Google Scholar]
- 41. Goñi O., Alcaide P., Fresno M. (2002) Immunosuppression during acute Trypanosoma cruzi infection. Involvement of Ly6G (Gr1+)CD11b+ immature myeloid suppressor cells. Int. Immunol. 14, 1125–1134 [DOI] [PubMed] [Google Scholar]
- 42. Hock H., Hamblen M. J., Rooke H. M., Traver D., Bronson R. T., Cameron S., Orkin S. H. (2003) Intrinsic requirement for zinc finger transcription factor Gfi-1 in neutrophil differentiation. Immunity 18, 109–120 [DOI] [PubMed] [Google Scholar]
- 43. Haile L. A., von Wasielewski R., Gamrekelashvili J., Krüger C., Bachmann O., Westendorf A. M., Buer J., Liblau R., Manns M. P., Korangy F., Greten T. F. (2008) Myeloid-derived suppressor cells in inflammatory bowel disease. A new immunoregulatory pathway. Gastroenterology 135, 871–881, 881.e1–5 [DOI] [PubMed] [Google Scholar]
- 44. O'Connell R. M., Zhao J. L., Rao D. S. (2011) MicroRNA function in myeloid biology. Blood 118, 2960–2969 [DOI] [PMC free article] [PubMed] [Google Scholar]
- 45. Yang G., Yang L., Zhao Z., Wang J., Zhang X. (2012) Signature miRNAs involved in the innate immunity of invertebrates. PLoS One 7, e39015. [DOI] [PMC free article] [PubMed] [Google Scholar]
- 46. Arkins S., Rebeiz N., Brunke-Reese D. L., Minshall C., Kelley K. W. (1995) The colony-stimulating factors induce expression of insulin-like growth factor-I messenger ribonucleic acid during hematopoiesis. Endocrinology 136, 1153–1160 [DOI] [PubMed] [Google Scholar]
- 47. Vincent A. M., Feldman E. L. (2002) Control of cell survival by IGF signaling pathways. Growth Horm. IGF Res. 12, 193–197 [DOI] [PubMed] [Google Scholar]
- 48. Rosenbauer F., Tenen D. G. (2007) Transcription factors in myeloid development. Balancing differentiation with transformation. Nat. Rev. Immunol. 7, 105–117 [DOI] [PubMed] [Google Scholar]
- 49. Friedman A. D. (2002) Runx1, c-Myb, and C/EBPα couple differentiation to proliferation or growth arrest during hematopoiesis. J. Cell. Biochem. 86, 624–629 [DOI] [PubMed] [Google Scholar]
- 50. Sylvestre Y., De Guire V., Querido E., Mukhopadhyay U. K., Bourdeau V., Major F., Ferbeyre G., Chartrand P. (2007) An E2F/miR-20a autoregulatory feedback loop. J. Biol. Chem. 282, 2135–2143 [DOI] [PubMed] [Google Scholar]
- 51. Bueno M. J., Gómez deCedrón M., Laresgoiti U., Fernández-Piqueras J., Zubiaga A. M., Malumbres M. (2010) Multiple E2F-induced microRNAs prevent replicative stress in response to mitogenic signaling. Mol. Cell Biol. 30, 2983–2995 [DOI] [PMC free article] [PubMed] [Google Scholar]
- 52. Wang D., D'Costa J., Civin C. I., Friedman A. D. (2006) C/EBPα directs monocytic commitment of primary myeloid progenitors. Blood 108, 1223–1229 [DOI] [PMC free article] [PubMed] [Google Scholar]
- 53. Collins S. J., Ulmer J., Purton L. E., Darlington G. (2001) Multipotent hematopoietic cell lines derived from C/EBPα−/− knockout mice display granulocyte macrophage–colony-stimulating factor, granulocyte-colony-stimulating factor, and retinoic acid-induced granulocytic differentiation. Blood 98, 2382–2388 [DOI] [PubMed] [Google Scholar]
- 54. Zhang D. E., Zhang P., Wang N. D., Hetherington C. J., Darlington G. J., Tenen D. G. (1997) Absence of granulocyte colony-stimulating factor signaling and neutrophil development in CCAAT enhancer binding protein α-deficient mice. Proc. Natl. Acad. Sci. U.S.A. 94, 569–574 [DOI] [PMC free article] [PubMed] [Google Scholar]
- 55. Fukuchi Y., Shibata F., Ito M., Goto-Koshino Y., Sotomaru Y., Ito M., Kitamura T., Nakajima H. (2006) Comprehensive analysis of myeloid lineage conversion using mice expressing an inducible form of C/EBPα. EMBO J. 25, 3398–3410 [DOI] [PMC free article] [PubMed] [Google Scholar]
- 56. D'Alo' F., Johansen L. M., Nelson E. A., Radomska H. S., Evans E. K., Zhang P., Nerlov C., Tenen D. G. (2003) The amino terminal and E2F interaction domains are critical for C/EBPα-mediated induction of granulopoietic development of hematopoietic cells. Blood 102, 3163–3171 [DOI] [PubMed] [Google Scholar]
- 57. DeKoter R. P., Walsh J. C., Singh H. (1998) PU. 1 regulates both cytokine-dependent proliferation and differentiation of granulocyte/macrophage progenitors. EMBO J. 17, 4456–4468 [DOI] [PMC free article] [PubMed] [Google Scholar]
- 58. Porse B. T., Bryder D., Theilgaard-Mönch K., Hasemann M. S., Anderson K., Damgaard I., Jacobsen S. E., Nerlov C. (2005) Loss of C/EBPα cell cycle control increases myeloid progenitor proliferation and transforms the neutrophil granulocyte lineage. J. Exp. Med. 202, 85–96 [DOI] [PMC free article] [PubMed] [Google Scholar]
- 59. Liu Q., Zhang M., Jiang X., Zhang Z., Dai L., Min S., Wu X., He Q., Liu J., Zhang Y., Zhang Z., Yang R. (2011) miR-223 suppresses differentiation of tumor-induced CD11b+ Gr1+ myeloid-derived suppressor cells from bone marrow cells. Int. J. Cancer 129, 2662–2673 [DOI] [PubMed] [Google Scholar]
- 60. Johnnidis J. B., Harris M. H., Wheeler R. T., Stehling-Sun S., Lam M. H., Kirak O., Brummelkamp T. R., Fleming M. D., Camargo F. D. (2008) Regulation of progenitor cell proliferation and granulocyte function by microRNA-223. Nature 451, 1125–1129 [DOI] [PubMed] [Google Scholar]
- 61. Liu Y., Lai L., Chen Q., Song Y., Xu S., Ma F., Wang X., Wang J., Yu H., Cao X., Wang Q. (2012) MicroRNA-494 is required for the accumulation and functions of tumor-expanded myeloid-derived suppressor cells via targeting of PTEN. J. Immunol. 188, 5500–5510 [DOI] [PubMed] [Google Scholar]
- 62. Zhang M., Liu Q., Mi S., Liang X., Zhang Z., Su X., Liu J., Chen Y., Wang M., Zhang Y., Guo F., Zhang Z., Yang R. (2011) Both miR-17-5p and miR-20a alleviate suppressive potential of myeloid-derived suppressor cells by modulating STAT3 expression. J. Immunol. 186, 4716–4724 [DOI] [PubMed] [Google Scholar]
- 63. Sinha P., Okoro C., Foell D., Freeze H. H., Ostrand-Rosenberg S., Srikrishna G. (2008) Proinflammatory S100 proteins regulate the accumulation of myeloid-derived suppressor cells. J. Immunol. 181, 4666–4675 [DOI] [PMC free article] [PubMed] [Google Scholar]
- 64. Xiang X., Poliakov A., Liu C., Liu Y., Deng Z. B., Wang J., Cheng Z., Shah S. V., Wang G.-J., Zhang L., Grizzle W. E., Mobley J., Zhang H.-G. (2009) Induction of myeloid-derived suppressor cells by tumor exosomes. Int. J. Cancer 124, 2621–2633 [DOI] [PMC free article] [PubMed] [Google Scholar]
- 65. Obermajer N., Muthuswamy R., Odunsi K., Edwards R. P., Kalinski P. (2011) PGE2-induced CXCL12 production and CXCR4 expression controls the accumulation of human MDSCs in ovarian cancer environment. Cancer Res. 71, 7463–7470 [DOI] [PMC free article] [PubMed] [Google Scholar]


