Background: The role for proteinase-activated receptor (PAR)-2 in the pathogenesis of renal fibrosis is not previously described.
Results: PAR2−/− mice displayed attenuated renal fibrosis in vivo. PAR2 transactivation of EGF and TGFβ receptor signaling pathways induced Smad2 phosphorylation and connective tissue growth factor gene expression.
Conclusion: PAR2 activation results in profibrotic signaling and gene expression.
Significance: PAR2 represents a potential therapeutic target for chronic kidney disease.
Keywords: Epidermal Growth Factor Receptor (EGFR), Fibrosis, Kidney, Receptors, Transforming Growth Factor β (TGFβ), PAR2
Abstract
Chronic kidney diseases cause significant morbidity and mortality in the population. During renal injury, kidney-localized proteinases can signal by cleaving and activating proteinase-activated receptor-2 (PAR2), a G-protein-coupled receptor involved in inflammation and fibrosis that is highly expressed in renal tubular cells. Following unilateral ureteric obstruction, PAR2-deficient mice displayed reduced renal tubular injury, fibrosis, collagen synthesis, connective tissue growth factor (CTGF), and α-smooth muscle actin gene expression at 7 days, compared with wild-type controls. In human proximal tubular epithelial cells in vitro, PAR2 stimulation with PAR2-activating peptide (PAR2-AP) alone significantly up-regulated the expression of CTGF, a potent profibrotic cytokine. The induction of CTGF by PAR2-AP was synergistically increased when combined with transforming growth factor-β (TGF-β). Consistent with these findings, treating human proximal tubular epithelial cells with PAR2-AP induced Smad2/3 phosphorylation in the canonical TGF-β signaling pathway. The Smad2 phosphorylation and CTGF induction required signaling via both the TGFβ-receptor and EGF receptor suggesting that PAR2 utilizes transactivation mechanisms to initiate fibrogenic signaling. Taken together, our data support the hypothesis that PAR2 synergizes with the TGFβ signaling pathway to contribute to renal injury and fibrosis.
Introduction
Regardless of the underlying etiology, progressive renal fibrosis is a final common manifestation of all chronic kidney diseases that eventually leads to end-stage renal failure (1). Renal fibrosis is characterized by excessive infiltration of inflammatory cells, increased proliferation of fibroblasts, deposition and accumulation of extracellular matrix proteins (e.g. collagens), tubular atrophy, and microvasculature peritubular rarefaction (2). Despite the many therapeutic interventions that have been suggested, our current understanding of the pathogenic mechanisms of renal fibrosis is limited and effective therapy is not yet available.
There is extensive evidence that proteinases play an important role in the pathogenesis of tissue fibrosis. A pro-fibrotic role has been suggested for metalloproteinases, collagenases, and plasminogen activators all of which can degrade extracellular matrix components such as collagen IV, the major constituent of basement membrane (3). Beyond their digestive role, serine proteinases have now been identified as hormone-like molecules that can initiate cellular signaling by cleaving and activating proteinase-activated receptors (PARs),3 which belong to a unique family of G-protein-coupled receptors. Serine proteinase such as trypsin can activate PARs proteolytically via cleavage within the extracellular N terminus of each receptor to unmask a unique “tethered ligand sequence” that triggers signaling by binding to the extracellular domains of the receptors. This event induces a conformational change of the receptor to initiate cell signaling (4).
PAR2, recognized as playing a key role in inflammation, is widely expressed on many cell types of the gastrointestinal tract, skin, lung, and kidney, including smooth muscle cells, endothelium, epithelium, and fibroblasts (5, 6). PAR2 expression is up-regulated during inflammation in many organs, including the colon, airway, and joints and PAR2 activation leads to pronounced inflammatory responses in a variety of cells and tissues. For example, intraluminal administration of PAR2 agonists in wild-type mice induces colonic inflammation (7), whereas PAR2-deficient mice exhibited a reduced and delayed inflammatory response in a disease model of colitis (8). In the kidney, PAR2 is abundantly expressed in the proximal tubular cells of renal cortex, and renal PAR2 activation is associated with changes in renal hemodynamics, ion secretion, and inflammation (9, 10). Studies have also indicated a proinflammatory role for PAR2 in the kidney, as receptor stimulation with PAR2-AP was found to augment MCP-1 production in human proximal tubular cell cultures (11).
In addition to the inflammatory responses stimulated by PAR2, a role for PAR2 has been identified in tissue fibrosis. A recent study showed that PAR2 deficiency protected liver from the progression of fibrosis. A PAR2 agonist had a profibrogenic effect on hepatic stellate cells suggesting that PAR2 activation augments TGFβ and other profibrotic genes, which in turn promote hepatic fibrosis in both in vivo and in vitro (12). In addition, an important role for PAR2 has been suggested in pulmonary fibrosis in vivo and fibroblast proliferation in vitro (13, 14). Together, these data suggest that PAR2 plays a role in chronic organ injury through the activation of proinflammatory and fibrogenic pathways.
Given these effects on inflammation and fibrosis, it is likely that PAR2 plays a significant role in the pathogenesis of numerous diseases, including chronic kidney disease. Given the abundant PAR2 expression in the kidney and emerging reports for the involvement of PAR2 in tissue fibrosis, we hypothesized that PAR2 plays a role in renal injury and fibrosis. To test this hypothesis, we studied the progression of fibrosis in a murine unilateral ureteral obstruction (UUO) model using both wild-type and PAR2-deficient mice. Additionally, using cultured primary human kidney-derived proximal tubular epithelial cells, we examined the mechanism of PAR2 signaling that regulates fibrosis and the production of the profibrotic cytokine, connective tissue growth factor (CTGF).
EXPERIMENTAL PROCEDURES
Animal Studies
Wild-type and PAR-2 (F2rl1)-deficient mice (a gift from Johnson & Johnson Pharmaceutical Research & Development) on a C57BL/6 background were generated from our in-house breeding colony (15). Male mice age 8–12 weeks were subjected to unilateral ureteric obstruction surgery or sham surgery as described previously (16). Renal function remains normal in these mice due to compensation from the contralateral kidney. All experiments were performed under the guidelines set forth by the University of Calgary Animal Care Committee. In brief, mice were anesthetized using an intra-peritoneal injection of a mixture of ketamine (125 mg/kg) and xylazine (12.5 mg/kg), and a small abdominal midline incision was made under sterile conditions. The left ureter was ligated using 4-0 silk sutures and the mice were allowed to recover under analgesia, with the provision of standard food and water for the duration of the experiment. Animals were sacrificed at 7 and 14 days and both obstructed and unobstructed kidneys were harvested for further analysis.
Tissue Analysis
To determine morphologic renal tissue damage and fibrosis, paraffin-embedded kidney tissues were sectioned and stained with hematoxylin and eosin (H & E), Masson trichrome, and picrosirius red using standard protocols. The sections in the kidney cortex area were randomly imaged with a Qcolor5 Olympus camera attached to an Olympus BX51 light microscopy using a ×10, ×20, and ×40 objective lenses and its accompanying software, QCapturePro 6.0. Five high-resolution images of the renal cortex were randomly captured and image analysis was done using the Volocity software. Morphometric analysis of the damaged tubular area in H & E-stained slides was quantified by measuring the area of intact non-injured tubules normalized to the total area of the tissue section surveyed. Fibrosis area identified in the in Masson trichrome-stained slides was quantified by counting total blue pixels normalized to the total area of the tissue section surveyed. Pixel values from the images were averaged to yield a final value expressed as a percentage relative to the total area analyzed. To evaluate renal type I collagen expression, red-yellow birefringence pattern of collagen fibers in the obstructed kidneys were captured from the picrosirius red-stained tissue using an Olympus polarized microscope. Collagen I was quantified by counting total birefringent pixels normalized to the total area of the tissue sections as described above.
Immunofluorescence
Paraffin-embedded kidney sections were deparaffinized and blocked with 0.2% gelatin in PBS. The tissue sections were incubated with mouse anti-α-smooth muscle actin (SMA) (1:100, Sigma) followed by washing and incubation with Alexa 488-labeled anti-mouse IgG. After further washing, the sections were blocked in Sudan Black B (0.1% in 70% EtOH) for 25 min to reduce tissue autofluorescence. The sections were then mounted with ProLongGold antifade reagent in the presence of DAPI (Sigma). The expression and localization of α-SMA in the renal tissue was detected using an Olympus FV1000 confocal system on an Olympus IX-70 microscope with the Fluoview system software (Olympus). Images shown are representative of tissue sections in different groups.
Collagen Assay
Acid and pepsin-soluble collagens in UUO-induced kidney samples were assayed and compared with control kidney samples using a Sircol collagen assay kit (Biocolor Life Science) according to the manufacturer's protocol. In brief, air-dried samples were weighed and diced in 0.5 m acetic acid containing 0.1 mg/ml of pepsin overnight. After adding acid neutralizing reagent, non-dissolved or non-digested tissue was removed by centrifugation at 12,000 × g for 10 min. 100 μl of this solution was allowed to mix with 1 ml of Sircol dye reagent for 30 min on a gentle shaker. Unbound dye was carefully removed by a repeated addition of acid-salt wash reagent and centrifugation. Bound dye was dissolved in alkali solution, and absorbance at 535 mm was measured against collagen standard concentrations. Collagen values were normalized to kidney dry weight.
Cell Culture Studies
Primary human proximal tubular epithelial cells (HPTCs) were isolated from surgical nephrectomy tissue as described previously (17). In summary, normal cortex segments of the nephrectomy samples from adults with renal carcinomas were finely dissected, minced, digested with collagenase IV (Worthington), and passed through a 75-μm mesh. The filtrate was then centrifuged and the resulting pellet was rinsed three times by centrifugation with fresh Hank's isotonic balanced salt solution, pH 7.4. The final pellet was then re-suspended in Dulbecco's modified Eagle's medium/F-12 (Invitrogen) containing 1% fetal bovine serum (FBS) (Sigma), 1% penicillin-streptomycin, 125 ng/ml of prostaglandin E1 (Sigma), 25 ng/ml of epidermal growth factor (EGF, Sigma), 1.8 μg/ml of l-thyroxine (Sigma), 3.38 ng/ml of hydrocortisone (Sigma), and 5 μg/ml of insulin, 5 μg/ml of transferrin, and 5 ng/ml of sodium selenite (Sigma). HPTCs were established on a substratum of type IV collagen (human placenta, Sigma) and used at passage <3 to ensure epithelial phenotype in all experiments. All studies with human tissues were conducted with the approval of the Conjoint Health Research Ethics Board at the University of Calgary.
To evaluate the ability of PAR2 to induce a pro-fibrogenic mediator, CTGF, 90% confluent HPTCs grown on a collagen-coated 24-well plates were stimulated with either PAR-2-activating peptide (PAR-AP) SLIGRL-NH2 (100 μm) or 2f-LIGRLO-NH2 (2f-LI, 15 μm), in the presence or absence of TGFβ1 (2.5 ng/ml) for 24 h. Control PAR2-inactive reverse-sequence peptides sequences corresponding to the PAR2-activating peptides were also used. Additionally, 1 μm amastatin (Sigma) was also added to the buffer to prevent peptide degradation from aminopeptidase that might be secreted by the HPTC. To evaluate the ability of PAR2 to phosphorylate p42/44 MAP kinase (MAPK), R-Smads or phosphatidylinositide 3-kinase (PI3K), HTPC were serum-starved for 24 h and stimulated with 2f-LI (15 μm), in presence or absence of TGFβ1 (2.5 ng/ml) for 5, 15, 30, and 60 min.
To evaluate signaling pathways involved in PAR2-mediated CTGF induction, selective inhibitors were preincubated prior to PAR2 activation. HPTCs were pretreated with inhibitors of TGFβ receptor I (SB431542, 10 μm, Sigma), a broad-spectrum matrix metalloproteinase (marimastat, 5 μm, Tocris), MEK1 (UO126, 10 μm, Sigma), EGF receptor kinase (AG1478, 1 μm, Sigma), or PI3K (LY294002, 20 μm, Sigma) for 1 h. To evaluate the impact of inhibitors in Smad2 and p42/44 MAPK phosphorylation, HPTCs were serum starved for 24 h before inhibitor incubation.
Real-time and Semi-quantitative PCR
Semi-quantitative reverse transcription-PCR (RT-PCR) was performed to the mRNA assess expression of PAR family members (PARs 1 to 4). Total RNA was extracted from HPTC using an RNAeasy kit (Qiagen) according to the manufacturer's protocol. The purified RNA was reverse transcribed to cDNA using the Omniscript RT kit (Qiagen) according to the manufacturer's protocol. Following reverse transcription, routine PCR was performed to amplify all PAR members. Primer sequences used in our experiments were as follows: β-actin (forward primer, 5′-CGT GGG CCG CCC TAG GCA CCA-3′, reverse primer, 5′-TTG GCC TTA GGG TTC AGG GGG-3′, product size 237 bp), PAR1 (F2R) (forward primer, 5′-CAC GGA TCC TAT TTT TCC GGC AGT GAT TGG-3′, reverse primer, 5′-CAG GAA TTC TCA AAT GAT AGA CAC ATA ACA GAC CCT-3′, product size 450 bp), PAR2 (F2LR1) (forward primer, 5′-TGA AGA TTG CCT ATC ACA TAC-3′, reverse primer, 5′-GGC TCT TAA TCA GAA AAT AAT GCA-3′, product size 550 bp), PAR3 (F2LR2) (forward primer, 5′-TCC CCT TTT CTG CCT TGG AAG-3′, reverse primer, 5′-AAA CTG TTG CCC ACA CCA GTC CAC-3′, product size 500 bp), PAR4 (F2LR3) (forward primer, 5′-GGC AAC CTC TAT GGT GCC TA-3′, reverse primer, 5′-TTC GAC CCA GTA CAG CCT TC-3′, product size 351 bp). Thermal cycling was performed in a GeneAmp PCR 2400 thermal cycler (PerkinElmer Life Sciences). For the analysis of gene expression in vivo, total kidney RNA was extracted and reverse transcribed to cDNA as described. Real-time PCR was performed to assess Ctgf and Tgfβ1 mRNA expression. In brief, cDNA was mixed with 2× TaqMAN Universal PCR Master Mix (Applied Biosystems) and 900 nm pre-designed primers and 200 nm probe. PCR were performed using a StepOnePlus Real-time PCR System (Applied Biosystems). The sequences for primers and probes designed using Genescript software were as follows: Ctgf (forward primer, 5′-GAG TGT GCA CTG CCA AAG AT-3, reverse primer, 5′-GGC AAG TGC ATT GGT ATT TG-3′, probe 6-FAM-5′-CGC AGC GGT GAG TCC TTC CA-3′-MGB, product size 102 bp) and Tgfb1 (forward primer, 5′-GCC CTT CCT GCT CCT CAT-3′; reverse primer, 5′-GCC CTT CCT GCT CCT CAT-3′; probe 6-FAM-5′-AAA GGG CCC AGC ACC TGC AC-3′-MGB, product size 107). Mouse 18S-FAM/MGB probe (Applied Biosystems) was used as the endogenous control. Fold-change for each gene was normalized to 18 S and compared with gene expression in contralateral kidneys. All assays were performed in triplicate.
Calcium Signaling
A monolayer of 90% confluent HPTCs were detached from the plate by trypsin-free EDTA and these cells were incubated for 30 min with Fluo-4 AM-No wash calcium indicator solution (Invitrogen) as previously described (18). Measurements of intracellular Ca2+ ion concentration were done with suspensions of the Fluo-4-AM-loaded cells as described elsewhere (19) using a fluorescence excitation wavelength of 480 nm and emission wavelength of 530 nm with an Aminco Bowman Series 2 luminescence spectrophotometer (Thermo Life Science). The fluorescence change caused by addition of agonists was measured and quantified as a percentage, relative to the signal generated by 2 μm A23187 (Sigma) (19). We selected SLIGRL-NH2 (100 μm) and 2f-LI (15 μm) as the main PAR2 agonists for our studies (>95% purity verified by HPLC and mass spectral analysis).
Immunoblotting
Protein samples extracted from either mouse kidney tissue or from cultured HPTC were denatured and separated by electrophoresis on SDS-polyacrylamide gels followed by protein transfer to nitrocellulose membranes. Membranes were blocked at room temperature for 1 h in 5% milk proteins in PBS containing 0.01% Tween 20 (PBST). Primary antibodies in PBST were applied to the membrane and incubated at 4 °C overnight. Primary antibodies are as follows: polyclonal anti-rabbit phospho-Smad2 and -3 (1:1000, Santa Cruz Biotechnology), anti-goat CTGF (1:500, Santa Cruz Biotechnology), anti-rabbit phospho-p42/44 (1:1000, Cell Signaling), anti-rabbit phospho-Akt (1:1000, Cell Signaling), anti-rabbit GAPDH (1:1000, Cell Signaling), anti-mouse β-tubulin (1:1000, Sigma), anti-mouse αSMA (1:1000, Sigma), and anti-mouse E-cadherin (1:1000, BD Bioscience). The blots were washed for 1 h at room temperature in PBST and then incubated with an appropriate secondary antibody coupled to horseradish peroxidase for 1 h in 5% milk proteins PBST, followed by 3–4 additional washes in PBST. The HRP-antibody signal was visualized using ECL Immunoblotting detection reagents (GE Healthcare). The intensities of the protein bands were quantified using Image J software. Western blot signals were normalized relative to the image of appropriate control samples. Results of a minimum of three independent Western blot analyses were averaged and pooled to yield the data shown in the histograms.
Statistical Analysis
Figures and statistical analyses were compiled using GraphPad Prism version 5.0 software. All in vitro studies were performed at least in triplicate and the data are represented as mean ± S.E. Multiple groups were compared using one-way analysis of variance with Dunn's multiple comparison tests of groups. Statistical comparisons between two groups were made with unpaired t tests. p < 0.05 was considered statistically significant in all studies.
RESULTS
PAR2 Deficiency Attenuates Tubular Injury and Fibrosis
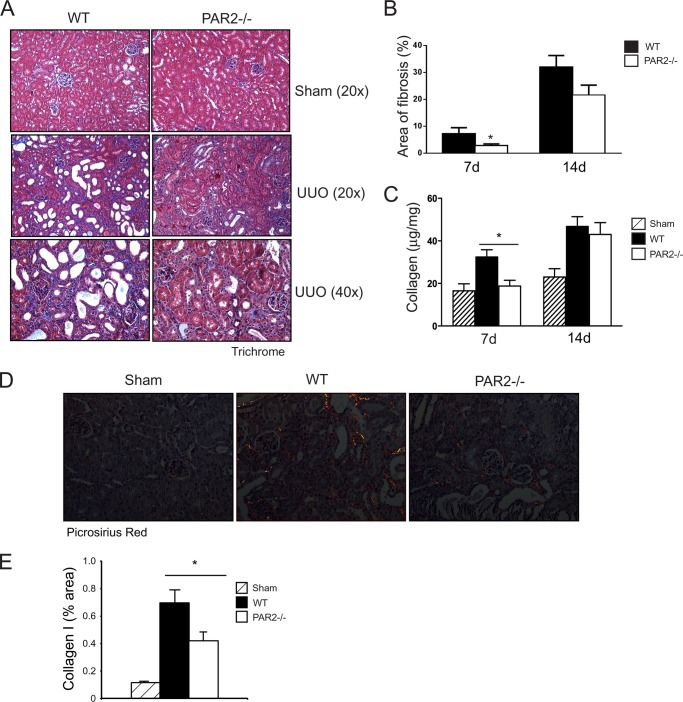
Given that PAR2 is highly expressed in the renal epithelium (11), we first assessed the impact of PAR2 on renal injury induced by UUO in wild-type versus PAR2-deficient mice. The levels of tubular injury and newly synthesized collagens were quantitatively analyzed in obstructed and non-obstructed control kidneys. Although renal histopathology was normal in both sham-operated wild-type and PAR2-deficient mice, sections from the obstructed kidneys from the wild-type mice showed an increase in morphologic tubular and interstitial injury (Fig. 1A). Strikingly, at day 7, kidney tissue from the PAR2-deficient mice showed a significant reduction in tubular injury compared with the wild-type mice (Fig. 1B). The reduction in tubular damage in the obstructed kidneys of PAR2-deficient mice was associated with decreased tissue fibrosis and collagen synthesis approaching levels observed in control sham-operated animals. Analysis of Masson trichrome and picrosirius red-stained sections specific for type I collagen revealed a significantly lower amount of fibrosis in the PAR2-deficient mice post UUO (Fig. 2, A–E). Similarly, total acid and pepsin-soluble collagens were reduced in obstructed PAR2 kidneys compared with wild-type controls as determined by Sircol collagen assay (Fig. 2C). Myofibroblast proliferation is a major component of renal fibrosis in the kidney. Consistent with the pathological findings, PAR2-deficient mice demonstrated substantially lower expression of the myofibroblast marker α-SMA in the obstructed kidneys at 7 days compared with wild-type controls (Fig. 3, A and B). Immunofluorescence staining of kidney sections revealed increased accumulation of α-SMA within tubular borders and interstitial areas in the wild-type compared with PAR2-deficient mice (Fig. 3C). Consistent with the reduced fibrosis, PAR2-deficient mice also displayed higher levels of E-cadherin, an epithelial (tubular) marker in the kidney and reduced tissue Smad2 phosphorylation (Fig. 4, A and B). Ctgf and Tgfb1 mRNA expression as determined by real time PCR was also reduced in PAR2-deficient mice compared with controls (Fig. 4, C and D). Although PAR2-deficient mice displayed a substantially improved phenotype at 7 days post-UUO, by day 14 differences in renal injury and the pathologic profiles between the wild-type and PAR2-deficient kidneys were no longer statistically significant. Taken together, these data indicate that PAR2 contributes to the early progression of renal fibrosis and extracellular matrix production during renal injury following UUO.
FIGURE 1.
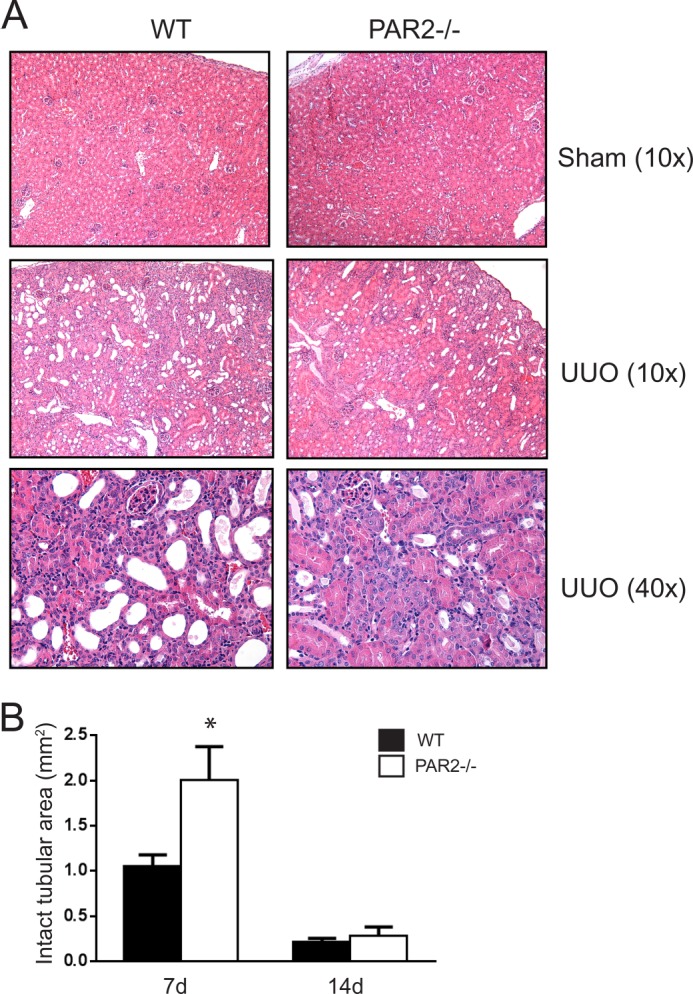
UUO-induced kidney injury in wild-type and PAR2−/− mice. A, representative histopathology images (H & E staining) for each group at day 7 post-UUO. B, histogram showing quantification of morphologically intact tubular areas in PAR2−/− and wild-type mice at days 7 and 14 post-UUO (mean ± S.E.; *, p < 0.05, n = 4 - 8).
FIGURE 2.
UUO-induced renal fibrosis in wild-type and PAR2−/− mice. A, representative histopathology images (Masson trichrome staining) for each group at day 7 post-UUO. B, histogram showing quantification fibrotic (blue) areas in wild-type and PAR2−/− mice at days 7 and 14 post-UUO (mean ± S.E.; *, p < 0.05, n = 4–8). C, histogram showing quantification of pepsin and acid-soluble collagens measured by collagen assay in the UUO-induced kidneys for each group (mean ± S.E.; *, p < 0.05, n = 4–8). D, representative images showing red/yellow birefriengence specific for type I collagen deposition in kidney sections for each group stained with picrosirius red at day 7 post-UUO. E, histogram showing quantification of birefringent type I collagen expression normalized to tissue area as percentage in each group (mean ± S.E.; *, p < 0.05, n = 8).
FIGURE 3.
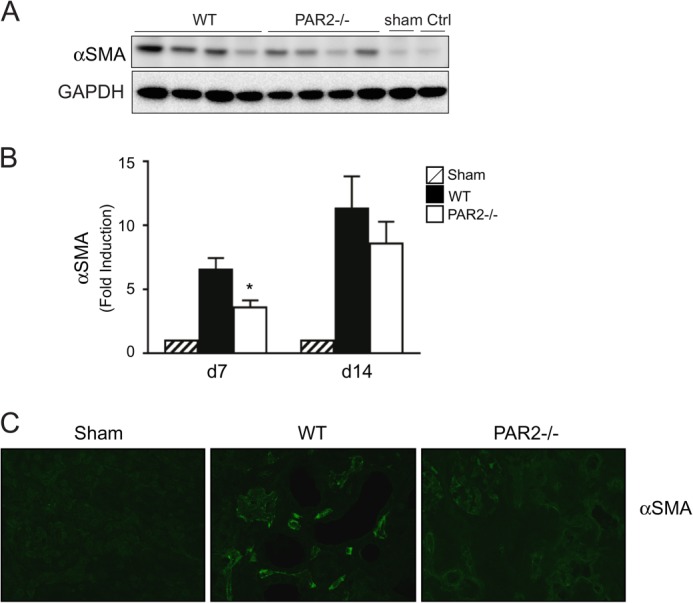
α-SMA expression in UUO-induced kidney injury. A, immunoblotting for α-SMA expression in kidneys from obstructed wild-type and PAR2−/−, at day 7 post-UUO. Sham operated and contralateral kidneys are used as controls. B, histogram showing densitometry analysis of α-SMA expression normalized to GAPDH in wild type or PAR2−/− kidneys at days 7 and 14 post-UUO (mean ± S.E.; *, p < 0.05, n = 4–8). C, representative image showing kidney α-SMA expression detected by immunofluorescence for each group at day 7 post-UUO.
FIGURE 4.
Fibrosis markers in UUO-induced kidney injury. A, immunoblotting for E-cadherin expression and Smad2 phosphorylation in the wild-type and PAR2−/− kidneys at day 7 post-UUO. B, histogram showing the relative expression of E-cadherin in the UUO-induced kidney injury in each group (mean ± S.E.; *, p < 0.05, n = 8). C, mRNA expression assessed by quantitative real-time PCR for Ctgf and D, Tgfb1 in the UUO-induced kidney injury at day 7 in the wild-type and PAR2−/− mice (fold-change over contralateral kidney, mean ± S.E.; *, p < 0.05; **, p < 0.01, n = 8).
HPTC Express Functional PAR2
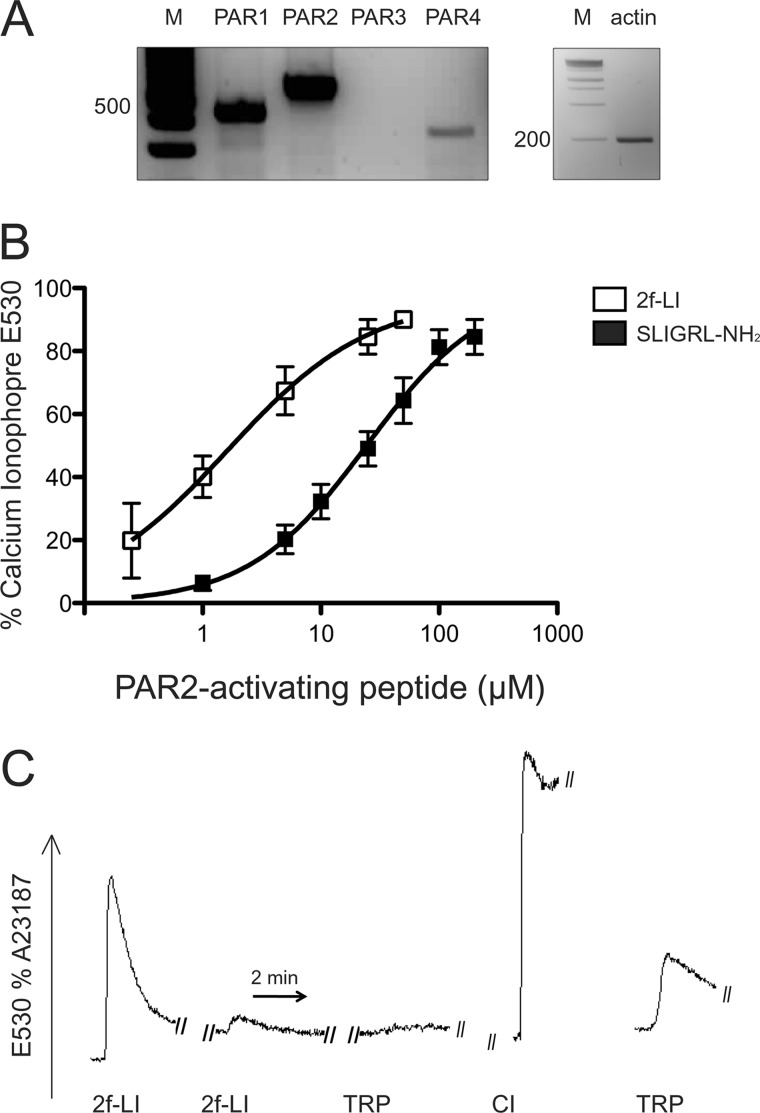
To characterize the mechanism by which PAR2 contributes to renal fibrosis in vivo, experiments were next performed in vitro. Because tubular epithelial cells are the most abundant cell type in the kidney and contribute substantially to progressive renal fibrosis, HPTC were used for subsequent experiments. Given that HPTC are primary cultures, the mRNA expression of PAR2 and other PAR family members was confirmed by RT-PCR. PAR2-dependent calcium signaling was also determined by analysis of internal calcium mobilization that occurs through coupling of PARs to Gq. HPTC strongly expressed PAR1 and PAR2, but not PAR3, whereas the PAR4 expression signal was relatively weaker (Fig. 5A). In the calcium signaling assay, the PAR2-selective activating peptides SLIGRL-NH2 (EC50 = 25 μm) and 2f-LI (EC50 = 2.5 μm) induced a rapid transient calcium mobilization in a concentration-dependent manner (Fig. 5B). We also tested the ability of mast cell tryptase, a hallmark of tissue fibrosis and PAR2 agonist (20), to regulate PAR2. Cells challenged with tryptase (4 units/ml) induced changes in calcium mobilization that were equivalent to about 25% of the maximum calcium response caused by the PAR2-APs (Fig. 5C). A sequential addition of 2f-LI (25 μm) that desensitized the PAR2 calcium response also abolished the response to tryptase but not to PAR1 activation (Fig. 5C and data not shown), demonstrating pharmacologically that tryptase activates PAR2 in HPTCs. Together, these results show that PAR2 is expressed and functionally active in primary HPTC cultures and susceptible to activation by a PAR2-activating enzyme known to be present in fibrotic renal tissue.
FIGURE 5.
Functional expression of PAR2 in HPTC. A, PAR (1, 2, and 4) (F2R, F2RL1, and F2RL3) mRNA expression detected by reverse transcriptase PCR in HPTC (m = marker). B, change in intracellular calcium mobilization in response to different concentrations of PAR2-activating peptides, SLIGRL-NH2, and 2f-LI in HPTCs. Cells were loaded with Fluo-4 AM-NW and exposed to PAR2-AP. Change in internal calcium is expressed as a percentage of the maximum response generated by calcium ionophore (mean ± S.E., n = 3). C, representative image showing the mobilization of internal calcium by mast cell tryptase via PAR2 activation. Cells were loaded with Fluo-4 AM-NW and challenged by two sequential additions of 2f-LI (25 μm) to desensitize PAR2 and followed by mast cell tryptase (4 units/ml). The right-hand tracing showing the response of untreated cells to mast cell tryptase without prior exposure to 2f-LI (2f-LI = 2f-LIGRLO-NH2; TRP, mast cell tryptase; CI, calcium ionophore).
PAR2 Synergizes with TGFβ to Augment CTGF Production in HPTCs
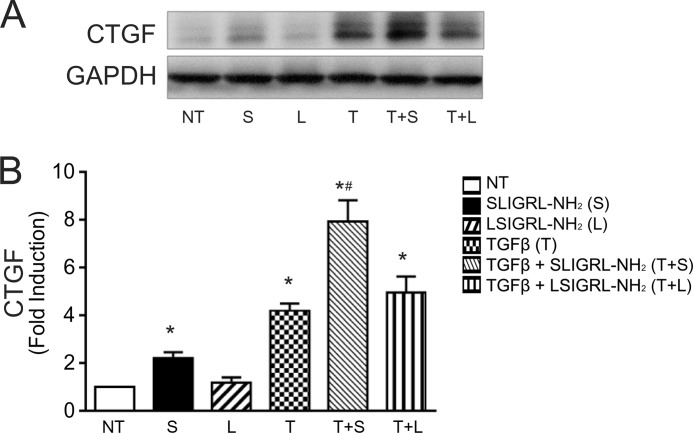
The prior experiments confirmed HPTC as a suitable cell model to study PAR2-mediated signaling. Next, the impact of PAR2 on the fibrogenic phenotype in HPTC was examined. HPTC were stimulated with TGFβ1 alone or in combination with PAR2-activating peptide and the expression of CTGF (also designated CCN2), a TGFβ-regulated gene and mediator of fibrosis, was biochemically measured. To ensure selective PAR2 targeting, we used both PAR2-selective receptor-activating peptides, 2f-LI and SLIGRL-NH2, interchangeably. We found that PAR2 activation by SLIGRL-NH2 (100 μm) acting on its own was sufficient to increase CTGF levels ∼2-fold relative to control, whereas the reverse-sequence PAR2-inactive control peptide had no effect (Fig. 6A). As expected, TGFβ1 (2.5 ng/ml) alone increased CTGF levels (by ∼3.9-fold). Surprisingly, PAR2 activation when combined with TGFβ1 augmented CTGF production in a synergistic manner, the combined effect of the two agonists being more than additive (Fig. 6B).
FIGURE 6.
CTGF up-regulation by PAR2 activation in HPTC. A, immunoblotting for CTGF in HPTC following treatment with SLIGRL-NH2 (100 μm) in the presence or absence of TGFβ1 (2.5 ng/ml) for 24 h. PAR2 inactive peptide (LSIGRL-NH2, 100 μm) was used as a control. B, histogram showing densitometry analysis of CTGF expression normalized to GAPDH (NT, no treatment; S, SLIGRL-NH2; L, LSIGRL-NH2; T, TGFβ) (mean ± S.E.; treatment group versus no treatment, *, p < 0.05; SLIGRL-NH2 versus TGFβ + SLIGRL-NH2, #, p < 0.05, n = 3).
PAR2 Activates the Smad Pathway by TGFβ Receptor Transactivation
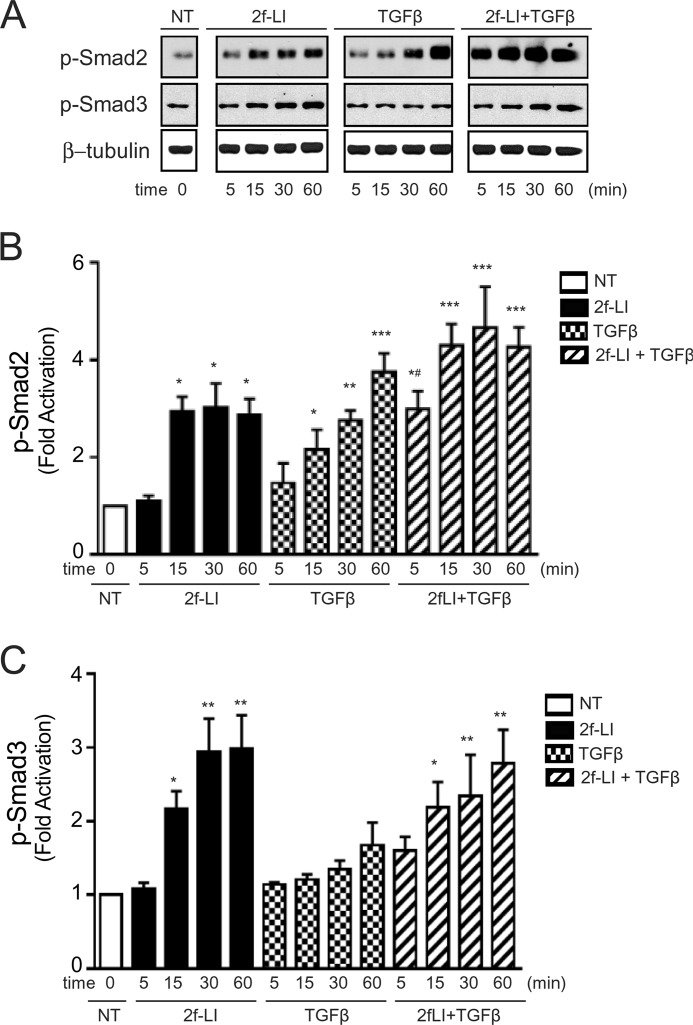
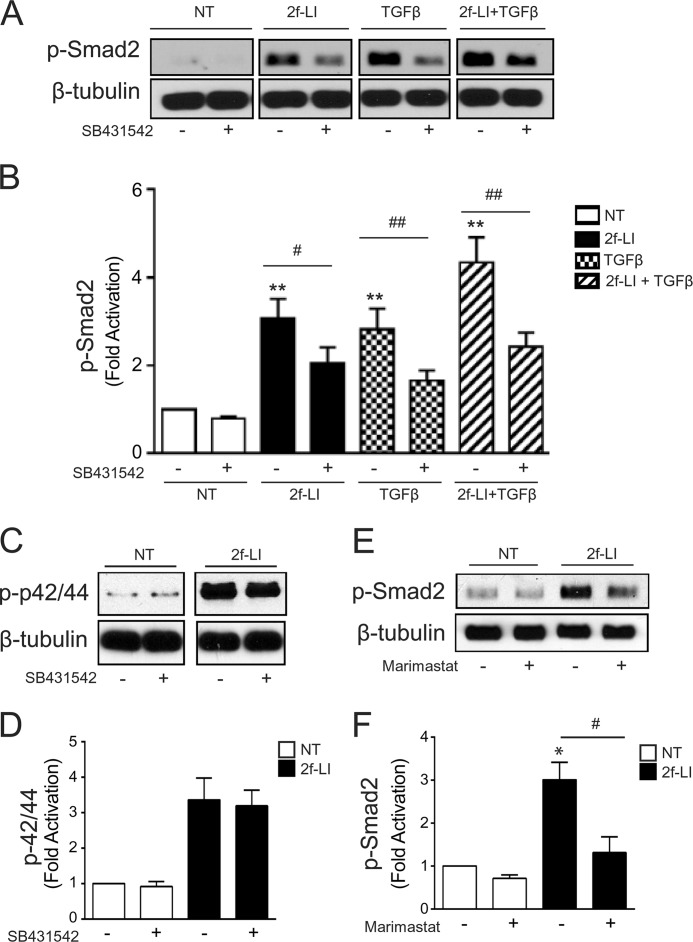
Smad pathways are critically involved in TGFβ-mediated CTGF induction (21). Consistent with these observations, PAR2 activation alone by 2f-LI (15 μm) triggered the phosphorylation of both Smad2 and -3 over a 60-min time course (Fig. 7, A–C). When 2f-LI was combined with TGFβ1, a greater Smad2 phosphorylation was observed at early time points. To investigate this mechanism further, we measured PAR2-mediated Smad phosphorylation after pre-treating HPTCs with the potent and selective TGFβ receptor (TGFβR) subunit I inhibitor, SB431542 (10 μm). Preincubation of HPTCs with SB431542 diminished PAR2-mediated Smad2 phosphorylation at 30 min (Fig. 8, A and B). However, SB431542 did not interfere entirely with PAR2-mediated signaling, because p42/44 MAPK phosphorylation induced by 2f-LI was not affected (Fig. 8, C and D). Therefore, PAR2 activates Smad2 phosphorylation via a mechanism that involves the TGFβRI.
FIGURE 7.
PAR2-induced Smad2/3 phosphorylation in HPTCs. A, immunoblotting for Smad2 and Smad3 phosphorylation in HPTC. Cells were treated with 2f-LI (15 μm), TGFβ1 (2.5 ng/ml), or both for 5, 15, 30, and 60 min (NT, no treatment). B, histograms showing densitometry analysis and quantification of PAR2-induced Smad2 and C, Smad3 phosphorylation normalized to β-tubulin (all panels mean ± S.E.; treatment versus NT, *, p < 0.05; **, p < 0.01; ***, p < 0.001; 2f-LI or TGFβ versus 2f-LI + TGFβ at 5 min, #, p < 0.05, n = 3).
FIGURE 8.
Transactivation of the TGFβR by PAR2. A, immunoblotting for Smad2 phosphorylation following stimulation with 2f-LI and/or TGFβ1 (2.5 ng/ml) for 30 min in the presence or absence of the TGFβRI inhibitor, SB431542 (10 μm) (NT, no treatment). B, histogram showing densitometry analysis and quantification of Smad2 phosphorylation (mean ± S.E.; treatment versus NT, **, p < 0.01; treatment versus treatment + SB431542; #, p < 0.05; ##, p < 0.01, n = 3). C, immunoblotting for phosphorylated p42/44 MAPK following stimulation with 2f-LI for 30 min in the presence or absence of SB431542 (10 μm). D, histogram showing densitometry analysis and quantification of PAR2-induced p42/44 MAPK phosphorylation in the presence or absence of SB431542 (10 μm) (mean ± S.E.; 2f-LI versus 2f-LI + SB431542, p = NS, n = 3). E, immunoblotting for phosphorylated Smad2 following stimulation with 2f-LI for 30 min in the presence or absence of marimastat (5 μm). F, histogram showing densitometry analysis of Western blot images to quantify Smad2 phosphorylation in the presence of marimastat after PAR2 activation (mean ± S.E.; 2f-LI versus NT, *, p < 0.05; 2f-LI versus 2f-LI + marimastat; #, p < 0.05, n = 3).
Given that membrane matrix metalloproteinases (MMPs) are key mediators for the transactivation of the EGF receptor (EGFR) and TGFβR via the extracellular release of HB-EGF or activation of latent TGFβ (22, 23), we examined the impact of a metalloproteinase inhibitor on the PAR2-triggered transactivation of the TGFβR and Smad2 phosphorylation. Cells were treated with the broad-spectrum MMP inhibitor, marimastat. Pre-treatment of HPTCs with marimastat (5 μm) down-regulated but did not abolish the PAR2-induced phosphorylation of Smad2, confirming a partial role for MMPs in the ability of PAR2 to stimulate TGFβR transactivation (Fig. 8, E and F).
PAR2 Activates the Smad Pathway by EGF Receptor Transactivation
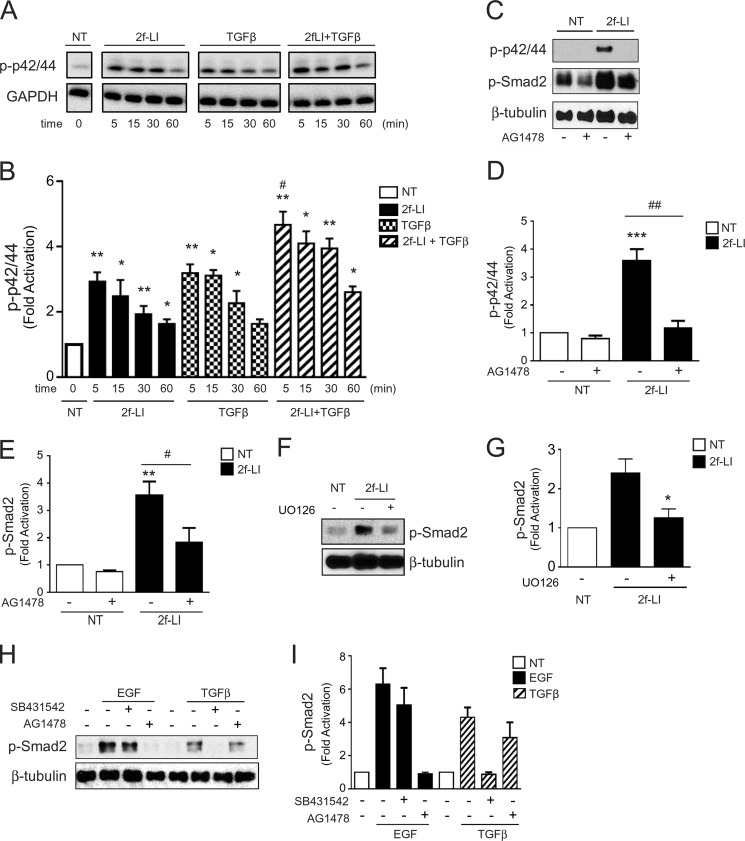
Because the selective TGFβRI inhibitor, SB431542, was not sufficient to completely abolish Smad2 phosphorylation stimulated by PAR2 in vitro, we investigated alternate pathways that may be involved. There is extensive evidence that diverse TGFβ-independent mediators such as MAPK signaling can activate Smad2 (24, 25). Because G-protein-coupled receptors are known to transactivate EGFR in many cell types (22, 26), we hypothesized that PAR2 mediates EGFR transactivation that modulates phosphorylation of MAPK and Smad2. We found that 2f-LI induced a robust p42/44 MAPK phosphorylation that peaked at about 5–10 min (Fig. 9, A and B). TGFβ also induced MAPK phosphorylation, which was slightly enhanced when combined with 2f-LI. Consistent with receptor transactivation, PAR2-induced MAPK activation was totally EGFR-dependent because the MAPK phosphorylation was completely abrogated by the EGFR-specific inhibitor, AG1478 (Fig. 9, C and D). Interestingly, AG1478 significantly diminished basal phosphorylation of Smad2 and PAR2-mediated Smad2 phosphorylation (Fig. 9, C and E). Next, to establish a link between PAR2-mediated MAPK activation and Smad2 phosphorylation, HPTC were preincubated with the MEK1 inhibitor, U0126. HPTC treated with U0126 displayed significantly reduced Smad2 phosphorylation in response to PAR2-activating peptides (Fig. 9, F and G). To confirm that PAR2-stimulated Smad2 phosphorylation occurred via both TGFβR and EGFR, it was necessary to test the specificity of the inhibitors used. As shown in Fig. 9, H and I, AG1478 completely abrogated EGF (100 ng/ml)-mediated Smad2 phosphorylation but did not significantly diminish TGFβ1 (2.5 ng/ml)-mediated Smad2 phosphorylation. Similarly, SB431542 abrogated TGFβ-mediated Smad2 phosphorylation, but EGF-mediated Smad2 phosphorylation was not affected, confirming a lack of off-target effects of the two inhibitors on the respective receptors.
FIGURE 9.
Transactivation of the EGFR by PAR2. A, immunoblotting for p42/44 MAPK phosphorylation following stimulation with 2f-LI and/or TGFβ1 (2.5 ng/ml) for 5, 15, 30, and 60 min. B, histogram showing densitometry analysis and quantification of p42/44 MAPK phosphorylation normalized to GAPDH (immunoblotting) induced by PAR2 and/or TGFβ (mean ± S.E.; treatment group versus no treatment, *, p < 0.05; **, p < 0.01; TGFβ + 2f-LI versus 2f-LI or TGFβ alone; #, p < 0.05, n = 3). C, immunoblotting for PAR2-mediated p42/44 MAPK and Smad-2 phosphorylation in the presence or absence of the EGFR kinase inhibitor, AG1478 (1 μm). D, histogram showing densitometry analysis and quantification of PAR2-mediated p42/44 MAPK and E, Smad2 phosphorylation normalized to β-tubulin in the presence or absence of the EGFR kinase inhibitor, AG1478 (mean ± S.E.; p42/44 or Smad2 phosphorylation 2f-LI versus NT, **, p < 0.01; ***, p < 0.001; p42/44 or Smad2 phosphorylation 2f-LI versus 2f-LI + AG1478, #, p < 0.05; ##, p < 0.01, n = 3). F, immunoblotting for Smad2 phosphorylation following stimulation with 2f-LI in the presence or absence of the MEK1 inhibitor, UO126 (10 μm). G, histogram showing densitometry analysis and quantification of PAR2-induced Smad2 phosphorylation normalized to β-tubulin in the presence or absence of UO126 (mean ± S.E.; 2f-LI versus 2f-LI + UO126, *, p < 0.05, n = 3). H, immunoblotting for phosphorylated Smad2 following stimulation with TGFβ1 and EGF, in the presence or absence of AG1478 or SB431542. I, histogram showing densitometry analysis and quantification of phosphorylated Smad2 normalized to β-tubulin in the presence or absence of SB431542 and AG1478 (mean ± S.E., EGF- or TGFβ-induced P-Smad2 versus SB431542 or AG1478, respectively, p = NS, n = 3).
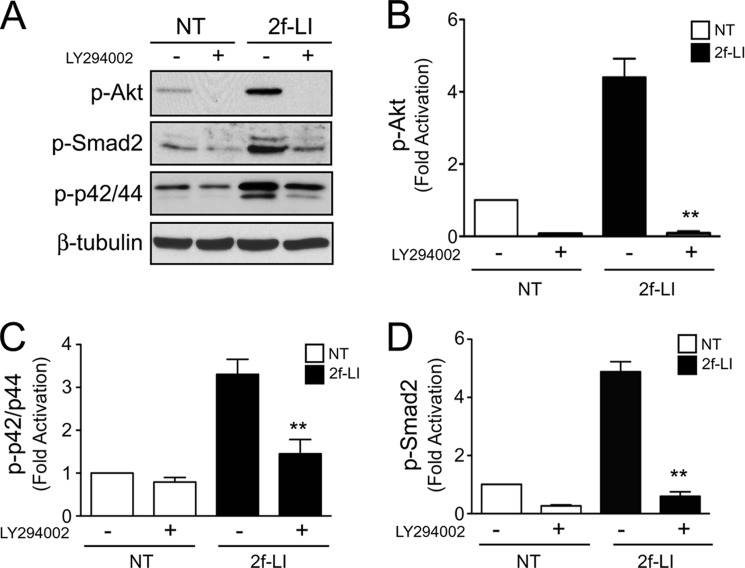
Phosphatidylinositide 3-kinase (PI3K) has been shown to regulate EGFR transactivation downstream of certain G-protein-coupled receptors (27, 28). PAR2 activation induced robust Akt phosphorylation that was blocked by the PI3K inhibitor, LY294002 (20 μm). Importantly, LY294002 also abolished PAR2-mediated MAPK and Smad2 phosphorylation providing evidence that PI3K is required for EGFR transactivation and R-Smad activation downstream of PAR2 (Fig. 10, A–D). Together, these data show that PAR2 transactivates both EGFR and TGFβR to activate Smad2, involving MMPs and PI3K. Furthermore, MAPK activation downstream of PAR2 and the EGFR enhances Smad2 phosphorylation.
FIGURE 10.
PI3K activation by PAR2. A, immunoblotting for PAR2-mediated Akt, Smad2, and p42/44 MAPK phosphorylation following stimulation with 2f-LI in the presence or absence of the PI3K inhibitor, LY294002 (20 μm). B, histogram showing densitometry analysis and quantification of phosphorylated Akt; C, Smad2; and D, p42/44 MAPK normalized to β-tubulin following stimulation with 2f-LI in the presence or absence of LY294002 (NT, no treatment; all panels mean ± S.E.; 2f-LI versus 2f-LI + LY294002, **, p < 0.01, n = 3).
PAR2 Transactivation of TGFβ and EGF Receptors Regulates CTGF
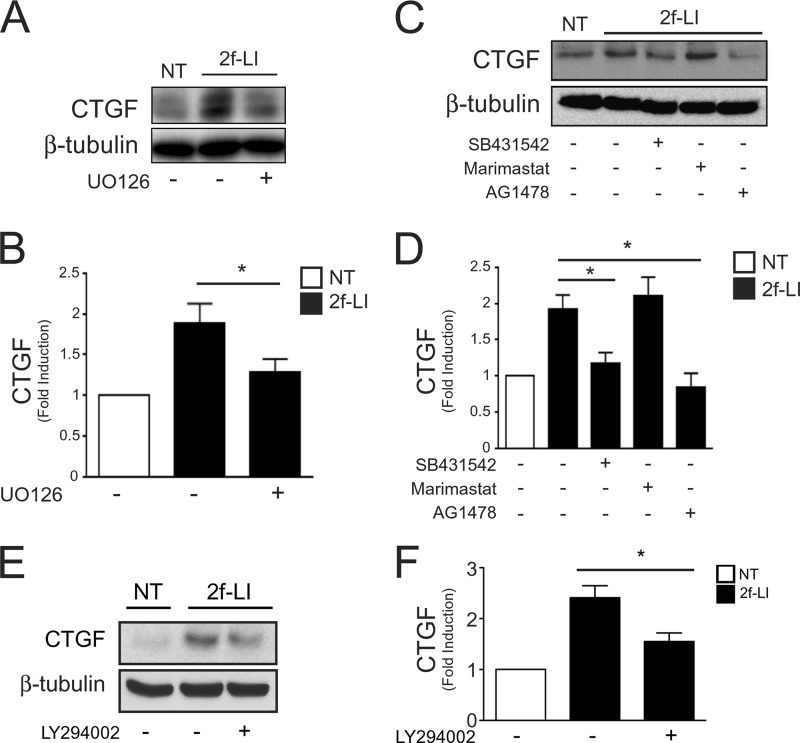
Having identified the mechanisms of R-Smad activation by PAR2, we used a pharmacological approach to evaluate the relative involvement of each pathway in CTGF production. We pretreated HPTCs with selective inhibitors of MEK1 (UO126, 10 μm), TGFβR (SB431542, 10 μm), MMPs (marimastat, 5 μm), EGFR (AG1478, 1 μm), and PI3K (LY294002, 20 μm) before stimulating the cells with PAR2-AP (2f-LI, 15 μm) for 24 h (Fig. 11). We found that both AG1478 and SB431542 abrogated CTGF induction. MAPK and PI3K inhibition also significantly down-regulated CTGF induction mediated by PAR2. Thus, PAR2 activation contributes to fibrogenesis by transactiving EGF and TGFβ receptors resulting in Smad2 phosphorylation, and CTGF expression in human proximal tubular cells. However, marimastat was not able to diminish PAR2-induced CTGF expression at this later time point suggesting the presence of redundant transactivation pathways in addition to MMPs.
FIGURE 11.
Role of EGF and TGFβ receptors in PAR2-induced CTGF expression. A, immunoblotting for CTGF following PAR2 activation for 24 h in the presence or absence of the MEK1 inhibitor, UO126 (10 μm). B, histogram showing densitometry analysis and quantification of PAR2-induced CTGF expression (immunoblotting) (mean ± S.E.; 2f-LI versus 2f-LI + UO126, *, p < 0.05, n = 3). C, immunoblotting for CTGF following PAR2 activation for 24 h in the presence or absence of SB431542 (10 μm), marimastat (5 μm), and AG1478 (1 μm). D, histogram showing densitometry analysis and quantification of CTGF expression (immunoblotting) following PAR2 activation in the presence of various inhibitors (mean ± S.E.; 2f-LI versus 2f-LI + SB431542 or AG1478, *, p < 0.05, n = 3; 2f-LI versus 2f-LI + marimastat, p = NS). E, immunoblotting for CTGF following PAR2 activation for 24 h in the presence or absence of LY294002 (20 μm). F, histogram showing densitometry analysis and quantification of CTGF expression (immunoblotting) following PAR2 activation in the presence of the PI3K inhibitor (NT, no treatment; mean ± S.E., 2f-LI versus 2f-LI + LY294002, *, p < 0.05, n = 3).
DISCUSSION
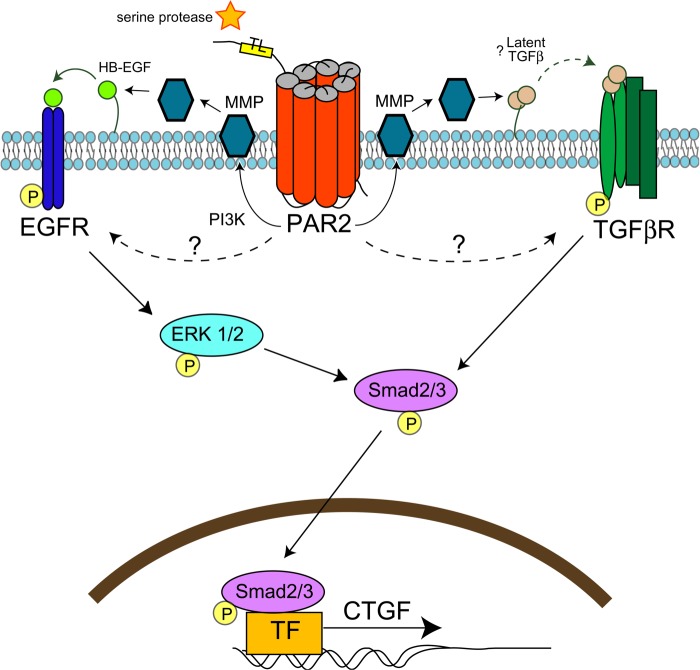
Evidence suggests that PAR2 plays an important role in tissue fibrosis (12–14), but the molecular mechanism is undefined. In this study, we show that PAR2 contributes to early fibrosis in a murine experimental model of renal injury. Furthermore, we provide evidence in vitro that PAR2 transactivates TGFβ and EGF receptors to phosphorylate Smad2 and up-regulate the pro-fibrotic mediator, CTGF. Receptor transactivation and Smad signaling downstream of PAR2 required MMPs, MAPK, and PI3K (see proposed model Fig. 12).
FIGURE 12.
Model for PAR2-mediated transactivation of EGF and TGFβ receptors and CTGF expression. During injury, serine proteinases cleave PAR2 tethered ligand resulting in receptor activation. PAR2 transactivates both EGF and TGFβ-receptors in part via PI3K and/or MMPs, which may activate HB-EGF or latent TGFβ. TGFβ receptor activation results in Smad2 phosphorylation. EGF receptor transactivation results in MAP kinase signaling, which enhances Smad2 phosphorylation. Activated Smad2 translocates to the nucleus to up-regulate the expression of CTGF and other pro-fibrotic genes. Redundant pathways of PAR2-mediated receptor transactivation likely exist.
Our study using the PAR2-deficient mice extends the work of Xiong et al. (29), who observed increases in renal PAR2 expression from 1 to 14 days post-unilateral renal obstruction in mice, in association with an increase in α-SMA expression. Similarly, the murine data are entirely in accordance with observations of increased PAR2 expression, in association with interstitial fibrosis in human kidney biopsies obtained from individuals with immunoglobulin A nephropathy (30). Clearly within the first week after ureteral obstruction in our mouse model, all indices of renal damage and fibrosis were reduced in the PAR2-deficient mice, compared with the wild-type animals. However, by 14 days differences between control and PAR2-deficient mice were not significantly different. Because ureteric obstruction induces a fulminant and complete injury to the kidney, PAR2 deficiency is insufficient to counteract the multiple redundant pathways that are eventually activated in this model. Thus, our data identify a pathogenic role for PAR2 at the onset of injury and fibrosis in experimental kidney disease.
The involvement of PAR2 in renal injury and fibrosis is consistent with the observations that systemic inhibition of trypsin-like proteinases with camostat mesilate can protect the kidney, pancreas, and liver from fibrosis by mechanisms involving down-regulation of TGFβ and collagen expression (31–33). Very recently, camostat mesilate was identified as an anti-fibrotic agent to inhibit TGFβ-mediated fibrotic signaling in kidney-derived fibroblasts (NRK-49F) in vitro and to attenuate renal fibrosis in the UUO model in rats (34). Additionally, the use of urinary trypsin inhibitor has been found to ameliorate liver and lung fibrosis by suppressing the production and activation of TGFβ (35, 36). There are a number of candidate renal-derived serine proteinases that in principle could regulate PAR2, including, coagulation cascade enzymes (e.g. Factor VIIa/Xa), tissue-derived trypsins, tissue kallikreins, and mast cell tryptase (37). Previous studies have implicated these enzymes in fibrosis because of (i) their presence in significant amounts at the glomerular and tubulointerstitial level in several chronic nephropathies (38) and (ii) their ability to promote proliferation of various types of fibroblasts derived from the kidney, lung, and heart via PAR2 activation in vitro (39, 40). Although mast cell recruitment is positively correlated with the progression of renal fibrosis, our PAR2 receptor desensitization assay confirmed that recombinant human mast cell tryptase can activate PAR2 in human proximal tubular epithelial cells, whereas it is not able to activate PAR2 in other settings due to glycosylation of the tethered ligand sequence (41). Taken together, these candidate serine proteinases may be able to regulate PAR2 in the setting of kidney inflammation to promote fibrosis by the mechanisms we describe herein. Targeting kidney serine proteinases with suitable serine proteinase inhibitors or blocking PAR2 with a receptor antagonist may serve to attenuate renal fibrosis.
In keeping with the impact of PAR2 deficiency in UUO-mediated renal fibrosis, we extended our investigations in vitro to understand the molecular mechanisms by which PAR2 contributes to a pro-fibrogenic phenotype. TGFβ initiates biological signaling by interacting with its receptor (TGFβRI/II or Alk5) that leads to the phosphorylation of the R-Smads that include Smad2 and -3. Phosphorylated Smad2/3 forms an oligomeric complex with Smad4, which then translocates to the nucleus to initiate the transcription of genes that regulate fibrosis, cell proliferation, differentiation, and apoptosis (42). Previous observations in isolated cultured human tubular epithelial cells have demonstrated that functional epithelial PAR2 activation stimulates the production of monocyte chemotactic protein-1 and TGFβ (11). In addition to a proinflammatory role of PAR2, our data shows that PAR2 contributes to profibrotic pathways by acting synergistically with TGFβ to induce Smad2 activation and CTGF expression consistent with the in vivo studies.
The activation of the Smad2 pathway by PAR2 occurred by EGFR and TGFβR transactivation. Similar to PAR2, PAR1 has also been shown in a recent study to transactivate TGFβR. PAR1 activation using thrombin liberates membrane-bound latent TGFβ through RhoA/ROCK-mediated integrin signaling pathways in smooth muscle-derived cells (43). In epithelial cells, our data support a role for MMPs in EGFR and TGFβR transactivation via PAR2. Although the transactivation of EGFR by G-protein-coupled receptors including PAR2 is recognized to involve MMPs (44, 45), metalloproteinases may also activate latent TGF-β through the digestion of pro-peptide dimer latency-associated peptide (23). However, our studies using the MMP inhibitor marimastat did not completely abolish Smad2 phosphorylation or CTGF expression following PAR2 activation suggesting that other processes may be involved. Further studies are required to dissect the exact mechanism by which PAR2 transactivates the TGFβR.
EGF receptor transactivation plays an important role in mitogenic signaling in response to G-protein-coupled receptor activation in many cells (22, 28). Studies have indicated a role for EGFR in the recovery from renal injury (46). However, constitutive or chronic activation of EGFR is thought to contribute to the progression of renal fibrosis, including epithelial to mesenchymal transition (47). Thus our findings that identify a role of EGFR in PAR2-mediated fibrosis are not unexpected. The studies using a receptor-selective EGFR inhibitor indicated that PAR2-mediated MAP kinase activation is exclusively EGFR-dependent, and that PAR2-mediated Smad2 phosphorylation is due to TGFβR transactivation as well as MAPK activation downstream of the EGFR. The mechanisms by which PAR2 may transactivate the EGFR are several, including (i) the MMP-catalyzed release of receptor-activating ligands such as EGF, TGF-α, and HB-EGF from their cell membrane-bound precursors or (ii) intracellular signal pathways, including cytosolic kinases such as Src, PI3K, and PKC (22, 27, 44, 48). Consistent with these findings, our data show that PAR2-mediated EGFR transactivation in HPTC involves at least PI3K and MMPs.
CTGF, along with TGFβ, promotes epithelial to mesenchymal transition in proximal tubular epithelial cells in vitro (49, 50). There is no doubt that Smad-dependent signaling not only regulates epithelial to mesenchymal transition but also the expression of CTGF that contribute to renal fibrosis (51). We showed that PAR2 alone can up-regulate Smad2 and CTGF in HPTC. Not surprisingly, CTGF expression, MAPK and Smad2 phosphorylation were all enhanced when HPTCs were exposed to PAR2-AP in combination with TGFβ. Thus PAR2-regulated EGFR transactivation synergizes with TGFβ signaling that would not be atypical under pathological conditions where multiple pathways and growth factors are activated. In keeping with these data, PAR2-dependent Smad2 activation and CTGF up-regulation was significantly reduced, but not completely blocked by the MAPK inhibitor, UO126, highlighting the redundant role of TGFβR.
In conclusion, our data demonstrate that PAR2 plays a role in the early stages of renal fibrosis in a murine UUO model and that the activation of PAR2 in kidney tubular epithelial cells transactivates the EGF and TGFβ receptors to enhance Smad2 activation and the production of the pro-fibrotic factor, CTGF. PAR2 thus appears to be a contributor to renal injury and fibrosis in vivo and represents a potential therapeutic target for patients with chronic progressive kidney disease.
Acknowledgment
We thank Dr. K. Mihara for technical assistance.
This work was supported by Operating Grants from the Canadian Institutes of Health Research (CIHR), an Emerging Team Grant from the University of Alberta, and by the Snyder Institute for Chronic Diseases Live Cell Imaging Facility funded by an equipment and infrastructure grant from the Canadian Foundation Innovation (CFI) and the Alberta Science and Research Authority.
- PAR
- proteinase-activated receptor
- HPTC
- human proximal tubular epithelial cell
- UUO
- unilateral ureteric obstruction
- MMP
- matrix metalloproteinase
- CTGF
- connective tissue growth factor
- α-SMA
- smooth muscle actin
- EGFR
- epidermal growth factor receptor.
REFERENCES
- 1. Ali T., Khan I., Simpson W., Prescott G., Townend J., Smith W., Macleod A. (2007) Incidence and outcomes in acute kidney injury. A comprehensive population-based study. J. Am. Soc. Nephrol. 18, 1292–1298 [DOI] [PubMed] [Google Scholar]
- 2. Eddy A. A. (2000) Molecular basis of renal fibrosis. Pediatr. Nephrol. 15, 290–301 [DOI] [PubMed] [Google Scholar]
- 3. Eddy A. A. (2009) Serine proteases, inhibitors and receptors in renal fibrosis. Thromb. Haemost. 101, 656–664 [PMC free article] [PubMed] [Google Scholar]
- 4. Ramachandran R., Noorbakhsh F., Defea K., Hollenberg M. D. (2012) Targeting proteinase-activated receptors. Therapeutic potential and challenges. Nat. Rev. Drug Discov. 11, 69–86 [DOI] [PubMed] [Google Scholar]
- 5. Rothmeier A. S., Ruf W. (2012) Protease-activated receptor 2 signaling in inflammation. Semin. Immunopathol. 34, 133–149 [DOI] [PubMed] [Google Scholar]
- 6. Hyun E., Andrade-Gordon P., Steinhoff M., Vergnolle N. (2008) Protease-activated receptor-2 activation. A major actor in intestinal inflammation. Gut 57, 1222–1229 [DOI] [PubMed] [Google Scholar]
- 7. Cenac N., Coelho A. M., Nguyen C., Compton S., Andrade-Gordon P., MacNaughton W. K., Wallace J. L., Hollenberg M. D., Bunnett N. W., Garcia-Villar R., Bueno L., Vergnolle N. (2002) Induction of intestinal inflammation in mouse by activation of proteinase-activated receptor-2. Am. J. Pathol. 161, 1903–1915 [DOI] [PMC free article] [PubMed] [Google Scholar]
- 8. Lindner J. R., Kahn M. L., Coughlin S. R., Sambrano G. R., Schauble E., Bernstein D., Foy D., Hafezi-Moghadam A., Ley K. (2000) Delayed onset of inflammation in protease-activated receptor-2-deficient mice. J. Immunol. 165, 6504–6510 [DOI] [PubMed] [Google Scholar]
- 9. Gui Y., Loutzenhiser R., Hollenberg M. D. (2003) Bidirectional regulation of renal hemodynamics by activation of PAR1 and PAR2 in isolated perfused rat kidney. Am. J. Physiol. Renal Physiol. 285, F95–F104 [DOI] [PubMed] [Google Scholar]
- 10. Morla L., Brideau G., Fila M., Crambert G., Cheval L., Houillier P., Ramakrishnan S., Imbert-Teboul M., Doucet A. (2013) Renal proteinase-activated receptor 2, a new actor in the control of blood pressure and plasma potassium level. J. Biol. Chem. 288, 10124–10131 [DOI] [PMC free article] [PubMed] [Google Scholar]
- 11. Vesey D. A., Kruger W. A., Poronnik P., Gobé G. C., Johnson D. W. (2007) Proinflammatory and proliferative responses of human proximal tubule cells to PAR-2 activation. Am. J. Physiol. Renal Physiol. 293, F1441-F1449 [DOI] [PubMed] [Google Scholar]
- 12. Knight V., Tchongue J., Lourensz D., Tipping P., Sievert W. (2012) Protease-activated receptor 2 promotes experimental liver fibrosis in mice and activates human hepatic stellate cells. Hepatology 55, 879–887 [DOI] [PubMed] [Google Scholar]
- 13. Frungieri M. B., Weidinger S., Meineke V., Köhn F. M., Mayerhofer A. (2002) Proliferative action of mast-cell tryptase is mediated by PAR2, COX2, prostaglandins, and PPARγ. Possible relevance to human fibrotic disorders. Proc. Natl. Acad. Sci. U.S.A. 99, 15072–15077 [DOI] [PMC free article] [PubMed] [Google Scholar]
- 14. Su X., Matthay M. A. (2009) Role of protease-activated receptor 2 in experimental acute lung injury and lung fibrosis. Anat. Rec. (Hoboken) 292, 580–586 [DOI] [PMC free article] [PubMed] [Google Scholar]
- 15. Damiano B. P., Cheung W. M., Santulli R. J., Fung-Leung W. P., Ngo K., Ye R. D., Darrow A. L., Derian C. K., de Garavilla L., Andrade-Gordon P. (1999) Cardiovascular responses mediated by protease-activated receptor-2 (PAR-2) and thrombin receptor (PAR-1) are distinguished in mice deficient in PAR-2 or PAR-1. J. Pharmacol. Exp. Ther 288, 671–678 [PubMed] [Google Scholar]
- 16. White L. R., Blanchette J. B., Ren L., Awn A., Trpkov K., Muruve D. A. (2007) The characterization of α5-integrin expression on tubular epithelium during renal injury. Am. J. Physiol. Renal Physiol. 292, F567–576 [DOI] [PubMed] [Google Scholar]
- 17. Wuthrich R. P., Glimcher L. H., Yui M. A., Jevnikar A. M., Dumas S. E., Kelley V. E. (1990) MHC class II, antigen presentation and tumor necrosis factor in renal tubular epithelial cells. Kidney Int. 37, 783–792 [DOI] [PubMed] [Google Scholar]
- 18. Ramachandran R., Mihara K., Chung H., Renaux B., Lau C. S., Muruve D. A., DeFea K. A., Bouvier M., Hollenberg M. D. (2011) Neutrophil elastase acts as a biased agonist for proteinase-activated receptor-2 (PAR2). J. Biol. Chem. 286, 24638–24648 [DOI] [PMC free article] [PubMed] [Google Scholar]
- 19. Al-Ani B., Saifeddine M., Kawabata A., Renaux B., Mokashi S., Hollenberg M. D. (1999) Proteinase-activated receptor 2 (PAR(2)). Development of a ligand-binding assay correlating with activation of PAR(2) by PAR(1)- and PAR(2)-derived peptide ligands. J. Pharmacol. Exp. Ther. 290, 753–760 [PubMed] [Google Scholar]
- 20. Kondo S., Kagami S., Kido H., Strutz F., Müller G. A., Kuroda Y. (2001) Role of mast cell tryptase in renal interstitial fibrosis. J. Am. Soc. Nephrol. 12, 1668–1676 [DOI] [PubMed] [Google Scholar]
- 21. Lan H. Y. (2011) Diverse roles of TGF-β/Smads in renal fibrosis and inflammation. Int. J. Biol. Sci. 7, 1056–1067 [DOI] [PMC free article] [PubMed] [Google Scholar]
- 22. Schäfer B., Gschwind A., Ullrich A. (2004) Multiple G-protein-coupled receptor signals converge on the epidermal growth factor receptor to promote migration and invasion. Oncogene 23, 991–999 [DOI] [PubMed] [Google Scholar]
- 23. Yu Q., Stamenkovic I. (2000) Cell surface-localized matrix metalloproteinase-9 proteolytically activates TGF-β and promotes tumor invasion and angiogenesis. Genes Dev. 14, 163–176 [PMC free article] [PubMed] [Google Scholar]
- 24. Li J. H., Huang X. R., Zhu H. J., Oldfield M., Cooper M., Truong L. D., Johnson R. J., Lan H. Y. (2004) Advanced glycation end products activate Smad signaling via TGF-β-dependent and independent mechanisms. Implications for diabetic renal and vascular disease. FASEB J. 18, 176–178 [DOI] [PubMed] [Google Scholar]
- 25. Hao J., Wang B., Jones S. C., Jassal D. S., Dixon I. M. (2000) Interaction between angiotensin II and Smad proteins in fibroblasts in failing heart and in vitro. Am. J. Physiol. Heart Circ. Physiol. 279, H3020–3030 [DOI] [PubMed] [Google Scholar]
- 26. Kalmes A., Daum G., Clowes A. W. (2001) EGFR transactivation in the regulation of SMC function. Ann. N.Y. Acad. Sci. 947, 42–54; discussion 54–45 [DOI] [PubMed] [Google Scholar]
- 27. Zhang Q., Thomas S. M., Lui V. W., Xi S., Siegfried J. M., Fan H., Smithgall T. E., Mills G. B., Grandis J. R. (2006) Phosphorylation of TNF-α converting enzyme by gastrin-releasing peptide induces amphiregulin release and EGF receptor activation. Proc. Natl. Acad. Sci. U.S.A. 103, 6901–6906 [DOI] [PMC free article] [PubMed] [Google Scholar]
- 28. Gschwind A., Zwick E., Prenzel N., Leserer M., Ullrich A. (2001) Cell communication networks. Epidermal growth factor receptor transactivation as the paradigm for interreceptor signal transmission. Oncogene 20, 1594–1600 [DOI] [PubMed] [Google Scholar]
- 29. Xiong J., Zhu Z., Liu J., Wang Y., Li Z. (2005) Role of protease activated receptor-2 expression in renal interstitial fibrosis model in mice. J. Huazhong Univ. Sci. Technolog. Med. Sci. 25, 523–526 [DOI] [PubMed] [Google Scholar]
- 30. Grandaliano G., Pontrelli P., Cerullo G., Monno R., Ranieri E., Ursi M., Loverre A., Gesualdo L., Schena F. P. (2003) Protease-activated receptor-2 expression in IgA nephropathy. A potential role in the pathogenesis of interstitial fibrosis. J. Am. Soc. Nephrol. 14, 2072–2083 [DOI] [PubMed] [Google Scholar]
- 31. Okuno M., Akita K., Moriwaki H., Kawada N., Ikeda K., Kaneda K., Suzuki Y., Kojima S. (2001) Prevention of rat hepatic fibrosis by the protease inhibitor, camostat mesilate, via reduced generation of active TGF-β. Gastroenterology 120, 1784–1800 [DOI] [PubMed] [Google Scholar]
- 32. Ishikura H., Nishimura S., Matsunami M., Tsujiuchi T., Ishiki T., Sekiguchi F., Naruse M., Nakatani T., Kamanaka Y., Kawabata A. (2007) The proteinase inhibitor camostat mesilate suppresses pancreatic pain in rodents. Life Sci. 80, 1999–2004 [DOI] [PubMed] [Google Scholar]
- 33. Maekawa A., Kakizoe Y., Miyoshi T., Wakida N., Ko T., Shiraishi N., Adachi M., Tomita K., Kitamura K. (2009) Camostat mesilate inhibits prostasin activity and reduces blood pressure and renal injury in salt-sensitive hypertension. J. Hypertens. 27, 181–189 [DOI] [PubMed] [Google Scholar]
- 34. Morinaga J., Kakizoe Y., Miyoshi T., Onoue T., Ueda M., Mizumoto T., Yamazoe R., Uchimura K., Hayata M., Shiraishi N., Adachi M., Sakai Y., Tomita K., Kitamura K. (2013) The anti-fibrotic effect of a serine protease inhibitor in the kidney. Am. J. Physiol. Renal Physiol. 305, F173–F181 [DOI] [PubMed] [Google Scholar]
- 35. Katoh H., Ishikawa H., Hasegawa M., Yoshida Y., Suzuki Y., Ohno T., Takahashi T., Nakano T. (2010) Protective effect of urinary trypsin inhibitor on the development of radiation-induced lung fibrosis in mice. J. Radiat. Res. 51, 325–332 [DOI] [PubMed] [Google Scholar]
- 36. Kono T., Kashiwade Y., Asama T., Chisato N., Ebisawa Y., Yoneda M., Kasai S. (2011) Preventive effect of urinary trypsin inhibitor on the development of liver fibrosis in mice. Exp. Biol. Med. (Maywood) 236, 1314–1321 [DOI] [PubMed] [Google Scholar]
- 37. Ramachandran R., Hollenberg M. D. (2008) Proteinases and signalling. Pathophysiological and therapeutic implications via PARs and more. Br. J. Pharmacol. 153, S263–282 [DOI] [PMC free article] [PubMed] [Google Scholar]
- 38. Liu H., Liu F., Peng Y., Liu Y., Li L., Tu X., Cheng M., Xu X., Chen X., Ling G., Sun L. (2010) Role of mast cells, stem cell factor and protease-activated receptor-2 in tubulointerstitial lesions in IgA nephropathy. Inflamm. Res. 59, 551–559 [DOI] [PubMed] [Google Scholar]
- 39. Borensztajn K., Stiekema J., Nijmeijer S., Reitsma P. H., Peppelenbosch M. P., Spek C. A. (2008) Factor Xa stimulates proinflammatory and profibrotic responses in fibroblasts via protease-activated receptor-2 activation. Am. J. Pathol. 172, 309–320 [DOI] [PMC free article] [PubMed] [Google Scholar]
- 40. Murray D. B., McLarty-Williams J., Nagalla K. T., Janicki J. S. (2012) Tryptase activates isolated adult cardiac fibroblasts via protease activated receptor-2 (PAR-2). J. Cell Commun. Signal. 6, 45–51 [DOI] [PMC free article] [PubMed] [Google Scholar]
- 41. Compton S. J., Renaux B., Wijesuriya S. J., Hollenberg M. D. (2001) Glycosylation and the activation of proteinase-activated receptor 2 (PAR(2)) by human mast cell tryptase. Br. J. Pharmacol. 134, 705–718 [DOI] [PMC free article] [PubMed] [Google Scholar]
- 42. Schnaper H. W., Hayashida T., Poncelet A. C. (2002) It's a Smad world. Regulation of TGF-β signaling in the kidney. J. Am. Soc. Nephrol. 13, 1126–1128 [DOI] [PubMed] [Google Scholar]
- 43. Burch M. L., Ballinger M. L., Yang S. N., Getachew R., Itman C., Loveland K., Osman N., Little P. J. (2010) Thrombin stimulation of proteoglycan synthesis in vascular smooth muscle is mediated by protease-activated receptor-1 transactivation of the transforming growth factor β type I receptor. J. Biol. Chem. 285, 26798–26805 [DOI] [PMC free article] [PubMed] [Google Scholar]
- 44. Prenzel N., Zwick E., Daub H., Leserer M., Abraham R., Wallasch C., Ullrich A. (1999) EGF receptor transactivation by G-protein-coupled receptors requires metalloproteinase cleavage of proHB-EGF. Nature 402, 884–888 [DOI] [PubMed] [Google Scholar]
- 45. Darmoul D., Gratio V., Devaud H., Laburthe M. (2004) Protease-activated receptor 2 in colon cancer. Trypsin-induced MAPK phosphorylation and cell proliferation are mediated by epidermal growth factor receptor transactivation. J. Biol. Chem. 279, 20927–20934 [DOI] [PubMed] [Google Scholar]
- 46. Chen J., Chen J. K., Harris R. C. (2012) Deletion of the epidermal growth factor receptor in renal proximal tubule epithelial cells delays recovery from acute kidney injury. Kidney Int. 82, 45–52 [DOI] [PMC free article] [PubMed] [Google Scholar]
- 47. Tang J., Liu N., Tolbert E., Ponnusamy M., Ma L., Gong R., Bayliss G., Yan H., Zhuang S. (2013) Sustained activation of EGFR triggers renal fibrogenesis after acute kidney injury. Am. J. Pathol. 183, 160–172 [DOI] [PMC free article] [PubMed] [Google Scholar]
- 48. Andreev J., Galisteo M. L., Kranenburg O., Logan S. K., Chiu E. S., Okigaki M., Cary L. A., Moolenaar W. H., Schlessinger J. (2001) Src and Pyk2 mediate G-protein-coupled receptor activation of epidermal growth factor receptor (EGFR) but are not required for coupling to the mitogen-activated protein (MAP) kinase signaling cascade. J. Biol. Chem. 276, 20130–20135 [DOI] [PubMed] [Google Scholar]
- 49. Gore-Hyer E., Shegogue D., Markiewicz M., Lo S., Hazen-Martin D., Greene E. L., Grotendorst G., Trojanowska M. (2002) TGF-β and CTGF have overlapping and distinct fibrogenic effects on human renal cells. Am. J. Physiol. Renal Physiol. 283, F707-F716 [DOI] [PubMed] [Google Scholar]
- 50. Zhang C., Meng X., Zhu Z., Liu J., Deng A. (2004) Connective tissue growth factor regulates the key events in tubular epithelial to myofibroblast transition in vitro. Cell Biol. Int. 28, 863–873 [DOI] [PubMed] [Google Scholar]
- 51. Phanish M. K., Wahab N. A., Colville-Nash P., Hendry B. M., Dockrell M. E. (2006) The differential role of Smad2 and Smad3 in the regulation of pro-fibrotic TGFβ1 responses in human proximal-tubule epithelial cells. Biochem. J. 393, 601–607 [DOI] [PMC free article] [PubMed] [Google Scholar]


