Abstract
A stroke-analysis system based on a CFD (Computational Fluid Dynamics) simulation has been developed to evaluate the hydrodynamic forces acting on a swimmer’s hand. Using the present stroke-analysis system, a stroke technique of top swimmers can be recognized with regard to the hydrodynamic forces. The developed analysis system takes into account the effect of a transient stroke motion including acceleration and a curved stroke path without using assumptions such as a quasi-static approach. An unsteady Navier-Stokes solver based on an unstructured grid method is employed as the CFD method to calculate a viscous flow around a swimmer’s hand which can cope with the complicated geometry of hands. The CFD method is validated by comparison with experiments in steady-state and transient conditions. Following the validations, a stroke-analysis system is proposed, in which a hand moves in accordance with a stroke path measured by synchronized video cameras, and the fluid forces acting on the hand are computed with the CFD method. As a demonstration of the stroke-analysis system, two world class swimmers’ strokes in a race of 200 m freestyle are analyzed. The hydrodynamic forces acting on the hands of the top swimmers are computed, and the comparison of two swimmers shows that the stroke of the faster swimmer, who advanced at 1.84 m·s-1 during the stroke-analysis, generated larger thrust with higher thrust efficiency than that of the slower swimmer, who advanced at 1.75 m·s-1. The applicability of the present stroke analysis system has been proved through this analysis.
Key Points.
The stroke-analysis system using CFD technique has been established.
The stroke path and the hand orientation are obtained from a swimming competition with two synchronized underwater video camera, and used for the input data to the CFD analysis.
The hydrodynamic force acting on the swimmer’s hand and thrust efficiency are analyzed, and the stroke technique can be evaluated.
Key words: Computational fluid dynamics, swimming, drag, thrust, thrust efficiency, stroke analysis
Introduction
Swimming is one of the major athletic sports, and considerable efforts are being made to establish new records. In order to swim faster, increasing thrust and decreasing drag are required from the viewpoint of the fluid dynamics. In the ship hydrodynamics, engineering approaches, such as experiments and computational simulations, are widely used to decrease the drag and increase the thrust by optimizing hull shapes and propeller designs. However, it is not straightforward to apply these engineering approaches to the swimming, because the measurement of the fluid forces acting on a swimmer is extremely difficult due to the restrictions of measuring devices, and the computational simulation has difficulties in dealing with the movement of a flexible and articulated body of a human. Many efforts are being made to overcome these issues in the field of the sports engineering for swimming.
In the research field of the flow around a swimmer’s hand, experiments using a hand model in a steady-state condition were carried out by (Berger et al., 1995, Sanders (1997a; 1997b), Takagi et al., 1999 and other research groups (Gardano and Dabnichki, 2006; Kudo et al., 2008), and the drag and lift forces acting on hand models were measured. Using the coefficients of drag and lift forces measured in steady-state conditions, stroke analyses were conducted (Cappaert et al., 1995; Maglischo et al., 1986) with a quasi-static approach (Schleihauf, 1974). However, since the quasi-static approach neglects the effects of acceleration and transient motion, there exist large errors between the forces estimated with the quasi-static approach and the experiments in the transient condition (Pai and Hay, 1988). Sanders, 1999 developed a new method considering accelerations in the quasi-static approach, however the range of the velocity was limited from 0 to 0.6 m·s-1. In order to take account of the effect of transient motion, i.e. the acceleration and the rotation of a hand, experiments in transient conditions were carried out using rotating devices. Lauder and Dabnichki, 2005 successfully measured the transient torque acting on the rotating arm model for different elbow angles. However the torque acting on the hand could not be obtained, because the torque was measured only at the shoulder, and the measured torque was the one for the whole arm. To measure the fluid forces acting on a rotating hand, Kudo conducted an experiment with a rotating device (Kudo et al., 2007). The torque acting on a hand, except an arm part, was measured with a segmented model between the arm and the hand. Recently a robot arm (Nakashima and Takahashi, 2012) and a humanoid robots (Chung and Nakashima, 2012) have been developed to perform swimming strokes with high reproducibility.
An attempt to apply the CFD (Computational Fluid Dynamics) simulation to a flow around a swimmer’s hand has been made after late 1990s, because of the increasing capability of the CFD technique for complex geometries. The analysis of drag and lift forces acting on a hand in a steady-state condition was carried out using the commercial CFD software Fluent® by Bixler and Riewald, 2002. The pressure distribution and streamlines around a hand were visualized, and the computed fluid forces at various angles of attack agree well with experiments. Gardano and Dabnichki, 2006 simulated flow around an arm in a steady state condition with Fluent®, and the computed drag and lift forces agree well with the experimental data measured in a wind tunnel. Minetti et al., 2009 used CFD for the study of optimum finger spacing in a steady state condition, and the result shows that the drag coefficient can increase about 10% by the optimization. With the similar approach using Fluent® in a steady state condition, flows around a hand of an Olympic swimmer were analyzed with different thumb positions (Marinho et al., 2009) and with different degrees of the small-finger spread (Marinho et al., 2010), Marinho et al., 2011 also analyzed flow around a hand and forearm of an elite swimmer, and Bilinauskaite et al., 2013 investigated the influence of finger position and orientation of hand on drag and lift forces, although no validations were undertaken in these research.
As described above, although CFD has been applied to the analysis of flow around a hand, all of them are in steady state condition, except one study (Rouboa et al., 2006). In this study, the effect of acceleration on propulsive forces was evaluated through a simulation of a hand accelerating in a linear direction, although no validations were presented. To the authors’ knowledge, there have been no transient CFD simulations for a practical stroke considering the stroke path, acceleration and orientation of a hand. Development of such a CFD simulation is extremely important, because the hydrodynamic forces acting on the practical stroke can be calculated without using assumption of the quasi-static approach, and the stroke technique can be evaluated based on the hydrodynamic forces.
In this paper, we propose a stroke analysis system in which a stroke path and hand orientation, depicted in Figure 1 as an example, is obtained from two synchronized video cameras placed in a swimming pool, and these data is used for the CFD simulation. The effect of transient motion on the hydrodynamic forces is directly taken into account by the moving grid system in the CFD simulation, and assumptions such as the quasi-static approach are not used in the system. The objectives of the development are to evaluate the hydrodynamic forces acting on a swimmer’s hand and to investigate the influences of stroke path and orientation of hand on the thrust force in swimming competitions. The stroke analysis system is validated through the comparison with the experiments of the flow around a hand in a steady state condition and a transient condition. As a demonstration, strokes of two world-class swimmers are analyzed, and the hydrodynamic forces and the efficiency of thrust are compared between them. In case of the demonstration, the shape of the hand including the finger spread is not identical to that of the swimmer, because the three-dimensional shapes of the swimmers’ hand were not measured. In all simulation cases, only a hand is taken into account and other parts of body are neglected. No turbulence model is employed, which is explained in the following section.
Figure 1.
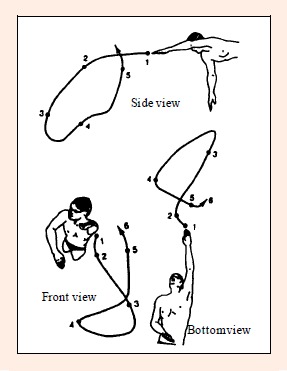
Stroke path of crawl stroke from space-fixed viewpoint (Maglischo 2003).
In the following section, the CFD method is described, and then, the procedure of the grid generation for a hand is given. The validations in steady-state and transient conditions are presented, followed by the simulations of the practical swimming-stroke. After the discussion, concluding remarks are given in the last section.
Methods
Numerical Method
A three-dimensional Navier-Stokes equations solver with an unstructured grid, SURF (Hino, 1997; Sato and Hino, 2010), is employed for the CFD simulation. The governing equations are three-dimensional incompressible Navier-Stokes equations, and spatial discretization is based on a finite-volume method on unstructured grids. The governing equations are solved on a space-fixed coordinate system referenced to a swimming pool or a model basin. A moving grid system is employed in order to simulate a stroke of a swimmer. The computational grid created for the region around the hand moves in accordance with a stroke path, as shown in Figure 2.
Figure 2.
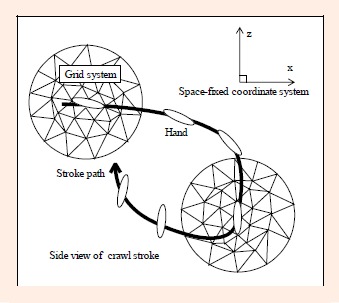
Moving grid system.
A solution domain is divided into cells. A cell shape is polyhedron: tetrahedron, hexahedron, prism or pyramid. The cell-centered layout is adopted, in which the flow variables (p, u, v, w) are defined at a center of each cell. Here, p is the pressure divided by the density of fluid, u, v and w are the flow velocities in the x, y and z directions, respectively. The control volume for each cell is the cell itself.
The artificial compressibility (AC) approach proposed by Chorin (Chorin, 1967) is employed to couple the velocity and pressure fields. The outstanding feature of AC approach is the numerical stability especially for a high-aspect-ratio cell. Usually, in AC approach the term  , where β is a parameter of AC and t the time. With this modification, however, the system of the equations recovers incompressibility only at the steady-state limit
  , and transient solution does not necessarily satisfy the continuity condition. This problem can be overcome by using the dual time frames, one for physical time and the other for pseudo time τ, and AC is introduced in the latter frame. At each physical time step, the pseudo time integration is used to calculate the pressure and velocity field so that the flow field satisfies the continuity equation.
The equations to be solved have the form as follows:
where
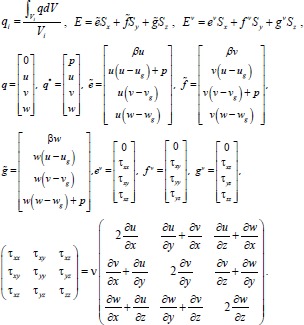 |
V is the cell volume, the subscript i the cell index, E and EV the inviscid and viscous fluxes, respectively, Sx, Sy, Sz the area vectors of the cell face of the x, y and z component, ? the stress tensor, and ? the kinematic viscosity. In this paper, v = 10-6 m·s-1 is used for all the simulation cases. (ug, vg, wg) are the grid velocities in the x, y and z directions, respectively.
The inviscid fluxes are evaluated by an upwind scheme based on the flux-difference splitting of Roe, 1986, and the viscous fluxes are discretized by the second-order-accurate, centered-differencing (Hino, 1998).
Time marching of Eq. (1) is made separately for the physical time t and for the pseudo time τ. The first-order-accurate Euler implicit scheme is used for τ. On the other hand, three-level-backward differencing is used for physical time marching in order to maintain second-order-accuracy in time. Thus, the equation to be solved can be expressed as:
 |
where the superscript n and m denote the physical and pseudo time step, respectively, Δt and Δτ are the physical and pseudo time increment, respectively. At each time step, only pseudo time marches until the solutions are converged, i.e. q*n+1,m+1 = q*n1,m or the continuity equation is satisfied.
No turbulence model is used in this study, because of the following three reasons: (i) the flow around a hand is considered to be in the laminar or transition regime and not fully turbulent due to the Reynolds number analysis, (the representative velocity is the maximum stroke speed (4.0 m·s-1) and the representative length is either the thickness of a hand (0.03 m) or the length of a palm and extended fingers (0.2 m), which yields Reynolds number from 105 to 8x10⁵), (ii) the influence of turbulence on the hydrodynamic forces acting on a hand is considered to be small because the flow is separated on the edges of a hand and this separation point is not dependent on Reynolds number and (iii) basically no turbulence model is available which can accurately predict unsteady flows with massive separation. Note that the Reynolds number is defined by:
where U and L are the representative velocity and length, respectively, and ? the kinematic viscosity of fluid. The validity of the approach, employing no turbulence model, is evaluated in the validation test cases which will be given in the following sections.
Computational Grid
A computational grid is required for the spatial discretization in a CFD simulation. First, the shape of a swimmer’s hand model, which is used for a validation case, is measured with the optical three dimensional scanner (Syberware Inc., Head & Face 3D Scanner), as shown in Figure 3. The scanned data is output in STL (STereoLithography) file format, and is imported by a grid generating software: Gridgen®. In the grid generating procedure, the grid on the hand surface is firstly created, Figure 4a, and then the three dimensional grid in the vicinity of the hand is generated by extruding the surface grid of the hand toward the outer side, Figure 4b. The extruding procedure is required in order to make a thin grid around the hand in order to resolve the flow boundary layer. Finally the whole computational grid composed of a spherical outer boundary is created, as shown in Figure 4c. The grid parameters are listed in Table 1. The diameter of the solution domain is set large enough to capture the wake field of the hand, and very thin grid is used in the vicinity of the hand; the average grid spacing in the normal direction to the hand is 89 μm.
Figure 3.
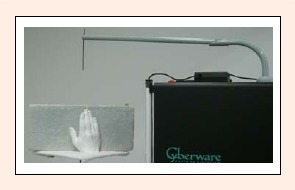
Measurement of hand-model geometry with optical three-dimensional scanner.
Figure 4.
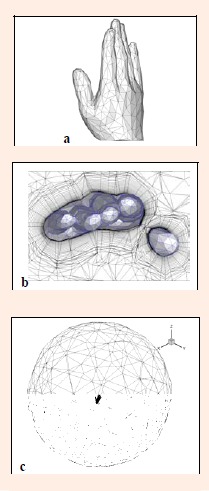
Computational grid (a) on the hand surface, (b) in the vicinity of the hand and (c) on the outer boundary.
Table 1.
Grid parameters for the validation case.
| Parameter | Value |
|---|---|
| Number of cell | 49585 |
| Diameter of computational domain (m) | 2.0 |
| Number of face on hand | 990 |
| Grid spacing normal to hand (m) | 8.9x10⁻⁵ |
Validations
In order to validate the numerical method, steady-state and transient simulations are carried out, and the computed results are compared with the experiments which were carried out at the University of Otago (Kudo et al., 2007; 2008). The hand models used for the experiments and the CFD simulation are the same, which was taken from a university-level competitive swimmer.
Steady-State Condition
In the experiment, the hydrodynamic forces acting on the hand model were measured by a load cell in a swimming flume (E-Type engineering Ltd., New Zealand) with the inflow velocity of 1.5 m·s-1. Five cases of experiment with different angles of attack α from 30° to 150° at every 30° were carried out, and the drag force Fdrag and the lift force Flift were measured. The definitions of the angle of attack, and the drag and lift forces are depicted in Figure 5. The inflow velocity of the flume was slower than the maximum hand velocity of the swimmers which will be presented in the following section of the stroke-analysis. Ideally, experiments for higher inflow velocity are desirable as the validation test cases, however the validations for higher velocity are left as a future task due to the difficulty of obtaining the additional experimental results in a short while.
Figure 5.
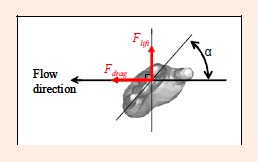
Definition of angle of attack α, drag force Fdrag and lift force Flift.
In the CFD simulation, 37 cases with different angles of attack, ranging from 0° to 180° at every 5°, are computed. The inflow velocity is the same as the measurement 1.5 m·s-1, and the drag force Fdrag and the lift force Flift are computed. The forces are non-dimensionalized by:
where ρ is the density of water, U the inflow velocity and A the maximum projected area of the hand model: A = 0.0148 m2. In the experiment (Kudo et al., 2008), two types of the hand model were used: the hand with and without a forearm. Since the CFD simulation deals with the hand without a forearm, the computed results are compared with the one without the forearm.
The comparison of the drag and lift coefficients between the computation and the experiment is shown in Figure 6. The computed results agree well with those of the experiment. From this result, it can be considered that the simulation method without turbulence model is reasonable with regard to the hydrodynamic forces for this condition.
Figure 6.
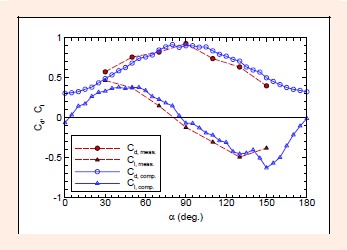
Comparison of the drag and lift coefficients between the measurement (Kudo et al., 2008) and the computation.
The computed pressure distribution on the hand and the streamlines for α = 30° are shown in Figure 7. Here, the pressure is non-dimensinalized by:
Figure 7.
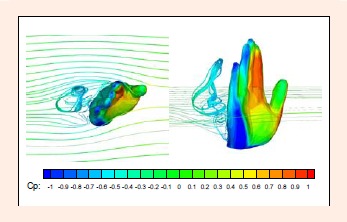
Distribution of the pressure coefficient on the hand and streamlines for the attack angle α = 30°.
Around the forefinger and the middle finger of the palm side, a high pressure region, approximately Cp = 0.9, is observed, and a large separation vortex exists behind the hand.
Transient Condition
The simulation presented in this section is in a transient condition involving acceleration and rotation of the hand motion, thus the validation becomes more challenging than the steady-state condition. As a validation test case for the transient condition, the experiment undertook at the University of Otago (Kudo et al., 2007) is employed. The schematic of the experiment is shown in Figure 8. The arm model rotated due to the gravity of the weight through the chain, and the drag forces acting on the hand were measured with the load cell. Note that the hydrodynamic force acting on the arm part was excluded, and only the force acting on the hand was measured using a segmented model. The angle of arm with respect to the horizontal line is defined as the stroke angle φ, and measured with a potentiometer. The experimental case using 10 kg weight with the angle of attack α = 90° is selected for the validation case. The maximum velocity of the hand is 4.1 m·s-1, which is similar level to that of the practical swimmer’s stroke described in the following section.
Figure 8.
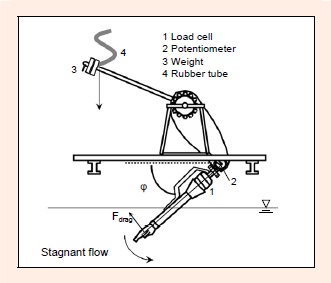
Schematic of the experiment (Kudo et al., 2007).
The time history of the stroke angle φ measured in the experiment is used as the input data for the CFD simulation; the position and the orientation of the hand are prescribed in the simulation. The time increment used in the computation is 0.0002 s. The computed drag force Fdrag as a function of time is compared with the experimental data in Figure 9. Although at the initial stage of the simulation, 0 ≤ t ≤ 0.1 s, oscillation is observed for the computed Fdrag, good agreements are obtained after this period. This result indicates that the simulation method for transient condition without turbulence model is reasonable with regard to the hydrodynamic force. The discrepancy at the initial stage is considered to be caused by the abrupt acceleration in the beginning of the simulation.
Figure 9.
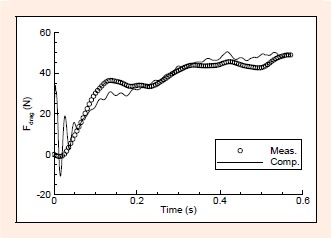
Comparison of the drag force Fdrag between the measurement (Kudo et al., 2007) and the computation.
Simulation of Swimming Stroke
In this section, we propose a stroke-analysis system based on the CFD simulation. The main features of the system are (i) only two synchronized underwater video cameras are required to capture a stroke path and a hand orientation, and (ii) the transient hydrodynamic force can be directly computed with CFD, without using assumptions such as the quasi-steady state model. As a demonstration, the strokes of two swimmers in a swimming competition are analyzed. The two swimmers are denoted as the swimmer A and B hereafter.
Stroke Path and Hand Orientation
In the final race of the 200 m free style of 2001 World Aquatics Championships, the two male swimmers swam in adjacent lanes, and the swimming strokes were recorded by two video cameras: one in front and the other at side. The front camera was located at the bottom of the swimming pool just below the lane marker, and the side camera was set at an underwater window of the pool. The shutter speed and the resolution of the digital video cameras were set to 1/60 s and 640x480 pixels, respectively. The video images around the 175 m point in the 200 m race are used for the CFD analysis. The sample images taken by the cameras at a same instant are shown in Figure 10. The swimmer A is the lead swimmer with the black full-body swimsuit, and the swimmer B is the second swimmer with the purple long spats. The swimmer A broke his own world record of 200 m freestyle in this competition, and the swimmer B was the world-record holder of 100 m freestyle at that time. The average advancing speeds of the swimmer A and B around the 175 m point were 1.84 and 1.75 m·s-1, respectively. From the movies taken by the two cameras, three-dimensional positions of the tip of the middle finger, the bases of the thumb and the little finger, and the wrist were calculated by the direct linear transformation method (Takagi, 1997). A digitizing software MovieDgitizer (Miyaji and Abbott, 2001), which can run on Mathematica®, was used to obtain the position from the movie. The maximum error of the digitized position is about 0.5 cm. The time histories of the hand position and orientation were computed from the trajectories of these points. This process was a time-consuming work, because the positions of the points on the hand were manually detected from the images. The frequency of the video image is 30 frames per second, while the frequency required for the CFD analysis is about 4400 frames per second. Thus, an interpolation is used to obtain the stroke paths for the CFD analysis. In the same way as the transient simulation shown in the previous section, the time histories of the hand position and orientation are given as an input data for the CFD simulation.
Figure 10.
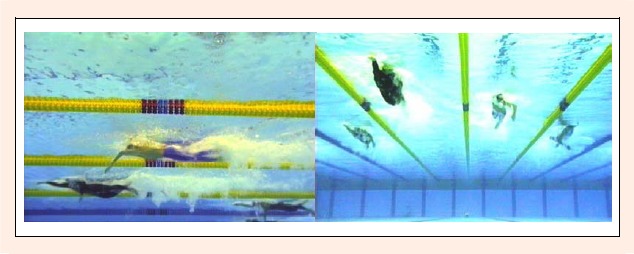
Images recorded by the side camera (left) and the front camera (right) at the same instance. The hand position and orientation are calculated from the images with direct linear transformation method (Takagi, 1997). The swimmer A is the lead swimmer with the black full-body swimsuit, and B is the second swimmer with the purple long spats.
Figure 11 shows the definition of coordinate system with origin z = 0 denoting the still water level. The coordinate system is fixed to space, and swimmers advance in the positive x direction. The two swimmers’ stroke paths, the trajectories of the tip of the middle finger of the left hand, are compared in Figure 12. The stroke patterns of these swimmers are obviously different: the stroke path of the swimmer A is long in horizontal direction, while that of the swimmer B is deep in the vertical direction. In terms of the y direction (lateral direction), the stroke path of the swimmer A is narrower than that of the swimmer B. Figure 13 shows the time history of the stroke velocity which is calculated from the position of the middle-finger tip. The stroke velocities Uhand, Vhand and Whand are the x, y and z components of the velocity of the middle-finger tip, and Vhand is the magnitude of the stroke velocity. The magnitude of the stroke velocity Vhand of the swimmer B reaches almost 4 m·s-1 in the maximum, while that of the swimmer A is 3 m·s-1.
Figure 11.
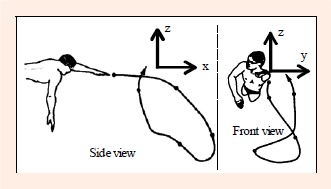
Definition of coordinate system.
Figure 12.
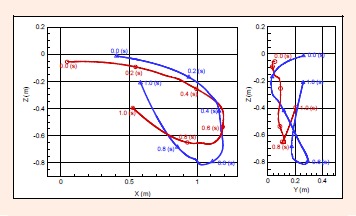
Comparison of stroke path of left hand between the swimmers A (red) and B (blue). These stroke paths are the trajectory of the tip of the middle finger.
Figure 13.
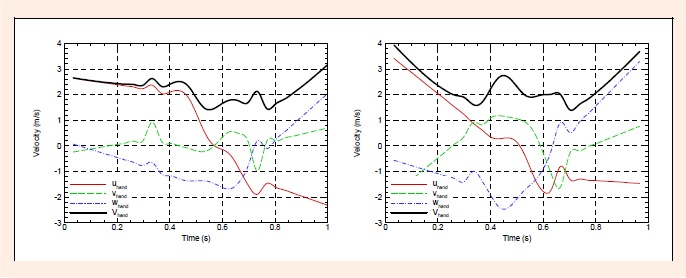
Stroke velocity of the swimmer A (left) and B (right). Velocity is calculated from the position of the tip of middle finger. uhand , vhand and whand are the x, y and z components of the stroke velocity, and Vhand is the magnitude of it.
Conditions of Simulation
Since the hand shapes of these swimmers were not measured, the same hand shape shown in Figure 14(left) is used for the both swimmers. The fingers are spread, the hand is cut at the wrist and the cut section is tapered in order to avoid a flow separation around it. Although the main purpose of this paper is to establish a stroke-analysis system based on CFD simulations, more realistic hand shape and finger position ought to be employed in order to simulate flow fields more practically. A recent research about finger spacing (Minetti et al., 2009) shows that the drag coefficient can be increased about 10% by the optimal finger position, thus the present CFD results may change in the similar order by changing the finger position. The hand shape used in the validation test case is not used for the stroke simulation, because the size of the hand is obviously different from the swimmer A and B. Further investigation regarding the hand shape and finger position is required in the future. The computational grid is again made with Gridgen®, and the grid parameters are listed in Table 2. The grid spacing normal to the hand surface is set at small value 76 μm, to resolve the flow boundary layer. The time increment used for the simulation is 0.00023 s.
Figure 14.
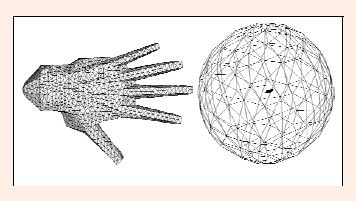
Computational grid used for the swimmer A and B. Fingers are opened and wrist is tapered.
Table 2.
Grid parameters for the swimming stroke simulation
| Parameter | Value |
|---|---|
| Number of cell | 59401 |
| Diameter of computational domain (m) | 2.5 |
| Number of face on hand | 3682 |
| Grid spacing normal to hand (m) | 7.6x10⁻⁵ |
Results
Instantaneous pressure distribution on the hand of the both swimmers at every 0.1 s is shown in Figure 15. In the experiment, measuring the distribution of pressure on a hand is extremely difficult, however, in the CFD analysis, pressure fields can be straightforwardly visualized with post-process software. The hydrodynamic forces acting on the hand of the swimmer A and B are shown in Figure 16. Fx, Fy and Fz are the hydrodynamic forces acting on the hand in the x, y and z directions, respectively. Note that the positive Fx indicates the thrust force. To elucidate the influences of the stroke path and the orientation of the hand on the hydrodynamic forces, the hand shape and the force vectors are shown together in Figure 17.
Figure 15.
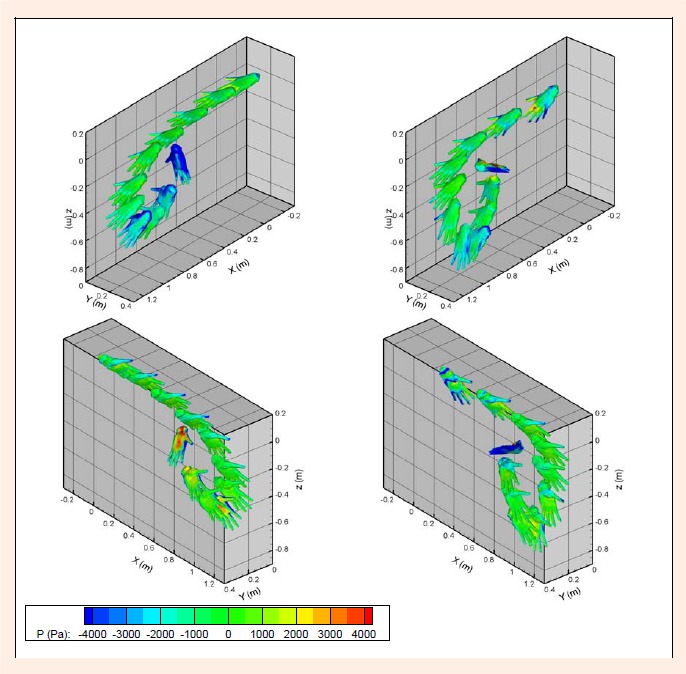
Instantaneous pressure distribution on the hand of the swimmer A (left column) and B (right column) from the different viewpoints. Time increment is 0.1 s.
Figure 16.
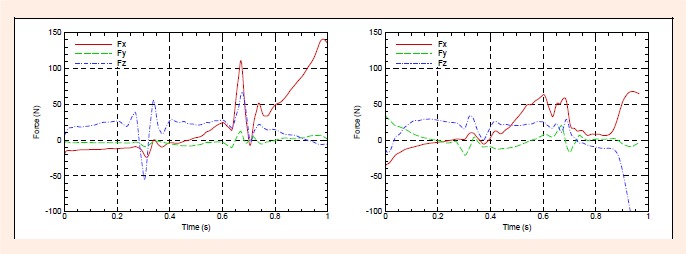
Hydrodynamic forces acting on the hand of swimmer A (left) and B (right).
Figure 17.
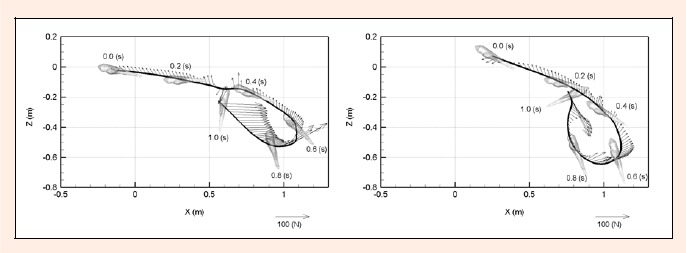
Stroke paths and hydrodynamic force vectors acting on the hand of swimmer A (left) and B (right). The stroke path is the trajectory of the center of the hand.
The discussion is focused on the stroke velocity and the hydrodynamic force, especially uhand and Fx. Here, we define the terms, the first half and the latter half of a stroke as follows. The first half of a stroke is the phase of a stroke in which the hand moves to the positive x direction uhand ≥ 0, and the latter half of a stroke is the phase in which the hand moves to the negative x direction uhand < 0. In the swimming technical terms, catch, pull and finish are widely used to express the stroke phases. However these phases are defined from swimmers’ point of view, and do not link to fluid dynamics. Since we need to discuss hydrodynamic forces from the viewpoint of the fluid dynamics, we define the terms, first half and latter half, different from the swimming technical terms. The border between the first half and the latter half for swimmer A and B is 0.55 and 0.52 s, respectively.
The First Half of the Stroke
During the most period of the first half, both swimmers continue to obtain positive Fz, which can act in the same direction as the buoyancy force, as shown in Figures 16-17. The thrust force Fx is negative at the beginning, however, it becomes positive (the thrust force is generated) at the last stage of the first half, although the hand still advances forward (uhand > 0). Such a condition, uhand > 0 and Fx > 0, is observed between the time 0.5 s and 0.55 s for the swimmer A, and between 0.4 s and 0.52 s for the swimmer B. Note that the thrust force Fx is the x component of the hydrodynamic force acting on the hand, and it consists of the drag and lift forces. In equation, it can be written as:
where Fx,drag and Fx,lift are the thrust forces due to drag and lift forces, respectively. Note that Fx,drag is always negative during the first half, because the hand advances forward (uhand > 0). The computed result Fx > 0 in the first half indicates that Fx,lift is positive, i.e. the swimmers use the lift force for thrust in this period.
The Latter Half of the Stroke
A remarkable difference between the swimmer A and B is observed in the thrust force Fx during the latter half of the stroke. The swimmer A accelerates continuously his hand in the backward (negative x) direction after t = 0.6 s (Figure 13left), and the thrust force of the swimmer A continues to increase during that period (Figure 16left). On the almost same after t = 0.7 s (Figure 13right). Consequently, the thrust force of the swimmer B becomes smaller than that of the swimmer A after t = 0.7 s (Figure 16right), because of the loss of the acceleration effect. As shown in Figure 17(left), the force vectors of the swimmer A point to the advancing direction after t = 0.6 s, indicating that the swimmer A controls the stroke path and the orientation of his hand in such a way that the resultant hydrodynamic force directs to the advancing direction. In contrast, the force vectors of swimmer B during the latter half of the stroke cannot point to the advancing direction as shown in Figure 17(right), because the hand is not moved to the negative x direction so much.
The Efficiency of the Stroke
The thrust efficiency η is defined as follows:
where ave(Fx) is the average of the thrust force Fx in time, ave(|Fx|) is the average of the magnitude of the resultant force |F| in time, where |F| is defined as
. Assuming that the stroke of the right and left hands are symmetric, ave(Fx) and ave(|F|) are defined as:
|
|
where Tstart and Tend are the time when the swimmer starts the left hand stroke and finish the underwater stroke, respectively, Tstroke is the period of one stroke including the recovery phase.
The thrust force efficiency of the swimmer A and B is compared in Table 3. The time-averaged resultant force ave(Fx) of the swimmer A is larger than that of the swimmer B, and the thrust efficiency of swimmer A is also higher than that of swimmer B. These results mean that the swimmer A can output larger force than the swimmer B, and the stroke technique of the swimmer A is superior to the swimmer B.
Table 3.
Comparison of forces and thrust efficiency between Swimmer A and B.
| Item | A | B |
|---|---|---|
| Average of swimmer’s advancing speed (m·s-1) | 1.84 | 1.75 |
| Average of resultant force, ave(|F|), (N) | 63.9 | 52.4 |
| Average of thrust force, ave(|Fx|), (N) | 32.4 | 23 |
| Thrust efficiency, η (%) | 50.7 | 43.9 |
Discussion
For the purpose of evaluating the hydrodynamic forces acting on a swimmer’s hand in a swimming competition, we developed a stroke analysis system based on the CFD simulations. Two validation cases were carried out and the stroke analysis was conducted for two swimmers in the swimming competition. The first validation case was the flows around a hand in steady state condition with different angles of attack, and good agreement is obtained for the drag and lift forces between the experiments and the CFD results, as shown in Figure 6. This result indicates that the CFD simulation employing no turbulence model has enough accuracy with regard to the drag and lift forces. Bixler and Riewald, 2002 carried out the validation of the CFD code for the same kind of flow, the flow around a hand in steady state condition, however the hand models used for the CFD simulation and the experiment were different. Thus the comparison is not considered as the rigorous validation, although good agreement was obtained between the experiments and the CFD results. In the validation case of Gardano and Dabnichki, 2006, an identical arm model was used for the CFD simulation and the wind tunnel experiment. Unfortunately the turbulence model used for the simulation was not explained, however very good agreement was achieved between the CFD results and the experiments. The good agreement in Gardano’s case and in our case shows the capability of CFD simulation for the prediction of the hydrodynamic forces acting on a hand or an arm in steady state condition.
The second validation case was the flow around a hand in a transient condition. The result of CFD gives good agreement with the experiment as shown in Figure 9, which proves that the moving grid system used in the CFD simulation can accurately take into account the effect of the acceleration of the hand on the hydrodynamic forces. To the authors’ knowledge, our validation is the first case of the transient flow around a swimmer’s hand using the CFD simulation. Since the quasi-steady calculations cannot account for the effect of the transient motion as mentioned by many researchers (e.g. Rouboa et al., 2006, we emphasize that the CFD simulation must be used for the stroke analysis.
Followed by the two validation cases, the stroke analysis for two world class swimmers were carried out as shown in Figures 15-17. The stroke path and the orientation of the hand were obtained from the images recorded by the two synchronized video cameras, and the transient hydrodynamic forces acting on the hand in the swimming competition were computed with CFD. To the authors’ knowledge, this is the first stroke analysis based on the CFD simulation, in which transient motion is taken into account without using the quasi-static assumption. The stroke analyses based on a quasi-static assumption were presented in Gourgoulis et al., 2008 and Bilinauskaite et al., 2013. In both cases, three-dimensional stroke paths were obtained from the video images taken from different camera angles. Gourgoulis et al., 2008 used the hydrodynamic coefficients measured by Sanders, 1999, and Bilinauskaite et al., 2013 used the coefficients computed by the CFD simulation. In these researches, the hydrodynamic forces in a crawl stroke were predicted, and the applicability of the quasi-static model for the stroke analysis was discussed. Nonetheless many discussions were made with regard to the effects of acceleration and orientation of a hand, the estimated hydrodynamic forces include the error resulting from the neglect of the transient effects. For instance, the thrust force should be theoretically underestimated, when the hand accelerates in the rear direction during the pull and push phases, because the added mass, which is resulting from the acceleration, is not taken into account properly.
Because of the capability of the CFD simulation for predicting hydrodynamic forces under transient condition, we expect that CFD simulations will be widely used for the stroke analysis as a replacement of the quasi-static model in the near future. In this paper, the validation of the stroke analysis was not carried out, because it is not straightforward to measure the hydrodynamic forces acting on a hand during the stroke. However, in the near future, the validation of the stroke analysis for a swimmer can be done using a swimming humanoid robot (e.g. Chung and Nakashima, 2012), since the measurement of the hydrodynamic foreces is easier for a robot than for a human. Besides the validation, optimizations of swimming strokes can be performed using the humanoid robot and the stroke analysis system based on the CFD simulation, which gives valuable information to athletes and coaches.
Conclusion
A practical stroke-analysis system based on CFD (Computational Fluid Dynamics) simulations has been developed in order to analyze the hydrodynamic forces acting on a swimmer’s hand. A CFD method using the moving grid system with unstructured grid is employed to take into account transient flow condition without using assumptions such as a quasi-static approach. First, the developed method was validated by comparison with experiments in both steady-state and transient conditions, and the computed results agreed well with the experiments in both cases. As a next step, we carried out practical stroke-analyses. The stroke path and the orientation of a hand were obtained from the images recorded by the two synchronized video cameras, located at side and in front, with the direct linear transformation method. Using the data of the stroke path and the hand orientation, the hydrodynamic force and the thrust efficiency can be computed with CFD. As a demonstration of the stroke-analysis system, two world class swimmers’ strokes were analyzed. The stroke of the faster swimmer, who advanced at speed of 1.84 m·s-1 during the analyzing period, showed larger thrust and higher thrust efficiency than that of the slower swimmer, advanced at speed of 1.75 m·s-1, because the faster swimmer strokes his hand in such a way that the resultant hydrodynamic force acting on the hand points forward (the advancing direction) with continuous acceleration, especially at the latter half of the stroke.
Acknowledgements
This work was partly supported by Grant-in-Aid for Young Scientists (B) No.18700523, the Ministry of Education, Culture, Sports, Science and Technology, Japan. The authors thank Mr. Sugimoto of the University of Tsukuba for providing us the swimmers’ stroke data.
Biographies

Yohei Sato
Employment
Scientist, Paul Scherrer Institute, Switzerland.
Degree
PhD
Research interests
Computational fluid dynamics for sports and turbulent free-surface flow.
E-mail: yohei.sato@psi.ch

Takanori Hino
Employment
Professor, Yokohama National University, Japan.
Degree
PhD
Research interests
Computational fluid dynamics in marine applications
E-mail: hino@ynu.ac.jp
References
- Berger M.A.M., de Groot G., Hollander A.P.(1995). Hydrodynamic drag and lift forces on human hand/arm models. Journal of Biomechanics 28, 125-133 [DOI] [PubMed] [Google Scholar]
- Bilinauskaite M., Mantha V.R., Rouboa A.I., Ziliukas P., Silva A.J.(2013). Computational fluid dynamics study of swimmer’s hand velocity, orientation, and shape: contributions to hydrodynamics. BioMed Research International 2013, 14. [DOI] [PMC free article] [PubMed] [Google Scholar]
- Bixler B., Riewald S.(2002). Analysis of a swimmer’s hand and arm in steady flow conditions using computational fluid dynamics. Journal of Biomechanics 35, 713-717 [DOI] [PubMed] [Google Scholar]
- Cappaert J.M., Pease D.L., Troup J.P.(1995). Three-dimensional analysis of the men’s 100-m freestyle during the 1992 Olympic games. Journal of Applied Biomechanics 11, 103-112 [Google Scholar]
- Chorin A.J.(1967). A numerical method for solving incompressible viscous flow problems. Journal of Computational Physics 2, 12-26 [Google Scholar]
- Chung C., Nakashima M.(2012). Measurement system of fluid force in human swimming using a swimming humanoid robot. In: Proceedings of Fifth International Symposium on Aero Aqua Bio-mechanisms, 25-28 August, Taipei, Taiwan. 174-179 [Google Scholar]
- Gardano P., Dabnichki P.(2006). On hydrodynamics of drag and lift of the human arm. Journal of Biomechanics 39, 2767-2773 [DOI] [PubMed] [Google Scholar]
- Gourgoulis V., Aggeloussis N., Vezos N., Kasimatis P., Antoniou P., Mavromatis G.(2008). Estimation of hand forces and propelling efficiency during front crawl swimming with hand paddles. Journal of Biomechanics 41, 208-215 [DOI] [PubMed] [Google Scholar]
- Hino T.(1997). A 3D unstructured grid method for incompressible viscous flows. Journal of the Society of Naval Architects of Japan 182, 9-15 [Google Scholar]
- Hino T.(1998). Navier-Stokes computations of ship flows on unstructured grids. In: Proceedings of 22nd Symposium on Naval Hydrodynamics, 9-14 August, Washington D.C., USA. 463-475 [Google Scholar]
- Kudo S., Vennell R., Wilson B., Waddell N., Sato Y.(2008). Influence of surface penetration on measured fluid force on a hand model. Journal of Biomechanics 41, 3502-3505 [DOI] [PubMed] [Google Scholar]
- Kudo S., Wilson B., Takagi H.(2007). The error of a quasi-static approach in predicting fluid forces on the hand in unsteady conditions. Japanese Journal of Sciences in Swimming and Water Exercise 10, 1-11 (In Japanese: English abstract) [Google Scholar]
- Lauder M. A., Dabnichki P.(2005). Estimating propulsive forces-sink or swim? Journal of Biomechanics 38, 1984-1990 [DOI] [PubMed] [Google Scholar]
- Maglischo C.W., Maglischo E.W., Higgins J., Hinricks R., Luedtke D., Schleihauf R.E., Thayer A.(1986). A biomechanical analysis of the 1984 U.S. Olympic swimming team: The distance freestylers. Journal of Swimming Research 2, 12-16 [Google Scholar]
- Maglischo E.W.(2003). Swimming fastest. Campaign, Human Kinetics [Google Scholar]
- Marinho D., Silva A., Reis V., Barbosa T., Vilas-Boas J., Alves F., Machado L., Rouboa A.(2011). Three-dimensional CFD analysis of the hand and forearm in swimming. Journal of Applied Biomechanics 27, 74-80 [DOI] [PubMed] [Google Scholar]
- Marinho D.A., Barbosa T.M., Reis V.M., Kjendlie P.L., Alves F.B., Vilas-Boas J.P., Machado L., Silva A.J., Rouboa A.I.(2010). Swimming propulsion forces are enhanced by a small finger spread. Journal of Applied Biomechanics 26, 87-92 [DOI] [PubMed] [Google Scholar]
- Marinho D.A., Rouboa A.I., Alves F.B., Vilas-Boas J.P., Machado L., Reis V.M., Silva A.J.(2009). Hydrodynamic analysis of different thumb positions in swimming. Journal of Sports Science & Medicine 8, 58-66 [PMC free article] [PubMed] [Google Scholar]
- Minetti A.E., Machtsiras G., Masters J.C.(2009). The optimum finger spacing in human swimming. Journal of Biomechanics 42, 2188-2190 [DOI] [PubMed] [Google Scholar]
- Miyaji C., Abbott P.(2001). MathLink: Network programming with MATHEMATICA. Cambridge, UK, Cambridge University Press [Google Scholar]
- Nakashima M., Takahashi A.(2012). Clarification of unsteady fluid forces acting on limbs in swimming using an underwater robot arm. Journal of Fluid Science and Technology 7, 100-113 [Google Scholar]
- Pai Y., Hay J.G.(1988). A hydrodynamic study of the oscillation motion in swimming. International Journal of Sport Biomechanics 4, 21-37 [Google Scholar]
- Roe P.L.(1986). Characteristic-based schemes for the Euler equations. Annual Review of Fluid Mechanics 18, 337-365 [Google Scholar]
- Rouboa A., Silva A., Leal L., Rocha J., Alves F.(2006). The effect of swimmer’s hand/forearm acceleration on propulsive forces generation using computational fluid dynamics. Journal of Biomechanics 39, 1239-1248 [DOI] [PubMed] [Google Scholar]
- Sanders R.H.(1997a). Extending the ’Schleihauf’ model for estimating forces produced by a swimmer’s hand. Proc. XII FINA World Congress on Sports Medicine, 12-15 April Goteborg, Sweden. 421-428 [Google Scholar]
- Sanders R.H.(1997b). Hydrodynamic characteristics of a swimmer’s hand with adducted thumb: Implications for technique. In: Proceedings of XII FINA World Congress on Sports Medicine, 12-15 Apr., Goteborg, Sweden. 429-434 [Google Scholar]
- Sanders R. H.(1999). Hydrodynamic characteristics of a swimmer’s hand. Journal of Applied Biomechanics 15, 3-26 [Google Scholar]
- Sato Y., Hino T.(2010). CFD simulation of flows around a swimmer in a prone glide position. Japanese Journal of Sciences in Swimming and Water Exercise 13, 1-9 [Google Scholar]
- Schleihauf R.E.(1974). A biomechanical analysis of freestyle. Swimming Technique 11, 89-96 [Google Scholar]
- Takagi H.(1997). A quantitative analysis in a sense of catching water for competitive swimmer. Journal of Japan Society for Precision Engineering 63, 495-498 [Google Scholar]
- Takagi H., Shimizu Y., Kodan N.(1999). A hydrodynamic study of active drag in swimming. JSME International Journal. Ser. B, Fluids and Thermal Engineering 42, 171-177 [Google Scholar]


