Abstract
Background:
In 2010, there were an estimated 15 million preterm births worldwide (<37 wk gestation). Survivors are at risk of adverse outcomes, and burden estimation at global and regional levels is critical for priority setting.
Methods:
Systematic reviews and meta-analyses were undertaken to estimate the risk of long-term neurodevelopmental impairment for surviving preterm babies according to the level of care. A compartmental model was used to estimate the number of impaired postneonatal survivors following preterm birth in 2010. A separate model (DisMod-MR) was used to estimate years lived with disability (YLDs) for the global burden of disease 2010 study. Disability adjusted life years (DALYs) were calculated as the sum of YLDs and years of life lost (YLLs).
Results:
In 2010, there were an estimated 13 million preterm births who survived beyond the first month. Of these, 345,000 (2.7%, uncertainty range: 269,000–420,000) were estimated to have moderate or severe neurodevelopmental impairment, and a further 567,000 (4.4%, (445,000–732,000)) were estimated to have mild neurodevelopmental impairment. Many more have specific learning or behavioral impairments or reduced physical or mental health. Fewest data are available where the burden is heaviest. Preterm birth was responsible for 77 million DALYs, 3.1% of the global total, of which only 3 million were YLDs.
Conclusion:
Most preterm births (>90%) survive without neurodevelopmental impairment. Developing effective means of prevention of preterm birth should be a longer term priority, but major burden reduction could be made immediately with improved coverage and quality of care. Improved newborn care would reduce mortality, especially in low-income countries and is likely to reduce impairment in survivors, particularly in middle-income settings.
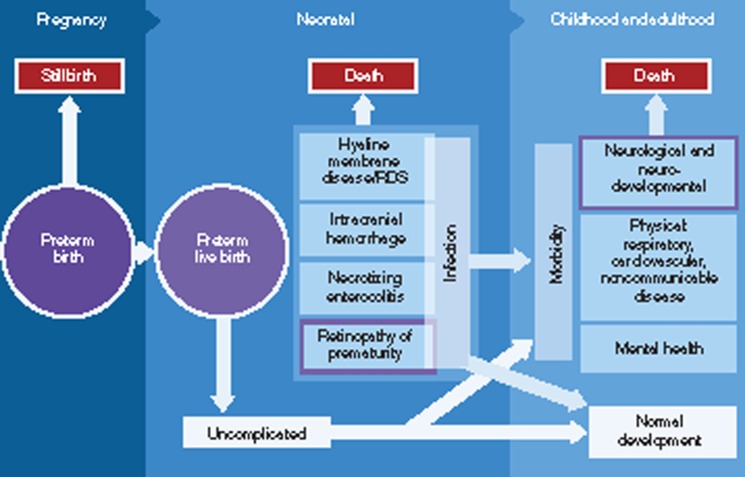
In 2010, there were an estimated 15 million preterm births worldwide, before 37 completed weeks of gestation (1). This represents a major burden worldwide, as preterm birth is associated with many specific acute complications of immaturity including respiratory distress syndrome, intracranial hemorrhage, necrotising enterocolitis, and retinopathy of prematurity (ROP) (Figure 1 and Table 1). Direct complications of preterm birth were responsible for an estimated 35% of the world's 3 million neonatal deaths in 2010, making preterm birth the second most common cause of death in children under-five after pneumonia (2). Preterm birth also increases the risk of death due to other causes, especially neonatal infections (3,4). Hypothermia and malnutrition secondary to poor feeding further increase vulnerability. In almost all high- and middle-income countries, preterm birth is the leading cause of child deaths. The scale of this problem has recently been highlighted in the first national estimates of preterm birth prevalence and the in the linked “Born Too Soon” report which underlined that the vast majority of these deaths occur in low–middle-income settings but are preventable without intensive care (1,5).
Figure 1.
Disease schema for sequelae of preterm birth.
Table 1. Definitions.
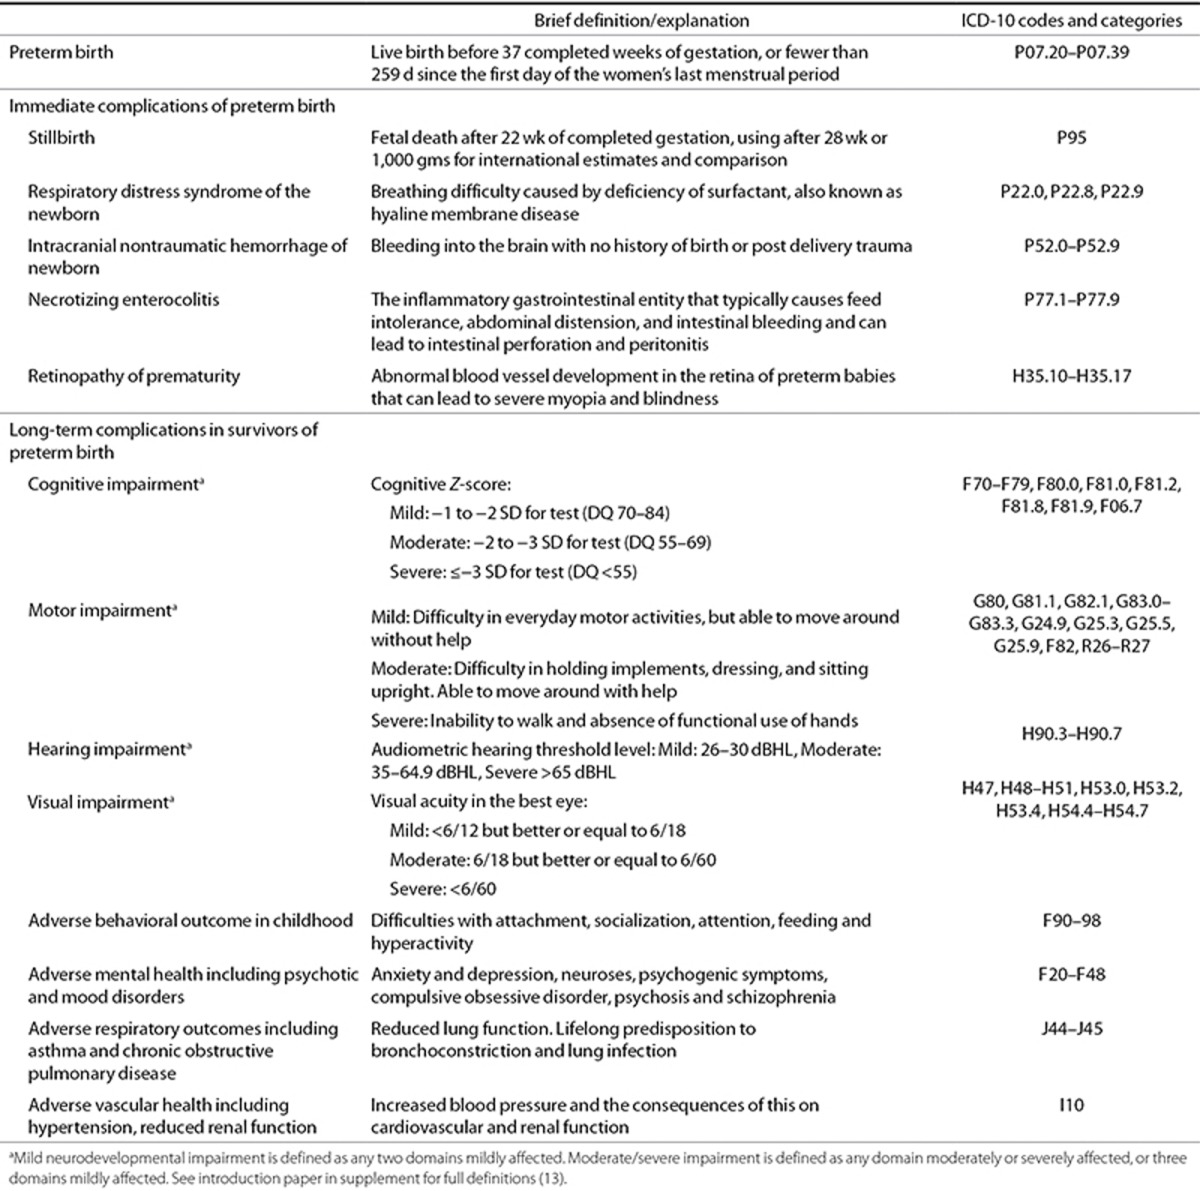
In addition to its contribution to mortality, preterm birth can have lifelong effects on neurodevelopment, with increased risks of cerebral palsy and impaired learning, mental disorders, and physical health, which contribute to the prematurity-related burden of chronic disease in adulthood (6) (Figure 1 and Table 1). The risks are higher in those preterm who are also small for gestational age, or with associated infection (7). The economic cost of preterm birth is high in terms of neonatal intensive care, continuing healthcare, and special educational needs. The societal cost is also high, with many families experiencing the sudden loss of a preterm baby or a stressful hospital stay, sometimes for months, followed by lifelong effects (5).
This paper presents regional and global estimates of specific outcomes associated with preterm birth, including gestation-specific case fatality and neurodevelopmental impairment. Estimates of ROP and visual impairment following preterm birth are presented in a further paper in the supplement (8). The global burden of disease (GBD) studies (9,10,11) underline the major contribution of preterm birth; however, details of the inputs, methods used, estimates of the proportions of live births affected, survival by gestational age, and risk of disability have not been published since the 1996 GBD version (12). The Expert team for preterm birth involved in GBD2010 overlaps with the author group on this paper, and we discuss the parameter inputs and regional and global estimates of specific outcomes associated with preterm birth in GBD2010. In addition, since the inputs were finalized for GBD2010, further data have been published, and additional data sets became available for analyses, for example, to improve the coverage of care assumptions used throughout this supplement. This is in the spirit of continually improving the input data. Where the inputs or methods differ from GBD, this will be noted (13).
Methods
Definitions
The World Health Organization (WHO) defines preterm birth as any birth before 37 completed weeks of gestation (fewer than 259 d since the first day of the women's last menstrual period (14). This is commonly subdivided based on gestational age: extremely preterm (<28 wk), very preterm (28–31 wk), and moderate and late preterm (32–36 wk), since decreasing gestational age is associated with increasing mortality, disability, and a greater requirement for intensive neonatal care if survival is to be assured, with higher associated costs.
Estimating the burden of preterm birth is challenging due to the paucity of gestational age–specific data. Given the relatively recent recognition of the importance of gestational age rather than birth weight in determining outcome, most studies have presented data by birth weight alone. Widespread early ultrasound scanning has improved gestational age assessment in most high-income and many middle-income countries. However, this requires skilled technicians equipment and is most accurate when undertaken in the first trimester, limiting its use in many low- and middle-income settings. Without early ultrasound screening, gestational age assessment uses less-accurate methods based on last menstrual period or newborn physical characteristics (15). When gestational age data were not available, we used commonly applied birth weight proxies, namely, <1,000 g for extremely preterm birth (<28 wk) and 1,000 to <1,500 g for very preterm birth (28–31 wk) (Supplementary Information online).
We estimated long-term (present at 2–5 y of age) mild and moderate/severe neurodevelopmental impairment among postneonatal survivors of preterm birth. See Table 1 and the methods paper of this supplement for full definitions (13).
Data Searches and Meta-Analyses
A systematic literature review was undertaken of the main online literature databases including Pubmed/Medline, Embase, CAB abstracts, Popline, Web of Science, Cumulative Index to Nursing and Allied Health (CINAHL) Latin American and Caribbean Health Science (LILACS), and WHO Regional library databases, applying the general search strategy described in the methods paper of this supplement (13). Search terms used included multiple variants of terms covering the following areas “preterm/premature” and “birth/labor” or “newborn/infant,” “mortality/death,” and “outcome/impairment” and used Medical Subject Headings terms when available (see Supplementary Information online for full details of search terms, dates, and inclusion criteria). Snowball searching was used to identify additional studies by screening the reference lists of retrieved studies. Data were abstracted if the study fulfilled the inclusion criteria, regardless of the year of birth of the cohort. However, in view of the rapid changes and progress in neonatal intensive care in low mortality settings over the past decades, especially for the preterm baby, only studies with birth cohorts with a median year of 2000 or later were included in the main analysis. Data on the outcome of preterm-born neonates with congenital abnormalities were excluded.
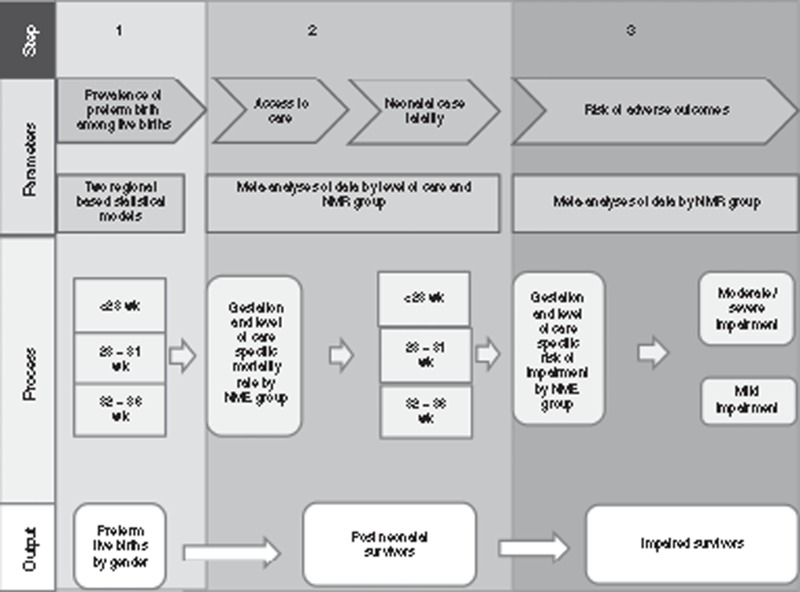
Standard meta-analysis techniques were used to obtain summary estimates of the parameters of interest including neonatal CFR, gender, and risk of impairment by gestational age and access to care (Figure 2). Heterogeneity across studies was assessed using I2 and the χ2 test. Where evidence of heterogeneity was present (I2 > 70% or P < 0.05), a random-effects meta-analysis model was used.
Figure 2.
Compartmental model: Parameters required and methods for estimation of the global burden of impairment related to preterm birth for the estimation of impairment after preterm birth.
Overview of Modeling Approach
A three-step compartmental model was constructed, using the estimated input parameters to estimate neurodevelopmental impairment among postneonatal survivors of preterm birth (Figure 2) (13). This approach differs from GBD2010 in that the focus is on 2010 without estimating time trends for the condition or for sequelae. The methods applied in GBD are summarized in the methods paper of this supplement and detailed elsewhere (13,16). In step 1, we estimated the prevalence of preterm birth among live births, by sex, as this is a determinant of mortality and morbidity outcomes. In step 2, we estimated the number of postneonatal survivors, and in step 3, the number of these survivors who were impaired (Figure 2). The steps of the compartmental model were applied in sequence for the live births in each country with more than 10,000 births for the year 2010 (17). Unpublished data for the same live birth series was used to estimate the number of live births by sex. All results are presented at the regional level using the GBD super-regional grouping (13).
We quantified the uncertainty surrounding these estimates by taking 1,000 random draws of the input parameters at each step, assuming a normal distribution with mean equal to the point estimate of the parameter and SD equal to the estimated standard error of the parameter. We summed the data at worldwide or regional level for each draw and present the 2.5th and 97.5th percentiles of the resulting distributions as the uncertainty range.
Results
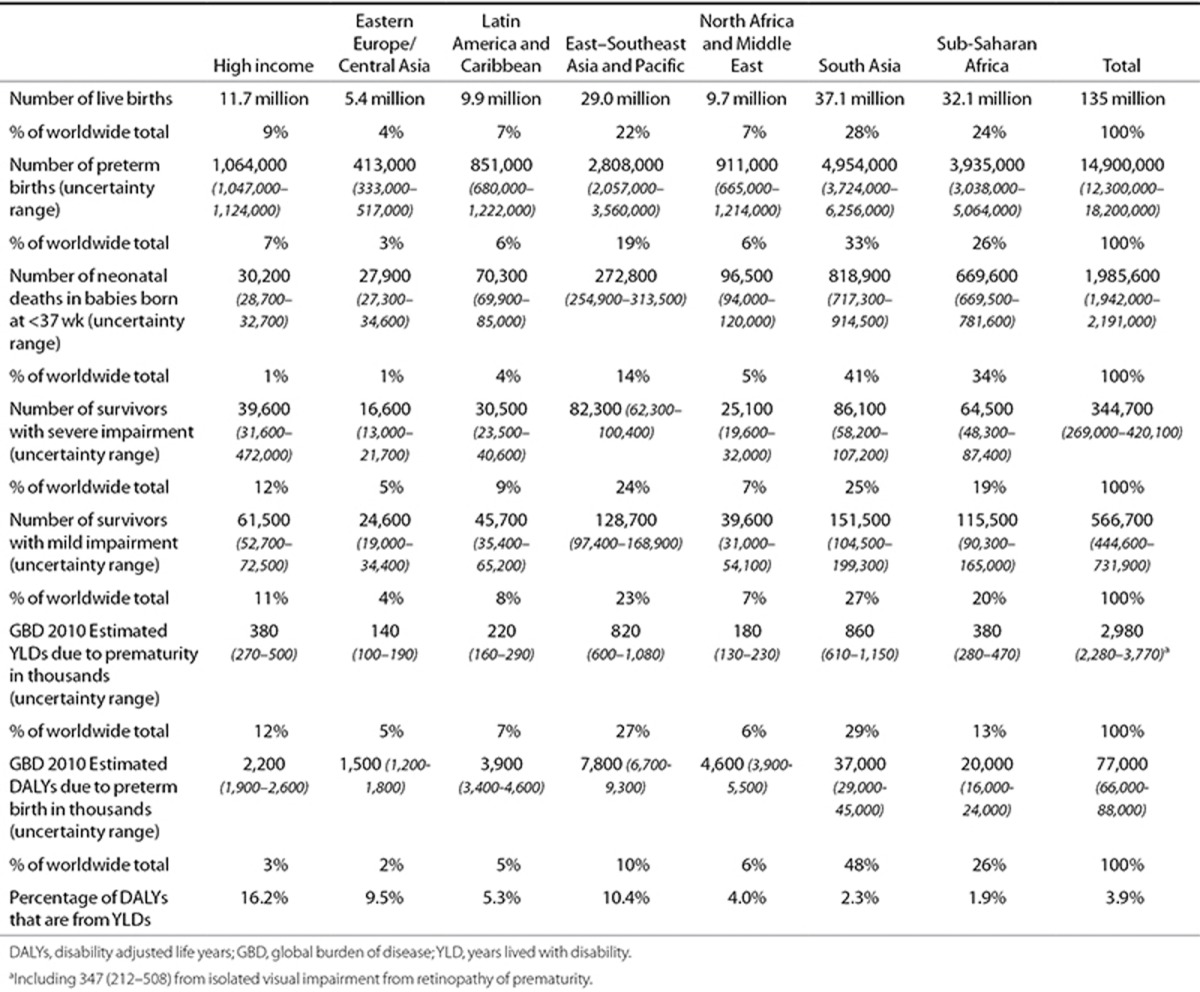
A total of 14,929 titles and abstracts were reviewed, and 862 studies contributed to the estimation of one or more parameters. A summary of all the parameter values used is given in Table 2 (see also Supplementary Information online). A summary of the regional results is given in Table 3.
Table 2. Countries (184) according to level of neonatal mortality, showing a summary of input data to the compartmental model for preterm around the year 2010.
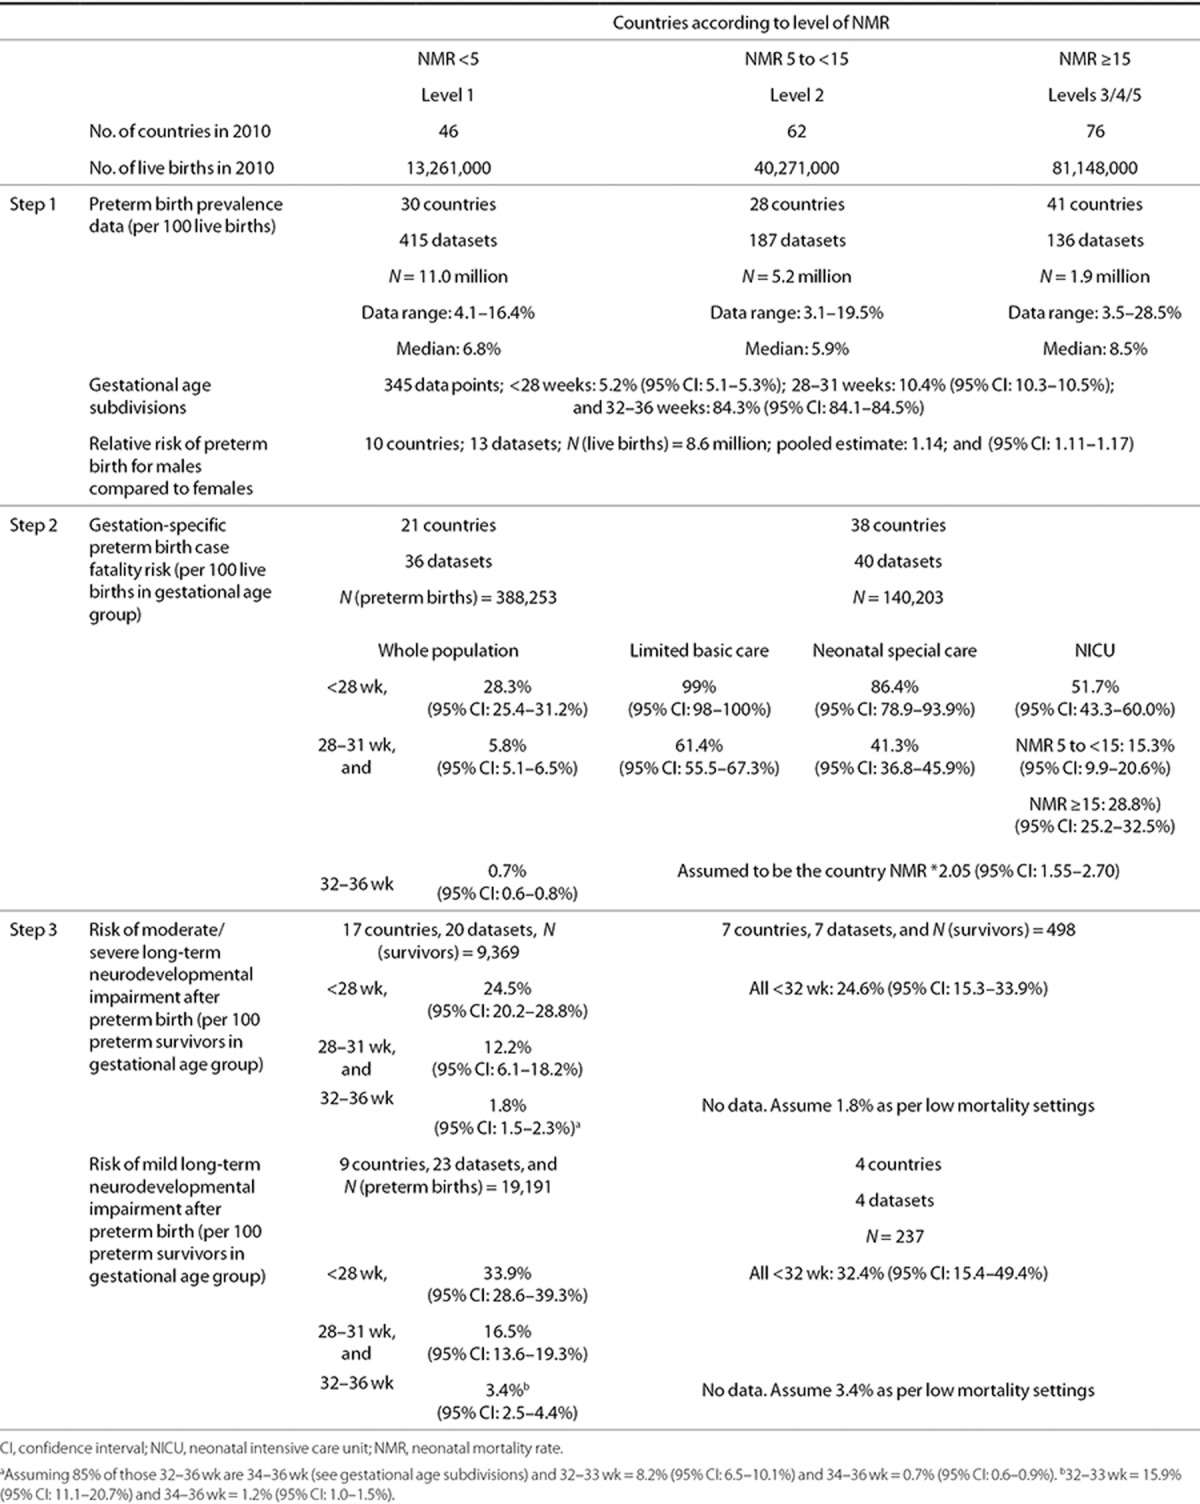
Table 3. Estimated number of preterm births, deaths, and impaired survivors by region in 2010 with YLDs and total DALYs from preterm birth at all ages GBD 2010.
Step 1: Preterm Live Birth Prevalence
Preterm live birth prevalence. National preterm birth rates for 2010 were estimated using two regional multilevel statistical models including data from national registries or statistical offices, Reproductive Health Surveys, unpublished data, and published papers identified through a systematic review. These included 738 reported data inputs from 99 countries, with the majority (547/738) of the data inputs coming from high-income countries. Full details of the searches, methodology input data, statistical modeling, and results have been published elsewhere, including the estimates for 2010 for 184 countries and time trends for 65 countries (1).
Gestational age subdivisions. The distribution of preterm births by gestational age subgroup was estimated from a meta-analysis of 345 data points (131 million live births) (1). Based on these studies, we estimate that 5.2% (95% CI: 5.1–5.3%) of all preterm births were at less than 28 wk; 10.4% (95% CI: 10.3–10.5%) at 28–31 wk and 84.3% at 32–36 wk (95% CI: 84.1–84.5%). Eighty-five percent of those born at 32 wk or more were born between 34–36 wk.
Sex differences in preterm live-birth prevalence. Data from 13 studies from the United States/Europe suggest that 54.6% (95% CI: 53.9–55.4%) of preterm births are in males and that risk ratio for preterm birth among males compared with females is 1.14 (95% CI: 1.11–1.17) (Table 2; Supplementary Information online) No data fulfilling the inclusion criteria were available from middle- or low-income settings, and therefore, the male to female risk ratio for preterm birth was assumed to be constant across all countries in all regions. The sex-specific prevalence of preterm birth was estimated by first calculating the absolute risk of preterm birth in males and females and applying this to the sex-specific live-birth data by country (see Supplementary Information online).
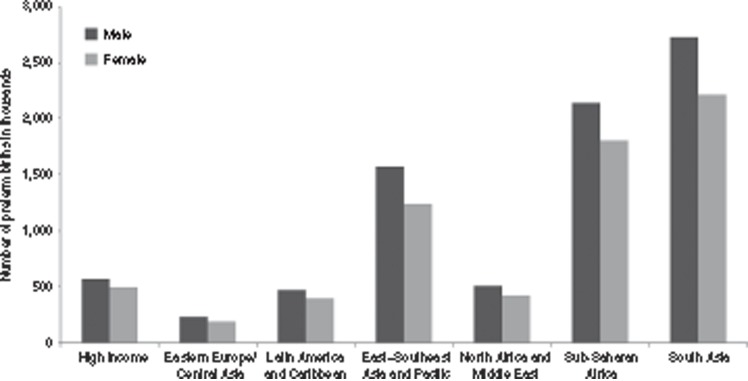
Prevalence estimates. We estimate that of the 14.9 million preterm births (uncertainty range: 12.3–18.1 million) in 2010, 8.2 million (54.9%. 7.4–9.5 million) were males (Figure 3). An estimated 0.8 million (0.8–0.9 million) were <28 wk, 1.6 million (1.5–1.7 million) were 28–31 wk, and 12.6 million (12.3–14.0 million) were 32–36 wk.
Figure 3.
Number of preterm births in 2010 for world region according to the sex of the baby. Males are shown in dark gray, females in light gray.
Step 2: Calculation of the Number of Postneonatal Survivors
Effect of sex on case fatality rate. While evidence supports lower survival for male neonates at all gestations when compared with females, insufficient data were available to include sex-specific mortality risks in the model (18,19,20).
Coverage and quality of care. We used the country neonatal mortality rate (NMR) as a proxy for access to and quality of newborn care and classified countries into three categories (Table 2) (13). We considered three care scenarios:
Full availability of all levels of neonatal care (including neonatal intensive care unit (NICU));
Some availability of specialized neonatal care (including neonatal special care), and
No access to NICU or neonatal special care, since outcomes after preterm birth are highly dependent on both gestational age and the quality of care received.
See the methods paper of this supplement (13) and Supplementary Information online for further details.
Gestation-specific case fatality rate by NMR group, gestational age category and level of care available. These are summarized in Table 2.
Low-mortality countries (NMR < 5): population-based approach for all gestational ages: For low mortality countries, gestational age–specific neonatal mortality data were abstracted from cohort studies identified from searches, predominantly from NICU, assuming all live-born neonates under 32 wk in these countries have access to NICU. Further searches of statistical databases, including EURO-PERISTAT (21) were used to provide population-based data from countries with more advanced statistical reporting systems and for those born at 32–36 wk. Case fatality risk (CFR) was estimated as 28.3% (95% CI: 25.4–31.2%) for those born at <28 wk; 5.8% (95% CI: 5.1–6.5%) for those born at 28–31 wk; and 0.7% (95% CI: 0.6–0.8%) of those born at 32–36.
Higher mortality countries (NMR ≥ 5): population-based approach for those born at 32–36 wk: for higher mortality countries, population-based data on neonatal survival of those born preterm are limited. Data from principle investigators collaborating with the Child Health Epidemiology Research Group SGA-Preterm Working Group provided mortality data from 19 low- and middle-income country birth cohorts by gestational age bands: <32 and 32–36 wk (22). Neonatal CFR for neonates born at 32–36 wk is less dependent on availability of intensive care and is mainly affected by basic hygiene, thermal care, extra support for breast feeding, and prompt recognition and treatment of infections. Hence, the survival of this group is closely related to the population NMR and showed a consistent relationship across these 19 studies with a pooled neonatal mortality risk ratio of 2.05 (95% CI: 1.55–2.70) for neonates born at 32–36 wk as compared with all neonates. This risk ratio was applied to the NMR for each country to estimate the number of 32–36 wk preterm deaths by country.
Higher mortality countries (NMR ≥ 5): approach based on level of care available for those born at <32 wk: Survival at <32 wk is highly dependent on the care available. In many high-mortality settings, most of these births will be at home, without gestational age assessment, access to specialist hospital care, or birth registration. Population-based data for these babies are problematic, with many community-based studies reporting implausibly high neonatal survival rates among very preterm neonates with limited availability of care, likely due to missed early neonatal deaths (22,23).
For neonates with basic/limited care only, survival for those born at <28 wk is uncommon. We assumed that 99% of all neonates born at <28 wk with no access to neonatal special care would die. For babies born at 28–31 wk, we estimate 61.4% (95% CI: 55.5–67.3) neonatal mortality based on one multisite trial including 96 rural sites in 7 countries (24). We note that this is an underestimate since neonatal deaths occurring after the first 7 d were not captured in this study.
For babies with access to special care only without intensive care, the estimated neonatal mortality was 86.4% (95% CI: 78.9–91.9%; 3 studies) for those born at <28 wk and 41.3% (95% CI: 36.8–45.9%; four studies) for those born at 28–31 wk (Supplementary Information online).
With access to NICU care, no strong evidence of a difference in mortality for neonates born at <28 wk was found between NMR 5 to <15 and NMR ≥15 countries, and the pooled estimate of 51.7% (95% CI: 43.3–60.0%; 17 studies) was used for all neonates with access to NICU in countries with NMR ≥5. For neonates born at 28–31 wk with access to NICU care, the pooled estimate of mortality was 15.3% (95% CI: 9.9–20.6%; 10 studies) in NMR 5 to <15 countries and 28.8% (95% CI: 25.2–32.5%; 5 studies) in NMR ≥15 countries.
Estimates of the number of postneonatal survivors. An estimated 4.3 million preterm neonates had access to NICU care if required (28% of all preterm live births), 2.5 million (17%) to special care only, and 8.2 million (55%) to basic/limited care only.
A total of 2.0 million (uncertainty range: 1.9–2.2 million) of those born preterm are estimated to have died during the first month of life comprising 642,000 babies (613,000–717,000) born at <28 wk; 702,000 babies (653,000–810,000) born at 28–31 wk; and 645,000 babies (585,000–757,000) born at 32–36 wk. 1.5 million (75%) of these deaths are estimated to have occurred in sub-Saharan Africa or South Asia (Table 3). This leaves an estimated 13 million (12.7–14.3 million) postneonatal preterm survivors; 140,000 (130,000–170,000) born at <28 wk; 857,000 (821,000–976,000) born at 28–31 wk; and 12.0 million (11.6–13.2 million) born at 32–36 wk.
Step 3: Calculation of the Number of Impaired Survivors
Sex-specific impairment risk. Although evidence supports increased neonatal morbidity and long-term neurodevelopmental impairment for males at all gestations when compared with females, insufficient data were available to include sex-specific risks in the model (19,25).
Gestation-specific impairment risk by NMR group, gestational age category, and level of care. Twenty-six studies reporting neurodevelopmental outcomes were included from the searches described above. Data were pooled in meta-analyses by NMR group. (Table 2 and Figures 4–6; Supplementary Information online) The median age at assessment was 28 mo. The proportion of surviving neonates who developed neurodevelopmental impairment did not vary in a consistent way across studies with differing lengths of follow-up. Where follow-up studies reported neurodevelopmental impairment in survivors who were assessed at several different time points, the data from the assessment nearest to 5 y of age were used, to provide a balance between increasing loss to follow-up in cohorts over time, and concordance of the developmental assessment with later neurodevelopmental and school outcome (26). This may underestimate the risk and severity of impairment for all postneonatal survivors, since the most severely impaired survivors have increased risk of death in childhood and hence may be underrepresented in the follow-up studies used to estimate the risk of impairment. Exclusion of studies with >30% loss to follow-up did not affect the overall result, and hence, no study was excluded on this basis to minimize data loss.
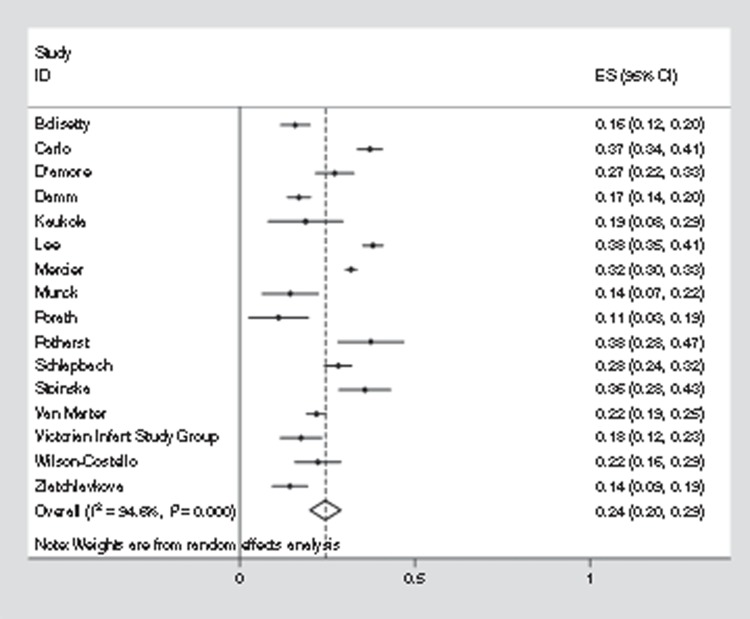
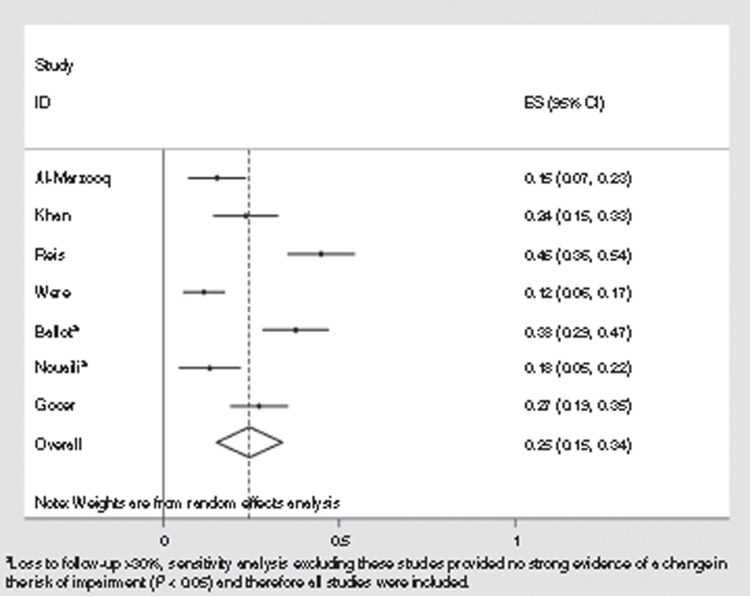
Figure 4.
Meta-analysis of studies reporting moderate/severe impairment outcomes for babies born at less than 28 wk in countries with neonatal mortality rate (NMR) <5 in 2000–2010.
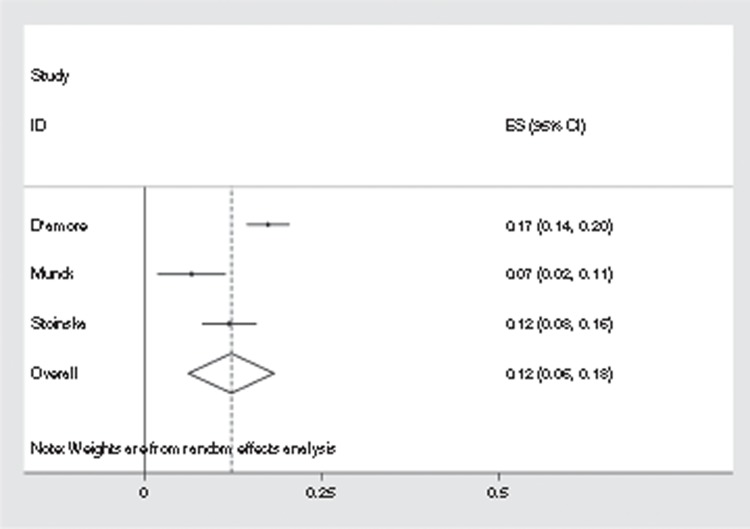
Figure 6.
Meta-analysis of studies reporting moderate/severe impairment outcomes for babies born at less than 32 wk in countries with neonatal mortality rate (NMR) ≥5 in 2000–2010.
(i) Low mortality countries (NMR <5): We estimate that 24.5% (95% CI: 20.2–28.8%) of survivors born at <28 wk had moderate/severe neurodevelopmental impairment (16 studies, Figure 4) and 33.9% (95% CI: 28.6–39.3%; 7 studies) of survivors had mild neurodevelopmental impairment.
For those born at 28–31 wk, 12.2% (95% CI: 6.1–18.2%; 3 studies) had moderate/severe and 16.5% (95% CI: 13.6–19.3%; 1 study) mild neurodevelopmental impairment. These studies showed substantial heterogeneity; the majority of studies were of neonates admitted to tertiary NICUs, some of which reported higher risk of impairment than the few studies from geographically defined populations.
Since most neonates born at 32–36 wk will not require NICU care, we used population-based studies only to assess the risk of neurodevelopmental impairment in those born moderately and late preterm. Several large birth cohorts from pre-1990 were excluded as the neonatal practices at the time are likely to have been very different from those in 2010, used mostly national registry data to capture outcomes, and only included survivors to adulthood (27,28,29). No population-based studies were available providing details for the whole group of 32–36 wk. We therefore used separate studies to estimate risk in those surviving moderate (32–33 wk) and late (34–36 wk) preterm birth. We assumed 15% of the whole 32–36 group to be born at 32–33 wk (see above). We used data from a large prospective population-based study of neonates 34–36 wk of gestation from the United States (30) providing risks based on a hierarchy of motor and cognitive impairments. 0.7% (95% CI: 0.6–0.9%) had “moderate/severe motor delay,” used here as a proxy for moderate/severe neurodevelopmental impairment. This does not include those with isolated moderate/severe cognitive impairment and hence will underestimate this risk. An additional 1.2% (95% CI: 1.0–1.5%) had “isolated cognitive impairment/developmental delay,” used here a proxy for isolated mild neurodevelopmental impairment. This may be an overestimate as it includes those with more severe isolated cognitive impairment but does not include isolated mild motor delay. For those born at 32 and 33 wk, we used population-based cognitive outcome data from EPIPAGE where 8.2% (95% CI: 6.5–10.1%) had moderate/severe and 15.9% (95% CI: 11.1–20.7%) mild neurodevelopmental impairment (31) (Table 2). These rates of neurodevelopmental impairment were similar to those reported in survivors born at 32–35 wk in a large community-based cohort in the Netherlands who were assessed by parental questionnaire around 46 mo of age (32,33).
(ii) Higher mortality countries (NMR ≥5): No data reported outcomes separately for those born at <28 wk and at 28–31 wk. For those born at <32 wk gestation, 7 studies from NICU settings suggested a wide variation in risks of moderate or severe neurodevelopmental impairment in postneonatal survivors, ranging from 11.7 to 45.0% (pooled estimate: 24.6% (95% CI: 15.3–33.9%); Table 2). Four studies on mild impairment in infants born at <32 wk were identified, producing a pooled estimate of 32.4% (95% CI: 15.4–49.4%).
Data on long-term risk of neurodevelopmental impairment after very preterm birth (<32 wk) are only available for survivors in high-mortality settings who have benefited from NICU care. The risk of neurodevelopmental impairment in the few very preterm neonates who survive the neonatal period without access to NICU care is likely to be lower, given the substantial mortality risk in this group and those who survive are a relatively more mature population with less immediate morbidity. We assumed, as a conservative estimate, the risk of impairment postneonatal survivors born at <32 wk without access to NICU care to be as a minimum the same as the risk for those born at 32–36 wk in high-income settings (Table 2).
Increasing evidence suggests a small but significant risk of neurodevelopmental impairment after late preterm birth, even in the absence of acute neonatal complications. No population-based data on the risk of long-term impairment after moderate-to-late preterm birth was available from high-mortality settings. Hence, we assumed that the impairment rate for those surviving moderate-to-late preterm birth to be similar to that from population-based data for postneonatal survivors born at 32–36 wk in high-income settings (Table 2).
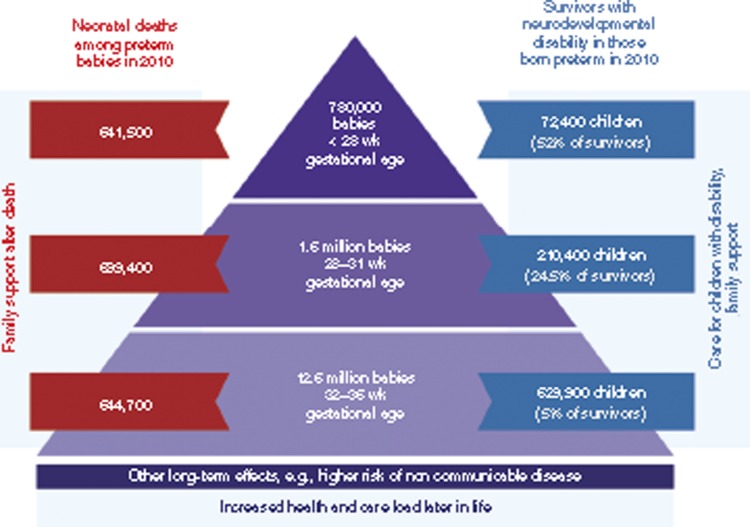
Estimates of the number of impaired survivors. We estimate that at least 911,000 (uncertainty range: 775,000–1,102,000) of postneonatal preterm survivors (7%) suffer long-term neurodevelopmental impairment. This comprises 345,000 (uncertainty range: 269,000–420,000) who are moderately or severely affected and a further 567,400 (445,000–732,000) with mild neurodevelopmental impairment. Worldwide, 52% of those born at <28 wk, 24% of those born at 28–31 wk, and 5% of those born at 32–36 wk and surviving the neonatal period are estimated to have some degree of neurodevelopmental impairment (Figure 7).
Figure 7.
Worldwide deaths and disability for babies born preterm in 2010.
GBD2010-Specific Inputs, Methods, and Results
GBD2010 used an approach similar to the three steps defined above to estimate the number of impaired survivors after preterm birth but for 1990–2010 (as opposed to 2010 only).
Key differences between the three steps between GBD2010 and the compartmental model. With respect to data inputs, the final date of the searches for the inputs to GBD2010 was June 2011 and hence did not include additional data published after this date which was available for the compartmental model presented here only. GBD2010 used risk of impairment data from 34–36 wk group to apply to the entire 32–36 wk group. Regarding GBD methods, a single pooled estimate of CFR and risk of impairment by gestational age category was used for all neonates in a given NMR group and did not take access to neonatal care into account. Hence, the estimated number of preterm births by region in GBD2010 was slightly lower but within the uncertainty range when compared with the method described in this paper. The estimated number of impaired survivors was lower in all regions in the GBD2010 model. The higher estimates in the compartmental model are primarily driven by the revised CFR by level of care assumptions which estimates fewer deaths at all gestational ages in the highest burden regions and the increased impairment risk from using new gestation-specific data for those born at 32 and 33 wk in all regions (Supplementary Information online). If these revisions were taken into account in GBD, the estimated number of years lived with disability (YLDs) may be substantially higher.
GBD2010 included three further steps beyond the compartmental model described above:
A Bayesian meta-regression method developed for the GBD, DisMod-MR, was used to estimate the prevalence of long-term impairments in 2010 by age, sex, and country including additional data regarding excess mortality risk in impaired survivors (13).
The number of YLDs at all ages were calculated as the prevalence of impaired survivors at all ages multiplied by the disability weight scores derived for the GBD2010 study (13,34). In DisMod-MR, all preterm births with moderate-to-severe outcomes were modeled together. A Swedish register of 90 children with cerebral palsy due to preterm birth was used to apportion the distribution of severity to motor impairment, cognitive impairment, seizure disorder, blindness, and possible combinations (35).
The final disability weight used for moderate-to-severe neurodevelopmental impairment for high-income regions was 0.38 (uncertainty range: 0.29–0.49) and 0.42 (uncertainty range: 0.32–0.53) in low- and middle-income regions. The higher disability weights in low- and middle-income regions are because the epilepsy disability weights distinguish those with and without treatment differently. Separate calculations were made for ROP, but disability for vision loss was only awarded to an estimated proportion of isolated cases of ROP without any other impairments as blindness in those with other impairments was taken into account in a combined disability weight for all moderate to severely impaired cases. Mild outcomes were modeled separately assuming that 50% of those with mild impairment had isolated mild motor problems, and 50% had mild motor and mild cognitive impairment. The final disability weight used for mild neurodevelopmental impairment was 0.03 (uncertainty range: 0.02–0.05).
The number of disability adjusted life years (DALYs) were then calculated as the sum of years of life lost (YLLs) due to premature mortality from preterm birth and YLDs (11,13). YLLs for preterm birth in 2010 were calculated for GBD2010 using the Cause of Death Ensemble model (CODEm) and standard life expectancy tables (13,36). This includes deaths at all ages due to direct complications of preterm birth only and is based on 3,363 vital registration, 225 verbal autopsy, and 25 surveillance data sources.
Estimates of the number of YLDs and DALYs associated with preterm birth. 3.0 million YLDs (uncertainty range: 2.2–3.7 million) and 74.0 million YLLs (63.0–85.2 million) giving a total of 77.0 million (66.0–88.0 million) preterm birth associated DALYs worldwide in 2010 (Table 3). This includes 0.3 million YLDs (0.2–0.5 million) due to visual impairment from “isolated” ROP in children with no other impairments. Sub-Saharan Africa and South Asia have high population levels, preterm birth rates, and NMRs and accounted for nearly three-quarters of these DALYs, reflecting their high-mortality rates. YLDs accounted for just 2.2% of DALYs in these regions as compared with 9.5% in Latin America, 10.4% in East Asia and Pacific, and 16.2% in high-income regions, reflecting a shift in burden from mortality to long-term impairment in the latter regions.
Discussion
Of 15 million (12.3–18.2 million) preterm births in 2010, 13.0 million (12.7–14.3 million) were estimated to survive the neonatal period. An estimated 0.9 million (uncertainty range: 0.8–1.1 million) of these postneonatal survivors will suffer long-term neurodevelopmental impairment with 345,000 (uncertainty range 269,000–420,000) moderately or severely affected. There is a well-recognized gradient of increasing risk of mortality and adverse developmental outcomes with decreasing gestational age at birth from early term (37–38 wk) through to the most premature survivors (32,37,38,39,40,41,42). Preterm brain injury results from developmental vulnerability given that the brain weighs only 65% of its full-term weight at 34 wk and glial cell migration continues to 36 wk (43) and compounded by brain injury associated with neonatal complications such as respiratory distress/hypoxemia, infection, hyperbilirubinemia, and hypoglycemia (44,45,46,47). Those born preterm are at higher risk of having complex medical, psychological, educational, and socioeconomic needs, placing a burden on both families and communities even in high-income settings (48,49,50). Few reports have quantified the long-term excess postneonatal mortality among impaired survivors in low- and middle-income settings; however, this is likely to be high given seizures, aspiration pneumonia, feeding difficulties, and potentially by reduced care-seeking practices.
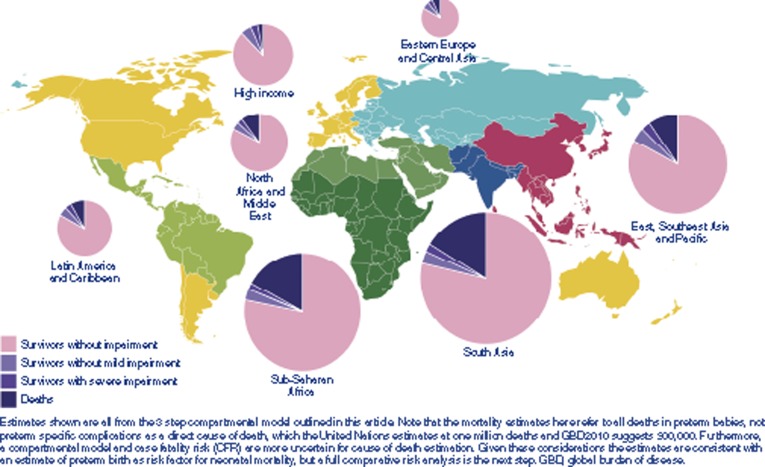
Our CFR-based estimates suggests that ~2.0 million preterm neonates born in 2010 died during the first month of life both from direct complications of preterm birth (most deaths in those born at <32 wk) and from other causes where preterm birth was a risk factor (Figure 8). Caution should be applied in interpreting these results since CFR-based estimates are more uncertain than multi-cause mortality data approaches. However, these are consistent with estimates of neonatal deaths due to direct complications of preterm birth in 2010 (1.1 million (2) or 0.84 million (36)) when combined with previous global estimates of the indirect effect of preterm birth (4,51). Deaths among neonates born at <32 wk are most likely to be coded (correctly) as direct preterm deaths, and the CFR approach suggest ~1.2 million which is within the uncertainty range of the current estimates. Currently, even in high-income countries with good vital registration systems, live-births at <28 wk are often classified as nonviable miscarriages (52). Neonatal deaths in those born at 32–36 wk are more likely to be coded (appropriately) to other causes, such as infection, with prematurity as a risk factor. Our finding suggests that two-third of all neonatal deaths may be in those born preterm, in line with previous global estimates and with the United States, where preterm birth is a direct cause of 36% of all infant deaths, but two-thirds of all infant deaths were among babies who were born preterm (53). A formal comparative risk factor analysis would be of value and should be linked with assessment of Small for Gestational Age (54).
Figure 8.
Regional burden of mortality and impairment for 15 million preterm babies born in 2010.
The majority of preterm babies survive without impairment, but at <28 wk gestation, over half (52%) are estimated to have some long-term impairment if they survive the neonatal period (Figure 7). Worldwide in 2010, 5% of those born at 32–36 wk who survive the neonatal period are estimated to have some degree of long-term impairment, but this includes 85% of all 15 million preterm births, and hence, their contribution to the overall burden is substantial (45,46). However, global averages mask considerable regional differences: 52% of all live births, 60% of preterm births, and 75% of neonatal deaths in those preterm born are estimated to occur in sub-Saharan Africa and South Asia but only 46% of impaired postneonatal survivors (Figure 8). A baby born alive before 32 wk of gestation has a 53% chance of surviving the neonatal period without later neurodevelopmental impairment in high-income regions, as compared with just 27% if born in South Asia or sub-Saharan Africa. These differences are mainly due to a marked survival gap and access to neonatal care between low- and high-income regions. The burden of impairment is disproportionately heavier in middle-income regions, which account for 33% of preterm births, 23% of the deaths, but 43% of the impairment. In countries scaling up NICU, urgent attention to quality of care is required to minimize impairment.
These estimates considered a defined group of neurodevelopmental disorders only, long-term sequelae of preterm birth are much wider than these. Many studies have reported an association of preterm birth with specific learning and executive function impairments and adverse mental health outcomes, including attention-deficit hyperactivity disorders, autistic spectrum disorders, anxiety/emotional disorders, and probably schizophrenia, particularly in those born very preterm (55,56,57,58,59,60,61,62,63,64,65,66,67,68). These deficits are also increasingly being recognized in late preterm infants (27,37,69,70,71,72,73).
A large population-based cohort study in the United Kingdom reported that as well as neurodevelopmental impairment other health outcomes were worse in those born preterm at any gestation than their term-born peers (38). Preterm birth at all gestations is linked to adverse long-term respiratory and cardiovascular outcomes (74,75). Babies who develop chronic lung disease after bronchopulmonary dysplasia have reduced lung function and lower exercise tolerance, placing them at higher risk of symptomatic chronic obstructive disease in middle adulthood than a term-born child (76,77,78). Even in the absence of chronic lung disease, preterm-born children were also more likely to have asthma and reduced lung function at school age as compared with their term-born peers (38,79). A recent meta-analysis shows that preterm birth is associated with substantially higher blood pressure in adult life and with early onset of other features of the metabolic syndrome (80,81). Given the burgeoning prevalence of noncommunicable diseases worldwide, this additional contribution of preterm birth to the major noncommunicable diseases of adult life, and global clinical and economic burden, is worthy of strong emphasis.
Time Trends
In most countries with reliable data, preterm birth rates remain constant or are increasing; this coupled with population growth will mean increasing numbers of preterm births each year (1,82). Changes in perinatal care over the past 50 y have been substantial, and few countries have data on rates of impairment in preterm birth survivors across all gestational age groups and in even fewer is it possible to track changes in rates of impairment over time. We attempted to address this by only including recent studies, and formal estimates of time trends in impairment after preterm birth were not undertaken. Data from Europe suggest that despite a reduction in risk of impairment at any gestational age, the absolute number of preterm survivors with cerebral palsy has not changed due to an increase in survival of the most preterm born infants (<26 wk) (83,84) (see Appendix at the end of this article). Improved quality of newborn care for all is needed to prevent increasing numbers of neonatal deaths and impaired survivors.
Data Limitations
Data availability varied with the least data from the highest burden settings. This is common to all the conditions considered in this supplement. Data on postneonatal child mortality (1–59 mo) after preterm birth were very sparse, especially from low-income settings, and it was not possible to estimate the number of survivors till the age of 5 years. We therefore applied the risk of impairment in those followed up at 2–5 y of age to all postneonatal survivors. Data were especially limited regarding the neurodevelopmental impairment. Published data on neurodevelopmental outcomes 2–5 y after preterm birth are not yet available for those born in 2010. We therefore have relied on outcome data for those born earlier in the decade. For neonates receiving NICU care in high- and intermediate-mortality settings, few data were available. We explored the use of historical data from the 1980s in high-income countries before the widespread use of antenatal corticosteroids and surfactant; however, we elected to use the limited recent data from these high burden populations (Supplementary Information online). No data are available for those preterm postneonatal survivors who did not have access to NICU care who are likely to be at higher risk than the general term-born population. We conservatively applied the population risk of impairment for late preterm as a minimum biological risk (30). Historical data of the impairment risk in countries before modern NICU care suggest that the risk may be substantially higher than this (Supplementary Information online) (85).
Despite recent interest in moderate and late preterm births (32–33 and 34–36 wk, respectively), descriptive studies are heterogeneous in design, mainly from high-income countries and focused on more common, milder behavioral and school impairment outcomes (70,71). Limited recent population-based data were available on absolute risk of impairment, and our estimates for late and moderate preterm outcomes are based on only two population-based cohorts (30,31). Although isolated mild motor impairment and mild motor impairment with cognitive impairment were taken into account, isolated cognitive impairment was not considered in estimating YLDs in GBD2010 for neonatal conditions. This is the most common outcome after extremely preterm birth and will be included in the future continuous GBD updates (86).
We included the sex of the baby in our assessment of prevalence of preterm birth, as this may influence survival and impairment outcomes: preterm-born males are more likely to die or survive impaired at any given gestational age (19,25,83,87). However, insufficient data were available to be able to quantify the sex differences at each subsequent step of the model.
One notable challenge is the assessment of gestational age. The use of birth weight proxies may misclassify half of appropriately grown 27 wk babies who weigh >1,000 g, while misclassifying in the opposite direction more mature babies who are small for gestational age. In high-mortality settings, there may be a high proportion of babies who were over 28 wk and small for gestational age among survivors (88,89). An important priority is the development of accurate, practical tools to assess gestational age in low- and middle-income settings to increase the availability of data on outcome after preterm birth in these settings.
Data Improvement
The introduction and scale-up of neonatal intensive care in the United Kingdom in the 1970s prompted investment in follow-up studies of NICU graduates (90). The need for information on long-term outcome remains critical not only for health-care planning but also for parents, particularly with ever advancing technologies in high-resource settings, and the scale-up of neonatal intensive care across middle income countries, with adoption in some low-income countries, especially in the private sector.
Preterm birth is a syndrome (91), and we expect outcomes to vary by underlying cause, with different outcomes from preterm labor/ruptured membranes (associated with infection), fetal growth restriction, preeclampsia, and provider-initiated preterm births as compared with those with rapid delivery following abruption or cervical incompetence. The proportion impaired at any given gestational age may therefore vary between populations with different risk factors and cause profiles and recording a minimum level of granularity as to the preterm birth phenotype may improve data comparability (91).
The same factors leading to preterm birth can also affect the baby's long-term outcome. Long-term outcomes are influenced by complex interactions between biological, medical, social, familial, and environmental factors, and their influence on the dynamic and adaptive maturational process of brain development (28,92,93,94). Well-designed studies, capturing biological and social covariates, are required. The cohorts we identified showed substantial heterogeneity in context, care practices, and outcome reporting, for example, by birth weight or gestational age, at different ages of follow-up, using different assessment techniques and with variable rates of loss to follow-up (95). Some studies have reported higher rates of severe disability in those lost to follow-up, resulting in ascertainment bias (96,97,98,99). More consistent and comprehensive tools and methods for describing outcomes, including milder behavioral and specific learning impairments are needed so that interventions can be targeted appropriately and findings across studies can be directly compared.
Programmatic Implications
This analysis has highlighted major geographical inequalities for babies' outcomes and in the data to track these outcomes. There are three very different worlds that preterm babies are born into (5), reflecting a transition from high neonatal mortality to preventable disability to the pushing on boundaries of low gestational age (100):
Low-income and some middle-income countries still face high numbers of deaths even among late preterm babies. Of the two million deaths among preterm babies, 75% are estimated to occur in South Asia and sub-Saharan Africa, where preterm NMRs are six times those in high-income countries and hence mortality reduction remains the priority.
Many middle-income and emerging countries have made rapid reductions in NMR and are increasing the availability of neonatal intensive care, but the quality of care is variable. Our estimates suggest that these countries have high impairment rates in postneonatal survivors (e.g., almost half of very preterm postneonatal survivors in Central Asia and Latin America are estimated to have some long-term impairment). These impaired survivors are mainly not extremely preterm, and the majority of these disabilities should be preventable with improved quality of care.
High-income countries have very low mortality and reducing gestational age–specific impairment risks over the past 20 y. For these countries, the focus in recent years has been on extremely preterm births (<26 wk) as these have the highest morbidity and mortality and pose difficult moral and ethical issues, and the increasing recognition of the public health implications moderate and late preterm babies.
We propose a three track approach: firstly, prevention of preterm birth; secondly, improved coverage and quality care for all babies born preterm to reduce mortality, morbidity, and impairment; and thirdly, early identification and care for survivors with disability.
Prevention of preterm birth is a knowledge gap given few evidence-based, high-impact options. Even in high-income settings, the available approaches are challenging to implement and lead only to modest reductions in preterm birth (82). Early intervention with more focus on the social determinants of health—e.g., improving the nutritional status of female children, retaining adolescent girls in school, family planning, gender empowerment, smoking cessation, and in reduction in infections e.g., HIV and malaria on a population level—may have some benefit (101). However, strategic research is required to better understand and address the complex interplay between genetic and environmental factors leading to preterm birth (44).
Reducing deaths and long-term impairment among preterm babies will require improved coverage of quality maternity and overall neonatal care in all settings. This is challenging but is likely to be more cost effective than focusing on highly specialized neonatal intensive care in isolation (5). This will need changes in societal norms and culture—for example, improved maternal health; regular-quality antenatal care commencing early in pregnancy; high-quality facility birth with antenatal steroids to assist lung maturation if required (102); and essential newborn care, Kangaroo care, and postnatal visits.
Systems to improve follow-up of preterm babies will be important to track the global burden and to allow appropriate prioritization of resources for health, education, and social care of those preterm born with disability. Priority has been placed in tracking outcomes of extreme preterm birth with the highest individual risk and more recently the relatively larger numbers of those born late preterm (34–36 wk). However, those born between 27 and 33 wk are a considerable public health burden—we estimate nearly three times as many impaired postneonatal survivors after preterm birth at 28–31 wk as compared with those <28 wk. Investment in early years of research is likely to reap lifelong personal and economic benefits yet newborns and children remain underrepresented in research priorities (103).
Conclusions
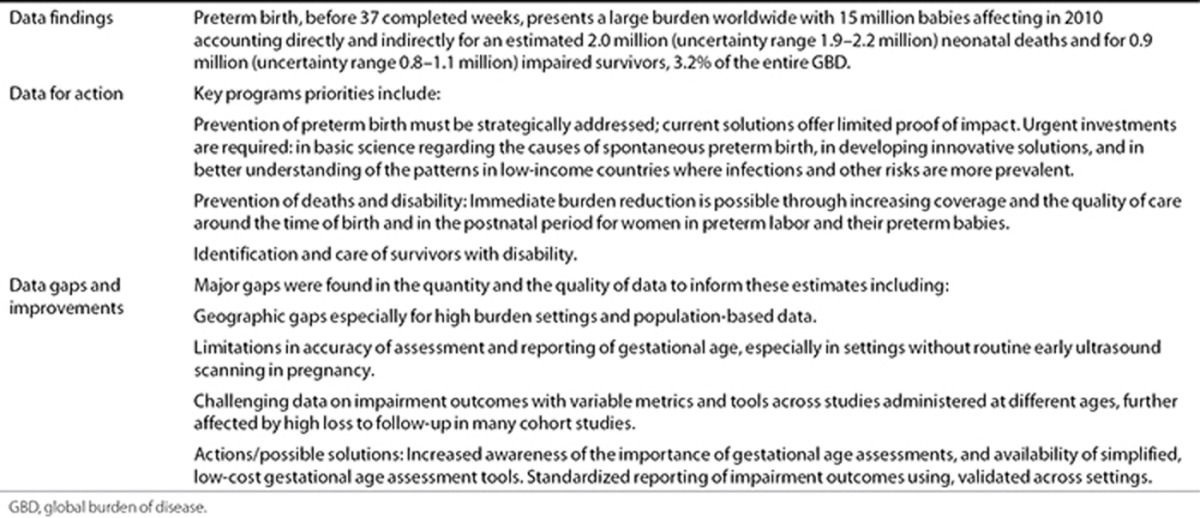
Preterm birth presents a large burden worldwide in terms of mortality and long-term physical and mental health and neurodevelopmental impairment throughout later life. The data are least available where the burden is heaviest. Improved data collection, particularly from low- and middle-income countries, with standardization of assessment tools is needed to track this burden and evaluate the effectiveness of interventions targeting preterm births (Table 4).
Table 4. Research in context regarding the burden of preterm birth.
Improved care for preterm babies would reduce mortality especially in low-income countries, and this is still the largest part of the burden worldwide. Most babies who survive (>90%) are not impaired, and the current burden of disability could be reduced especially in middle-income settings improving the quality of neonatal care. Prevention of preterm birth should be a longer term priority, but major reduction in the global burden of mortality and morbidity following preterm birth could be made immediately with improved coverage and quality of care.
Statement of Financial Support
This article is published as part of a supplement sponsored by The Bill and Melinda Gates Foundation to the Child Health Epidemiology Reference Group (CHERG) through US Fund for UNICEF and to Save the Children's Saving Newborn Lives program. H.B., A.C.L., and S.C. were funded through a grant from the Bill and Melinda Gates Foundation through the Child Health Epidemiology Reference Group. J.L. was funded by the Bill and Melinda Gates Foundation through Save the Children's Saving Newborn Lives program. J.K. received funding from the Bill and Melinda Gates Foundation. L.S. and D.C. received funding from the Department of Reproductive Health and Research, WHO, through the Special Program of Research, Development, and Research Training in Human Reproduction.
Disclosure
A.C.L. has received grants from USAID and National Institutes of Health (NIH) and has served as a consultant for the Save the Children's Saving Newborn Lives program. N.Z. receives funding from March of Dimes Global Program. N. Modi receives funding from Westminster Medical School Research Trust, Bliss, UK Department of Health, the Medical Research Council, and the National Institute for Health Research. N. Marlow has served as a consultant for Novartis. N. Modi receives funding from Westminster Medical School Research Trust, Bliss, UK Department of Health, the Medical Research Council, and the National Institute for Health Research, and is chair of the Neonatal Data Analysis Unit Steering Board. The other authors declare no conflict of interest.
Figure 5.
Meta-analysis of studies reporting moderate/severe impairment outcomes for babies born at 28–31 wk in countries with neonatal mortality rate (NMR) <5 in 2000–2010.
Acknowledgments
We would like to express our gratitude to Neonatal Data Analysis Unit analysts Eugene Statnikov and Daniel Grey for their contribution in extracting admission and mortality data from the UK National Neonatal Research Database; Louise Day and LAMB MIS-Research Department for NMR data; Chris Rowland, Nick Street, and Rachel Philips for assistance with tables and figures; and Mikkel Z. Oestergaard, Ann-Beth Moller, Alma Adler, Claudia Vera Garcia, and Sarah Rohde for their role in the estimation of the prevalence of preterm birth; and Hasha Obeyesekere for her assistance with the literature review.
L.S. and D.C. are staff members of the World Health Organization. The authors alone are responsible for the views expressed in this article, and they do not necessarily represent the decisions, policy, or views of the World Health Organization.
Appendix
Appendix. Trends in survival and morbidity of the most preterm babies (<26 weeks) in high-income countries
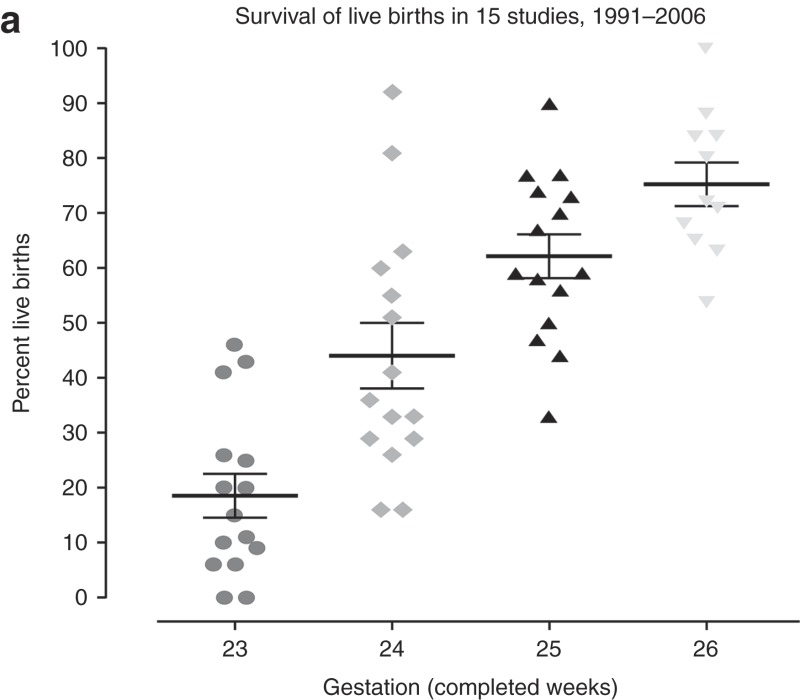 Survival for babies with very low gestational ages (24–26 weeks) has increased with 80% survival at 25 weeks, although mortality and morbidity remains very high at the lower gestations (a). However, wide variation in survival rates exist, with the highest survival in very centralized services and where appropriate interventions to improve fetal and neonatal condition are used – such as antenatal corticosteroids, occlusive wrapping to prevent heat loss after birth and surfactant replacement therapy. Below 25 weeks outcome data are confounded by public policy and actual practice in the provision of care.
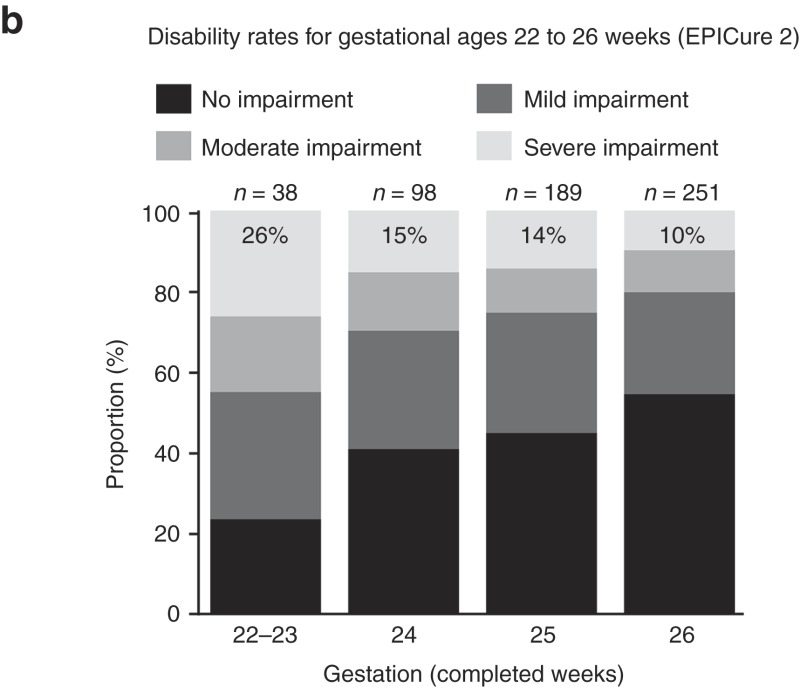 Disability free survival is around 60% at 26 weeks, 10% have severe disability at 3 years, and the proportion with disability rises at 25 weeks and below, as shown in national data in England for 2006 (b) (84). As these children survive for longer increasing proportions are found to have special educational needs and psychiatric problems (42,63).
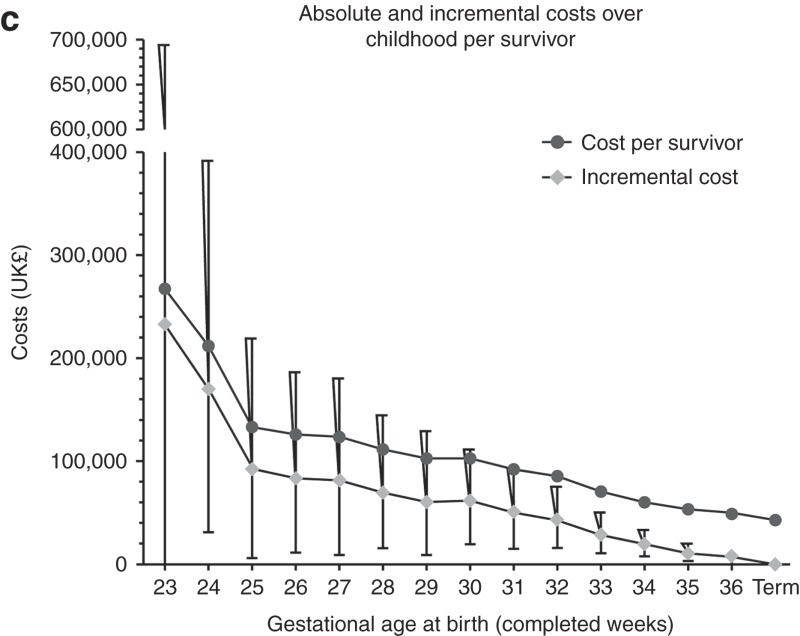 The incremental costs attributable to preterm birth rise steeply at very low gestations (c). The costs are primarily attributable to neonatal intensive care due to prolonged hospital stay in survivors, discharge being at around 40 weeks postmenstrual age, giving an average of 4 months care for the most immature. Later special educational special needs add lower costs but over a long time period.
Supplementary Material
References
- Blencowe H, Cousens S, Oestergaard MZ, et al. National, regional, and worldwide estimates of preterm birth rates in the year 2010 with time trends since 1990 for selected countries: a systematic analysis and implications. Lancet. 2012;379:2162–72. doi: 10.1016/S0140-6736(12)60820-4. [DOI] [PubMed] [Google Scholar]
- Liu L, Johnson HL, Cousens S, et al. Child Health Epidemiology Reference Group of WHO and UNICEF Global, regional, and national causes of child mortality: an updated systematic analysis for 2010 with time trends since 2000. Lancet. 2012;379:2151–61. doi: 10.1016/S0140-6736(12)60560-1. [DOI] [PubMed] [Google Scholar]
- Lawn JE, Kerber K, Enweronu-Laryea C, Cousens S. 3.6 million neonatal deaths–what is progressing and what is not. Semin Perinatol. 2010;34:371–86. doi: 10.1053/j.semperi.2010.09.011. [DOI] [PubMed] [Google Scholar]
- Lawn JE, Cousens S, Zupan J. Lancet Neonatal Survival Steering Team 4 million neonatal deaths: When? Where? Why. Lancet. 2005;365:891–900. doi: 10.1016/S0140-6736(05)71048-5. [DOI] [PubMed] [Google Scholar]
- March of Dimes, The Partnership for Maternal, Newborn, and Child Health, Save the Children, WHO Howson C, Kinney M, Lawn J.Born Too Soon: The Global Action Report on Preterm Birth Geneva, Switzerland; World Health Organization; 2012 . ( http://www.who.int/pmnch/media/news/2012/preterm_birth_report/en/index1.html ) [Google Scholar]
- Mwaniki MK, Atieno M, Lawn JE, Newton CR. Long-term neurodevelopmental outcomes after intrauterine and neonatal insults: a systematic review. Lancet. 2012;379:445–52. doi: 10.1016/S0140-6736(11)61577-8. [DOI] [PMC free article] [PubMed] [Google Scholar]
- Leviton A, Fichorova RN, O'Shea TM, et al. ELGAN Study Investigators Two-hit model of brain damage in the very preterm newborn: small for gestational age and postnatal systemic inflammation. Pediatr Res. 2013;73:362–70. doi: 10.1038/pr.2012.188. [DOI] [PMC free article] [PubMed] [Google Scholar]
- Blencowe H, Lawn JE, Vazquez T, Fielder A, Gilbert C.Preterm-associated visual impairment and estimates of retinopathy of prematurity at regional and global levels for 2010 Pediatr Res 2013. this issue). [DOI] [PMC free article] [PubMed]
- Lopez AD. Mathers CD. Ezzati M. Jamison DT. Murray CJL. Global Burden of Disease and Risk Factors. Washington, DC; The International Bank for Reconstruction and Development/The World Bank Group; 2006. [PubMed] [Google Scholar]
- Murray CJ, Lopez AD. Global mortality, disability, and the contribution of risk factors: Global Burden of Disease Study. Lancet. 1997;349:1436–42. doi: 10.1016/S0140-6736(96)07495-8. [DOI] [PubMed] [Google Scholar]
- Murray CJ, Vos T, Lozano R, et al. Disability-adjusted life years (DALYs) for 291 diseases and injuries in 21 regions, 1990-2010: a systematic analysis for the Global Burden of Disease Study 2010. Lancet. 2012;380:2197–223. doi: 10.1016/S0140-6736(12)61689-4. [DOI] [PubMed] [Google Scholar]
- Shibuya K, Murray CJL. Murray CJL, Lopez AD. The Global Burden of Disease: A Comprehensive Assessment of Mortality and Disability From Diseases, Injuries and Risk Factors in 1990 and Projected to 2020. Cambridge, MA; Harvard University Press; 1996. Low birthweight. [Google Scholar]
- Blencowe H, Vos T, Lee AC, et al. Estimates of neonatal morbidities and disabilities at regional and global levels for 2010: introduction, methods overview, and relevant findings from the Global Burden of Disease study Pediatr Res 2013. this issue). [DOI] [PMC free article] [PubMed]
- World Health Organization WHO: recommended definitions, terminology and format for statistical tables related to the perinatal period and use of a new certificate for cause of perinatal deaths. Modifications recommended by FIGO as amended October 14, 1976. Acta Obstet Gynecol Scand. 1977;56:247–53. [PubMed] [Google Scholar]
- Blencowe H, Cousens S, Chou D, et al. Chapter 2: 15 million preterm births: Priorities for action based on national, regional and global estimates Howson C, Kinney M, Lawn J.Born Too Soon: The Global Action Report on Preterm Birth New York; March of Dimes, PMNCH, Save the Children, World Health Organization; 2012 . ( http://www.who.int/pmnch/media/news/2012/borntoosoon_chapter2.pdf .) [Google Scholar]
- Murray CJ, Ezzati M, Flaxman AD, et al. GBD 2010: design, definitions, and metrics. Lancet. 2012;380:2063–6. doi: 10.1016/S0140-6736(12)61899-6. [DOI] [PubMed] [Google Scholar]
- United Nations Population Division World Population Prospects, 2010 . ( http://esa.un.org/unpd/wpp/index.htm .)
- Stevenson DK, Verter J, Fanaroff AA, et al. Sex differences in outcomes of very low birthweight infants: the newborn male disadvantage. Arch Dis Child Fetal Neonatal Ed. 2000;83:F182–5. doi: 10.1136/fn.83.3.F182. [DOI] [PMC free article] [PubMed] [Google Scholar]
- Kent AL, Wright IM, Abdel-Latif ME. New South Wales and Australian Capital Territory Neonatal Intensive Care Units Audit Group Mortality and adverse neurologic outcomes are greater in preterm male infants. Pediatrics. 2012;129:124–31. doi: 10.1542/peds.2011-1578. [DOI] [PubMed] [Google Scholar]
- Kim BI, Lee KS, Khoshnood B, Hsieh HL, Chen TJ, Mittendorf R. Impact of increased neonatal survival on postneonatal mortality in the United States. Paediatr Perinat Epidemiol. 1996;10:423–31. doi: 10.1111/j.1365-3016.1996.tb00068.x. [DOI] [PubMed] [Google Scholar]
- Euro Peristat European Perinatal Health Report 2004, 2008 . ( http://www.europeristat.com/reports/european-perinatal-health-report.html )
- Katz J, Lee AC, Kozuki N, et al. CHERG Small-for-Gestational-Age-Preterm Birth Working Group Mortality risk in preterm and small-for-gestational-age-infants in low-income and middle-income countries: a pooled country analysis. Lancet. 2013;382:417–25. doi: 10.1016/S0140-6736(13)60993-9. [DOI] [PMC free article] [PubMed] [Google Scholar]
- Belizán JM, McClure EM, Goudar SS, et al. Neonatal death in low- to middle-income countries: a global network study. Am J Perinatol. 2012;29:649–56. doi: 10.1055/s-0032-1314885. [DOI] [PMC free article] [PubMed] [Google Scholar]
- Carlo WA, Goudar SS, Jehan I, et al. First Breath Study Group High mortality rates for very low birth weight infants in developing countries despite training. Pediatrics. 2010;126:e1072–80. doi: 10.1542/peds.2010-1183. [DOI] [PMC free article] [PubMed] [Google Scholar]
- Verloove-Vanhorick SP, Veen S, Ens-Dokkum MH, Schreuder AM, Brand R, Ruys JH. Sex difference in disability and handicap at five years of age in children born at very short gestation. Pediatrics. 1994;93:576–9. [PubMed] [Google Scholar]
- van Kessel-Feddema B, Sondaar M, de Kleine M, Verhaak C, van Baar A. Concordance between school outcomes and developmental follow-up results of very preterm and/or low birth weight children at the age of 5 years. Eur J Pediatr. 2007;166:693–9. doi: 10.1007/s00431-006-0309-7. [DOI] [PMC free article] [PubMed] [Google Scholar]
- Talge NM, Holzman C, Wang J, Lucia V, Gardiner J, Breslau N. Late-preterm birth and its association with cognitive and socioemotional outcomes at 6 years of age. Pediatrics. 2010;126:1124–31. doi: 10.1542/peds.2010-1536. [DOI] [PubMed] [Google Scholar]
- Moster D, Lie RT, Markestad T. Long-term medical and social consequences of preterm birth. N Engl J Med. 2008;359:262–73. doi: 10.1056/NEJMoa0706475. [DOI] [PubMed] [Google Scholar]
- Lindström K, Winbladh B, Haglund B, Hjern A. Preterm infants as young adults: a Swedish national cohort study. Pediatrics. 2007;120:70–7. doi: 10.1542/peds.2006-3260. [DOI] [PubMed] [Google Scholar]
- Petrini JR, Dias T, McCormick MC, Massolo ML, Green NS, Escobar GJ. Increased risk of adverse neurological development for late preterm infants. J Pediatr. 2009;154:169–76. doi: 10.1016/j.jpeds.2008.08.020. [DOI] [PubMed] [Google Scholar]
- Marret S, Ancel PY, Marpeau L, et al. Epipage Study Group Neonatal and 5-year outcomes after birth at 30-34 weeks of gestation. Obstet Gynecol. 2007;110:72–80. doi: 10.1097/01.AOG.0000267498.95402.bd. [DOI] [PubMed] [Google Scholar]
- Kerstjens JM, de Winter AF, Bocca-Tjeertes IF, Bos AF, Reijneveld SA. Risk of developmental delay increases exponentially as gestational age of preterm infants decreases: a cohort study at age 4 years. Dev Med Child Neurol. 2012;54:1096–101. doi: 10.1111/j.1469-8749.2012.04423.x. [DOI] [PubMed] [Google Scholar]
- Kerstjens JM, Bocca-Tjeertes IF, de Winter AF, Reijneveld SA, Bos AF. Neonatal morbidities and developmental delay in moderately preterm-born children. Pediatrics. 2012;130:e265–72. doi: 10.1542/peds.2012-0079. [DOI] [PubMed] [Google Scholar]
- Salomon JA, Vos T, Hogan DR, et al. Common values in assessing health outcomes from disease and injury: disability weights measurement study for the Global Burden of Disease Study 2010. Lancet. 2012;380:2129–43. doi: 10.1016/S0140-6736(12)61680-8. [DOI] [PMC free article] [PubMed] [Google Scholar]
- Hagberg B, Hagberg G. The changing panorama of cerebral palsy–bilateral spastic forms in particular. Acta Paediatr Suppl. 1996;416:48–52. doi: 10.1111/j.1651-2227.1996.tb14277.x. [DOI] [PubMed] [Google Scholar]
- Lozano R, Naghavi M, Foreman K, et al. Global and regional mortality from 235 causes of death for 20 age groups in 1990 and 2010: a systematic analysis for the Global Burden of Disease Study 2010. Lancet. 2012;380:2095–128. doi: 10.1016/S0140-6736(12)61728-0. [DOI] [PMC free article] [PubMed] [Google Scholar]
- Quigley MA, Poulsen G, Boyle E, et al. Early term and late preterm birth are associated with poorer school performance at age 5 years: a cohort study. Arch Dis Child Fetal Neonatal Ed. 2012;97:F167–73. doi: 10.1136/archdischild-2011-300888. [DOI] [PubMed] [Google Scholar]
- Boyle EM, Poulsen G, Field DJ, et al. Effects of gestational age at birth on health outcomes at 3 and 5 years of age: population based cohort study. BMJ. 2012;344:e896. doi: 10.1136/bmj.e896. [DOI] [PMC free article] [PubMed] [Google Scholar]
- Marlow N. Rennie JM. Rennie and Robertson's Textbook of Neonatology (5E) Edinburgh, UK; Churchill Livingstone; 2012. Outcome following preterm birth; pp. 71–88. [Google Scholar]
- Marlow N. Full term; an artificial concept. Arch Dis Child Fetal Neonatal Ed. 2012;97:F158–9. doi: 10.1136/fetalneonatal-2011-301507. [DOI] [PubMed] [Google Scholar]
- Mathiasen R, Hansen BM, Andersen AM, Forman JL, Greisen G. Gestational age and basic school achievements: a national follow-up study in Denmark. Pediatrics. 2010;126:e1553–61. doi: 10.1542/peds.2009-0829. [DOI] [PubMed] [Google Scholar]
- MacKay DF, Smith GC, Dobbie R, Pell JP. Gestational age at delivery and special educational need: retrospective cohort study of 407,503 schoolchildren. PLoS Med. 2010;7:e1000289. doi: 10.1371/journal.pmed.1000289. [DOI] [PMC free article] [PubMed] [Google Scholar]
- Kinney HC. The near-term (late preterm) human brain and risk for periventricular leukomalacia: a review. Semin Perinatol. 2006;30:81–8. doi: 10.1053/j.semperi.2006.02.006. [DOI] [PubMed] [Google Scholar]
- Gravett MG, Rubens CE, Nunes TM. GAPPS Review Group Global report on preterm birth and stillbirth (2 of 7): discovery science. BMC Pregnancy Childbirth. 2010;10 Suppl 1:S2. doi: 10.1186/1471-2393-10-S1-S2. [DOI] [PMC free article] [PubMed] [Google Scholar]
- Shapiro-Mendoza CK, Tomashek KM, Kotelchuck M, et al. Effect of late-preterm birth and maternal medical conditions on newborn morbidity risk. Pediatrics. 2008;121:e223–32. doi: 10.1542/peds.2006-3629. [DOI] [PubMed] [Google Scholar]
- Escobar GJ, Clark RH, Greene JD. Short-term outcomes of infants born at 35 and 36 weeks gestation: we need to ask more questions. Semin Perinatol. 2006;30:28–33. doi: 10.1053/j.semperi.2006.01.005. [DOI] [PubMed] [Google Scholar]
- Volpe JJ. Brain injury in premature infants: a complex amalgam of destructive and developmental disturbances. Lancet Neurol. 2009;8:110–24. doi: 10.1016/S1474-4422(08)70294-1. [DOI] [PMC free article] [PubMed] [Google Scholar]
- Petrou S, Eddama O, Mangham L. A structured review of the recent literature on the economic consequences of preterm birth. Arch Dis Child Fetal Neonatal Ed. 2011;96:F225–32. doi: 10.1136/adc.2009.161117. [DOI] [PubMed] [Google Scholar]
- Berry JG, Poduri A, Bonkowsky JL, et al. Trends in resource utilization by children with neurological impairment in the United States inpatient health care system: a repeat cross-sectional study. PLoS Med. 2012;9:e1001158. doi: 10.1371/journal.pmed.1001158. [DOI] [PMC free article] [PubMed] [Google Scholar]
- Reid SM, Carlin JB, Reddihough DS. Rates of cerebral palsy in Victoria, Australia, 1970 to 2004: has there been a change. Dev Med Child Neurol. 2011;53:907–12. doi: 10.1111/j.1469-8749.2011.04039.x. [DOI] [PubMed] [Google Scholar]
- Lawn JE, Gravett MG, Nunes TM, Rubens CE, Stanton C. GAPPS Review Group Global report on preterm birth and stillbirth (1 of 7): definitions, description of the burden and opportunities to improve data. BMC Pregnancy Childbirth. 2010;10 Suppl 1:S1. doi: 10.1186/1471-2393-10-S1-S1. [DOI] [PMC free article] [PubMed] [Google Scholar]
- Lawn JE, Blencowe H, Pattinson R, et al. Lancet's Stillbirths Series steering committee Stillbirths: Where? When? Why? How to make the data count. Lancet. 2011;377:1448–63. doi: 10.1016/S0140-6736(10)62187-3. [DOI] [PubMed] [Google Scholar]
- Mathews TJ, MacDorman MF. Infant mortality statistics from the 2004 period linked birth/infant death data set. Natl Vital Stat Rep. 2007;55:1–32. [PubMed] [Google Scholar]
- Black RE, Allen LH, Bhutta ZA, et al. Maternal and Child Undernutrition Study Group Maternal and child undernutrition: global and regional exposures and health consequences. Lancet. 2008;371:243–60. doi: 10.1016/S0140-6736(07)61690-0. [DOI] [PubMed] [Google Scholar]
- Aarnoudse-Moens CS, Weisglas-Kuperus N, van Goudoever JB, Oosterlaan J. Meta-analysis of neurobehavioral outcomes in very preterm and/or very low birth weight children. Pediatrics. 2009;124:717–28. doi: 10.1542/peds.2008-2816. [DOI] [PubMed] [Google Scholar]
- Elgen SK, Leversen KT, Grundt JH, et al. Mental health at 5 years among children born extremely preterm: a national population-based study. Eur Child Adolesc Psychiatry. 2012;21:583–9. doi: 10.1007/s00787-012-0298-1. [DOI] [PubMed] [Google Scholar]
- Johnson S, Marlow N. Preterm birth and childhood psychiatric disorders. Pediatr Res. 2011;69 5 Pt 2:11R–8R. doi: 10.1203/PDR.0b013e318212faa0. [DOI] [PubMed] [Google Scholar]
- Nosarti C, Reichenberg A, Murray RM, et al. Preterm birth and psychiatric disorders in young adult life. Arch Gen Psychiatry. 2012;69:E1–8. doi: 10.1001/archgenpsychiatry.2011.1374. [DOI] [PubMed] [Google Scholar]
- Botting N, Powls A, Cooke RW, Marlow N. Attention deficit hyperactivity disorders and other psychiatric outcomes in very low birthweight children at 12 years. J Child Psychol Psychiatry. 1997;38:931–41. doi: 10.1111/j.1469-7610.1997.tb01612.x. [DOI] [PubMed] [Google Scholar]
- Elgen I, Sommerfelt K, Markestad T. Population based, controlled study of behavioural problems and psychiatric disorders in low birthweight children at 11 years of age. Arch Dis Child Fetal Neonatal Ed. 2002;87:F128–32. doi: 10.1136/fn.87.2.F128. [DOI] [PMC free article] [PubMed] [Google Scholar]
- Hack M, Taylor HG, Schluchter M, Andreias L, Drotar D, Klein N. Behavioral outcomes of extremely low birth weight children at age 8 years. J Dev Behav Pediatr. 2009;30:122–30. doi: 10.1097/DBP.0b013e31819e6a16. [DOI] [PMC free article] [PubMed] [Google Scholar]
- Indredavik MS, Vik T, Heyerdahl S, Kulseng S, Fayers P, Brubakk AM. Psychiatric symptoms and disorders in adolescents with low birth weight. Arch Dis Child Fetal Neonatal Ed. 2004;89:F445–50. doi: 10.1136/adc.2003.038943. [DOI] [PMC free article] [PubMed] [Google Scholar]
- Johnson S, Hollis C, Kochhar P, Hennessy E, Wolke D, Marlow N. Psychiatric disorders in extremely preterm children: longitudinal finding at age 11 years in the EPICure study. J Am Acad Child Adolesc Psychiatry. 2010;49:453–63.e1. [PubMed] [Google Scholar]
- Johnson S, Hollis C, Kochhar P, Hennessy E, Wolke D, Marlow N. Autism spectrum disorders in extremely preterm children. J Pediatr. 2010;156:525–31.e2. doi: 10.1016/j.jpeds.2009.10.041. [DOI] [PubMed] [Google Scholar]
- Pinto-Martin JA, Levy SE, Feldman JF, Lorenz JM, Paneth N, Whitaker AH. Prevalence of autism spectrum disorder in adolescents born weighing <2000 grams. Pediatrics. 2011;128:883–91. doi: 10.1542/peds.2010-2846. [DOI] [PMC free article] [PubMed] [Google Scholar]
- Szatmari P, Saigal S, Rosenbaum P, Campbell D, King S. Psychiatric disorders at five years among children with birthweights less than 1000g: a regional perspective. Dev Med Child Neurol. 1990;32:954–62. [PubMed] [Google Scholar]
- Whitaker AH, Van Rossem R, Feldman JF, et al. Psychiatric outcomes in low-birth-weight children at age 6 years: relation to neonatal cranial ultrasound abnormalities. Arch Gen Psychiatry. 1997;54:847–56. doi: 10.1001/archpsyc.1997.01830210091012. [DOI] [PubMed] [Google Scholar]
- Sømhovd MJ, Hansen BM, Brok J, Esbjørn BH, Greisen G. Anxiety in adolescents born preterm or with very low birthweight: a meta-analysis of case-control studies. Dev Med Child Neurol. 2012;54:988–94. doi: 10.1111/j.1469-8749.2012.04407.x. [DOI] [PubMed] [Google Scholar]
- Baron IS, Kerns KA, Müller U, Ahronovich MD, Litman FR. Executive functions in extremely low birth weight and late-preterm preschoolers: effects on working memory and response inhibition. Child Neuropsychol. 2012;18:586–99. doi: 10.1080/09297049.2011.631906. [DOI] [PubMed] [Google Scholar]
- de Jong M, Verhoeven M, van Baar AL. School outcome, cognitive functioning, and behaviour problems in moderate and late preterm children and adults: a review. Semin Fetal Neonatal Med. 2012;17:163–9. doi: 10.1016/j.siny.2012.02.003. [DOI] [PubMed] [Google Scholar]
- van Baar AL, Vermaas J, Knots E, de Kleine MJ, Soons P. Functioning at school age of moderately preterm children born at 32 to 36 weeks' gestational age. Pediatrics. 2009;124:251–7. doi: 10.1542/peds.2008-2315. [DOI] [PubMed] [Google Scholar]
- Darlow BA, Horwood LJ, Wynn-Williams MB, Mogridge N, Austin NC. Admissions of all gestations to a regional neonatal unit versus controls: 2-year outcome. J Paediatr Child Health. 2009;45:187–93. doi: 10.1111/j.1440-1754.2008.01457.x. [DOI] [PubMed] [Google Scholar]
- Gray RF, Indurkhya A, McCormick MC. Prevalence, stability, and predictors of clinically significant behavior problems in low birth weight children at 3, 5, and 8 years of age. Pediatrics. 2004;114:736–43. doi: 10.1542/peds.2003-1150-L. [DOI] [PubMed] [Google Scholar]
- Abitbol CL, Rodriguez MM. The long-term renal and cardiovascular consequences of prematurity. Nat Rev Nephrol. 2012;8:265–74. doi: 10.1038/nrneph.2012.38. [DOI] [PubMed] [Google Scholar]
- Rogers LK, Velten M. Maternal inflammation, growth retardation, and preterm birth: insights into adult cardiovascular disease. Life Sci. 2011;89:417–21. doi: 10.1016/j.lfs.2011.07.017. [DOI] [PubMed] [Google Scholar]
- Doyle LW, Anderson PJ. Pulmonary and neurological follow-up of extremely preterm infants. Neonatology. 2010;97:388–94. doi: 10.1159/000297771. [DOI] [PubMed] [Google Scholar]
- Lum S, Kirkby J, Welsh L, Marlow N, Hennessy E, Stocks J. Nature and severity of lung function abnormalities in extremely pre-term children at 11 years of age. Eur Respir J. 2011;37:1199–207. doi: 10.1183/09031936.00071110. [DOI] [PubMed] [Google Scholar]
- Jobe AH, Bancalari E. Bronchopulmonary dysplasia. Am J Respir Crit Care Med. 2001;163:1723–9. doi: 10.1164/ajrccm.163.7.2011060. [DOI] [PubMed] [Google Scholar]
- Kotecha SJ, Dunstan FD, Kotecha S. Long term respiratory outcomes of late preterm-born infants. Semin Fetal Neonatal Med. 2012;17:77–81. doi: 10.1016/j.siny.2012.01.004. [DOI] [PubMed] [Google Scholar]
- Thomas EL, Parkinson JR, Hyde MJ, et al. Aberrant adiposity and ectopic lipid deposition characterize the adult phenotype of the preterm infant. Pediatr Res. 2011;70:507–12. doi: 10.1203/PDR.0b013e31822d7860. [DOI] [PubMed] [Google Scholar]
- Parkinson JR, Hyde MJ, Gale C, Santhakumaran S, Modi N. Preterm birth and the metabolic syndrome in adult life: a systematic review and meta-analysis. Pediatrics. 2013;131:e1240–63. doi: 10.1542/peds.2012-2177. [DOI] [PubMed] [Google Scholar]
- Chang HH, Larson J, Blencowe H, et al. Born Too Soon preterm prevention analysis group Preventing preterm births: analysis of trends and potential reductions with interventions in 39 countries with very high human development index. Lancet. 2013;381:223–34. doi: 10.1016/S0140-6736(12)61856-X. [DOI] [PMC free article] [PubMed] [Google Scholar]
- Platt MJ, Cans C, Johnson A, et al. Trends in cerebral palsy among infants of very low birthweight (<1500 g) or born prematurely (<32 weeks) in 16 European centres: a database study. Lancet. 2007;369:43–50. doi: 10.1016/S0140-6736(07)60030-0. [DOI] [PubMed] [Google Scholar]
- Moore T, Hennessy EM, Myles J, et al. Neurological and developmental outcome in extremely preterm children born in England in 1995 and 2006: the EPICure studies. BMJ. 2012;345:e7961. doi: 10.1136/bmj.e7961. [DOI] [PMC free article] [PubMed] [Google Scholar]
- Lee KS, Kim BI, Khoshnood B, et al. Outcome of very low birth weight infants in industrialized countries: 1947-1987. Am J Epidemiol. 1995;141:1188–93. doi: 10.1093/oxfordjournals.aje.a117392. [DOI] [PubMed] [Google Scholar]
- Costeloe K. EPICure Study Group EPICure: facts and figures: why preterm labour should be treated. BJOG. 2006;113:Suppl 3:10–2. doi: 10.1111/j.1471-0528.2006.01118.x. [DOI] [PubMed] [Google Scholar]
- Spinillo A, Montanari L, Gardella B, Roccio M, Stronati M, Fazzi E. Infant sex, obstetric risk factors, and 2-year neurodevelopmental outcome among preterm infants. Dev Med Child Neurol. 2009;51:518–25. doi: 10.1111/j.1469-8749.2009.03273.x. [DOI] [PubMed] [Google Scholar]
- Hadlock FP. Sonographic estimation of fetal age and weight. Radiol Clin North Am. 1990;28:39–50. [PubMed] [Google Scholar]
- Mikolajczyk RT, Zhang J, Betran AP, et al. A global reference for fetal-weight and birthweight percentiles. Lancet. 2011;377:1855–61. doi: 10.1016/S0140-6736(11)60364-4. [DOI] [PubMed] [Google Scholar]
- The fate of the baby under 1501 g at birth. Lancet. 1980;1:461–3. [PubMed] [Google Scholar]
- Goldenberg RL, Gravett MG, Iams J, et al. The preterm birth syndrome: issues to consider in creating a classification system. Am J Obstet Gynecol. 2012;206:113–8. doi: 10.1016/j.ajog.2011.10.865. [DOI] [PubMed] [Google Scholar]
- Smith L, Ulvund SE, Lindemann R. Very low birth weight infants (< 1501 g) at double risk. J Dev Behav Pediatr. 1994;15:7–13. doi: 10.1097/00004703-199402000-00002. [DOI] [PubMed] [Google Scholar]
- van den Berg G, van Eijsden M, Vrijkotte TG, Gemke RJ. Educational inequalities in perinatal outcomes: the mediating effect of smoking and environmental tobacco exposure. PLoS ONE. 2012;7:e37002. doi: 10.1371/journal.pone.0037002. [DOI] [PMC free article] [PubMed] [Google Scholar]
- Baron IS, Rey-Casserly C. Extremely preterm birth outcome: a review of four decades of cognitive research. Neuropsychol Rev. 2010;20:430–52. doi: 10.1007/s11065-010-9132-z. [DOI] [PubMed] [Google Scholar]
- Saigal S, Doyle LW. An overview of mortality and sequelae of preterm birth from infancy to adulthood. Lancet. 2008;371:261–9. doi: 10.1016/S0140-6736(08)60136-1. [DOI] [PubMed] [Google Scholar]
- Aylward GP, Hatcher RP, Stripp B, Gustafson NF, Leavitt LA. Who goes and who stays: subject loss in a multicenter, longitudinal follow-up study. J Dev Behav Pediatr. 1985;6:3–8. [PubMed] [Google Scholar]
- Tin W, Fritz S, Wariyar U, Hey E. Outcome of very preterm birth: children reviewed with ease at 2 years differ from those followed up with difficulty. Arch Dis Child Fetal Neonatal Ed. 1998;79:F83–7. doi: 10.1136/fn.79.2.f83. [DOI] [PMC free article] [PubMed] [Google Scholar]
- Wariyar UK, Richmond S. Morbidity and preterm delivery: importance of 100% follow-up. Lancet. 1989;1:387–8. doi: 10.1016/s0140-6736(89)91764-9. [DOI] [PubMed] [Google Scholar]
- Wolke D, Ratschinski G, Ohrt B, Riegel K. The cognitive outcome of very preterm infants may be poorer than often reported: an empirical investigation of how methodological issues make a big difference. Eur J Pediatr. 1994;153:906–15. doi: 10.1007/BF01954744. [DOI] [PubMed] [Google Scholar]
- Lawn J, Davidge R, Paul V, et al. Preterm baby survival and care around the world Born Too Soon: The Global Action Report on Preterm Birth New York; March of Dimes, PMNCH, Save the Children, World Health Organization; 2012 . ( http://www.who.int/pmnch/media/news/2012/borntoosoon_chapter5.pdf .) [Google Scholar]
- Dean S, Bhutta Z, Mason E, et al. Care before and between pregnancy Howson C, Kinney M, Lawn J.Born Too Soon: The Global Action Report on Preterm Birth New York; March of Dimes, PMNCH, Save the Children, World Health Organization; 2012 . ( http://www.who.int/pmnch/media/news/2012/borntoosoon_chapter3.pdf .) [Google Scholar]
- Roberts D, Dalziel S. Antenatal corticosteroids for accelerating fetal lung maturation for women at risk of preterm birth. Cochrane Database Syst Rev. 2006;19:CD004454. doi: 10.1002/14651858.CD004454.pub2. [DOI] [PubMed] [Google Scholar]
- Modi N, Clark H, Wolfe I, et al. writing group of the Royal College of Paediatrics and Child Health Commission on Child Health Research A healthy nation: strengthening child health research in the UK. Lancet. 2013;381:73–87. doi: 10.1016/S0140-6736(12)61818-2. [DOI] [PubMed] [Google Scholar]
Associated Data
This section collects any data citations, data availability statements, or supplementary materials included in this article.


