

Abstract
Typically developing (TD) preschoolers and age-matched preschoolers with specific language impairment (SLI) received event-related potentials (ERPs) to four monosyllabic speech sounds prior to treatment and, in the SLI group, after 6 months of grammatical treatment. Before treatment, the TD group processed speech sounds faster than the SLI group. The SLI group increased the speed of their speech processing after treatment. Post-treatment speed of speech processing predicted later impairment in comprehending phrase elaboration in the SLI group. During the treatment phase, change in speed of speech processing predicted growth rate of grammar in the SLI group.
Keywords: event-related potentials, ERP, topographical ERP analysis, speed of speech processing, specific language impairment, grammatical treatment, grammar
Children with specific language impairment (SLI) have marked language delays in all aspects of language and specific difficulty with grammar (Leonard, 1998). Speed of speech processing may account for some of the grammatical problems and may be affected by grammatical treatment.
Speed of Speech Processing in Children with SLI
At least twenty-two studies report that children with SLI process acoustic stimuli inefficiently (i.e., slowly, Leonard, 1998). Phonemes (i.e., speech sounds) are only one example of the type of stimuli children with SLI have difficulty processing (Ellis Weismer & Evans, 2002). In the current study, we focus on phoneme processing because these stimuli are potentially more relevant than other auditory stimuli to the special problems children with SLI have with grammar.
Slow speech processing may result in children reducing language input to component word roots without retaining the problematic morphemes (e.g., “go” instead of “goes”). Functionally, the result may be that the child processes fewer exemplars of grammatical morphemes in child-directed language input (Benasich & Leevers, 2003). Additionally, less automaticity of processing low-level phonemic distinctions could result in fewer resources for grammatical analysis of linguistic input (Shafer, Ponton, Datta, Morr, & Schwartz, 2007). Incomplete analysis of linguistic input could result in impoverished grammatical knowledge, which would result in grammatical deficits in comprehension and production of language. The source of linguistic processing deficits is not under investigation in this study. However, potential explanations include slower information processing in all modalities, poor auditory processing, and poor phonological working memory (Ellis Weismer & Evans, 2002; Rosen, 2003; Tallal, Miller, Jenkins, & Merzenich, 1997).
Several studies report that auditory processing deficits are not universal within the population of children with SLI (Bishop, Bishop, Bright, James, Delaney, & Tallal, 1999a; Bishop, Carlyon, Deeks, & Bishop, 1999b; McArthur & Bishop, 2001). Therefore, wide variability in speed of speech processing probably exists within the population of children with SLI (McArthur & Bishop, 2001). Thus, inefficient auditory processing is unlikely to be the primary cause of the language impairments in all children with SLI (Weber-Fox, Leonard, Wray, & Tomblin, 2010). Regardless, individual differences in speed of auditory processing could account for some of the variance in grammatical growth or impairment in many children.
Event-Related Potentials (ERPs) as an Approach to Measuring Speed of Speech Processing
One option for measuring speed of speech processing is through the brain’s response to speech sounds as assessed through ERPs. ERPs are portions of the electroencephalogram that are time locked to a stimulus onset. ERPs measure brain responses to stimuli on the scale of milliseconds, thus providing excellent temporal resolution. So called 'passive' ERP procedures do not require a child to generate an active behavioral response during data collection and may thus be particularly useful in studying preschoolers with SLI with attentional deficits. Moreover, passive ERP procedures are particularly desirable for assessing young children with disabilities who may have difficulty remaining engaged or understanding and remembering the task demands of active behavioral tests.
The broad peak around 100ms as a probable indicator of automatic processing of auditory stimulus differences in typical development
When inter-stimulus intervals (ISIs) are under 4 seconds (as in the current study), young children’s ERP responses to speech sounds are dominated by a broad fronto-central positive peak around 100 ms post-stimulus. This is reliably followed by a fronto-central negative peak at approximately 200 – 250 ms post-stimulus (Ceponiene, Lepisto, Alku, Aro, & Naatanen, 2003; Mills, Coffey-Corina, & Neville, 1997; Shafter et al., 2007).
The amplitude of 1st broad peak that reaches a maximum around 100 ms post-stimulus to auditory stimuli has been found to predict later verbal standard scores in pre-term children at 5 years (Mikkola et al., 2007). Additionally, the fronto-centrally-measured amplitude differs between speech sounds in typically developing children and in children with SLI (Shafer, Ponton, Datta, Morr, & Schwartz, 2007). In adults, side of button-pressing and amplitude of this peak at the right temporal region of the scalp differed by phoneme when the stimulus crossed the phonological category boundary. These two approaches to stimulus differentiation did not differ by stimuli on the same side of the phonological category boundary (Molfese, 1978). In typically developing preschoolers, the location on the scalp (i.e., electrode) at which ERP-measured phoneme differentiation during the temporal range including 100 ms is likely to be detected is not well understood because most of the auditory ERP work has been conducted on on infants and older children, and the studies of preschool children usually used few electrodes (Wunderlich & Cone-Wesson, 2006).
Quantification of Brain Activity via Topographic ERP Analyses (TEA)
TEA quantifies the spatial configuration of the brain's electrical field over the entire scalp, not just a single electrode or region (Murray, Brunet, & Michel, 2008; Murray, De Lucia, Brunet, & Michel, 2009, Tzovara, Murray, Michel, & De Lucia, in press). Therefore, TEA does not require pre-selecting individual electrodes to quantify ERPs. Unlike the traditional peak amplitude and latency measures, TEA quantifies data from each condition in terms of the overall response strength (global field power or GFP; Lehmann & Skrandies, 1980; Koenig & Melie-Garcia, 2010) and strength-independent differences in topographic distribution. This latter feature is quantified using global dissimilarity (DISS; Lehmann and Skrandies, 1980) and is akin to the spatial correlation coefficient (see formula in Murray et al., 2008). The topography of the brain’s electrical field at the scalp is a reference-independent feature that reflects the instantaneous summation of active intracranial generators. The ERP topography has been demonstrated to be reliably stable for short post-stimulus intervals, termed microstates (Lehmann, 1987). Each of these microstates can be characterized by a distinct topography, colloquially referred to as a “template map”, with specific onset and offset times. A template map may be linked to sensory or cognitive processes that are manifested as stimulus-related differences in topography or response strength. In our case, the process of interest is syllable differentiation (i.e., /ba/ vs. /pa/ and /da/ vs. /ga/). The earliest occurring microstate at which stimuli differ is pertinent in the current study because we are interested in the extent to which stimulus differentiation is automated (Shafter et al., 2005). As mentioned earlier, the earliest occurring microstates that are contemporaneous with either GFP or DISS differences between auditory stimuli in typical participants tend to occur at a temporal range that includes 100 ms post-stimulus (e.g. De Lucia, Clarke,& Murray, 2010; De Santis, Clarke,& Murray, 2007; Murray, Camen, Andino, Bovet, & Clarke, 2006).
Advantages of a Normative Approach to Identifying Template Maps Associated with Syllable Differentiation
Just as norm-referenced behavioral tests use departure from the central tendency of typically developing children’s performance to assess “delay”, a similar logic is needed for clinicians to use ERPs to identify the extent to which an individual child’s speech processing is “slow”. For example, a normative approach to using ERPs to assess “slow” speech processing requires that we identify the “typical” post-stimulus timing at which the brain activity differs between stimuli. We recognize that, when fully realized, a normative approach will eventually require sampling a large group of typically developing children at different ages in a representative manner and collecting ERP data from them in the same way with the same stimuli. However, to illustrate the feasibility of a normative approach to using the TEA, the present study will use an age-matched convenience sample of typically developing (TD) preschoolers to identify template maps associated with syllable differentiation. Once TD-identified template maps have been selected for each stimulus, one can use the TEA to identify the timing of topographically-similar activation patterns within individual participants. In this way, we can measure the timing of nearly-typical patterns of brain activation that are associated with syllable processing.
Speed of Speech Processing as a Predictor of Grammar in the SLI Sample
If the ERP measure we have discussed is a construct valid measure of speed of speech processing and if speed of speech processing affects grammatical knowledge, speed of speech processing should be negatively associated with grammar and change in speed of speech processing should be positively related to growth rate of grammar in SLI children. Such evidence would be examples of the type of evidence that Cronbach and Meehl (1955) recommended in their approach to testing the construct validation of psychological measures that they called the nomological network validation approach. Testing grammatical knowledge through the comprehension and production and assessing level of grammatical impairment and grammatical growth rate allows a more complete test of the proposed association than does using only one of these metrics for grammar. Another way to assess the validity of our proposed measure of speed of speech processing is to test whether initial speed of speech processing predicts the relative efficacy of grammatical treatments.
Two Grammatical Treatment Methods
Two grammatical therapy methods are Milieu Language Teaching (MLT) and Broad Target Recasting (BTR). MLT therapists elicit child production of exemplar sentences for pre-selected grammatical structures. BTR therapists rely on children processing restatements of children's immediately prior utterances as more complete or different grammatical sentences (i.e., grammatical recasts) without eliciting production of the adult's recast. Both methods have been shown to facilitate grammar in children with a variety of disabilities (Yoder, Molfese, & Gardner, 2011). More information on these treatments is available in the primary report on this RCT (Yoder et al., 2011).
The Normalizing Hypothesis
The normalizing hypothesis posits that treatments that increase children’s speed of processing language input may help children learn from many people's child-directed speech, even if the speakers do not use specialized strategies when talking to children with SLI. Grammatical treatments may increase the speed of speech processing because effective treatments provide much practice in processing language, a component of which is phonemic processing. MLT and BTR use methods that provide children with such practice, despite their possible speech processing impairments. Evidence that is compatible with normalizing would be an increase of speed of speech processing after grammatical treatment such that there was statistical equivalence in speed of speech processing between the SLI and TD samples.
For Slow Speech Processors, MLT may Facilitate Grammatical Development Better than BTR
In slow speech processors, MLT's added requirement that children produce example sentences with targeted grammatical structures might garner children's attention to the needed grammatical information in the adult's utterance more consistently than do recasts alone, in part because one or two immediately repeated MLT teaching trials are provided when the child’s production attempt does not contain the targeted grammatical structure. BTR does not elicit production of phrases or sentences containing grammatical targets. Instead, recasts are thought to facilitate grammatical development because their temporal proximity and semantic overlap with the immediately preceding child utterance aids the child’s comparison between his utterance and the recast, making the new grammatical information the recast provides salient. However, slow speech processors may not be able to process the salient grammatical information in as many recasts as faster speech processors. Additionally, the pre-selected targets in MLT may concentrate the linguistic input on fewer grammatical structures that are within the child’s zone of proximal development (Vygotsky, 1978). BTR provides grammatical input on a wider variety of grammatical targets thus dispersing its input across many structures. In contrast, relatively fast speech processors may benefit from either treatment, because they can completely process the grammatical information in the adult's child-directed speech regardless of whether it is a model to be imitated or a recast and can do so across a variety of grammatical structures.
Hypotheses
Five hypotheses were tested: (a) Preschoolers with SLI have slower speech processing as indexed by TEA before grammatical treatment, but not after treatment, as compared to age-matched typically developing (TD) children. (b) Preschoolers with SLI become faster in their speech processing following 6 months of grammatical treatment. (c) For children with SLI who are initially relatively slow speech processors, MLT will facilitate faster productive grammatical growth than BTR. (d) Post-treatment speed of speech processing will be negatively associated with subsequent impairment in comprehension of grammar in the SLI group. (e) Change in speed of speech processing will be positively related to growth rate of grammar during the treatment phase in the SLI group.
Methods
Participants
Fifty-nine typically developing (TD) preschoolers were recruited who were chronologically age-matched within 2 weeks on each side of the chronological age of the paired child with SLI (TD group). The forty-seven children in the TD group met the same age, speech accuracy, intelligibility, non-verbal intelligence, hearing, and adoption criteria as used for selecting the SLI sample. To qualify for the TD group, the children also had to score within 1 SD of the mean on the Preschool Language Scale III (PLS-3, Zimmerman, Steiner, Pond, 1992) and have no reported concerns about developmental or sensory functioning.
Children with SLI had to (a) have delayed expressive language as evidenced by mean length of utterance (MLU) 1.29 SD below that expected for their age (using Miller and Chapman, 1981 formula) or score below the 11th percentile on the Expressive Communication Subscale on the Preschool Language Scale III (Zimmerman, et al., 1992), and (b) fall below the autism cut-off score of 30 (i.e., not autistic) on the Childhood Autism Rating Scale (Schopler, Reichler, & Renner, 1999). To increase the probability that the children with SLI were appropriate for both of the interventions, the children's language during a 20-minute language sample had to demonstrate (a) an average initial mean length of utterance in morphemes (MLU) between 1.0 – 3.5, (b) a total of at least 10 different words, and (c) at least 20 recastable utterances.
Forty-seven preschoolers with SLI received treatment and had sufficient number of artifact-free ERP data (at least 16 trials) at Time 1 and Time 2. Comparison of the SLI and the TD preschoolers at Time 1 is available in Table 1. In addition to age and cognition, the diagnostic groups were comparable on sex, X2(1) = 1.3, p = .52. Children with SLI were randomly assigned to one of two treatment groups (BTR n = 24, MLT = 23). The SLI treatment groups were very similar in age, language scores, IQ, and mental age at the pretreatment period (Yoder et al., 2011). Comparability between treatment groups on the pre-treatment measure of grammar and putative moderator will be reported in the results section. Additional information about the children and parents is available in Yoder et al., 2011).
Table 1.
Means (M) and Standard Deviations (SD) of Participant Descriptors by Diagnostic Group
| TD (n = 59) M(SD) |
SLI (n = 47) M(SD) |
|
|---|---|---|
| Age in years | 3.5(.7) | 3.5(.6) |
| Expressive Language a | ||
| Age equivalency | 48 mos(11) | 28 mos(5) |
| Percentile Ranking | 64(27) | 5(3) |
| Nonverbal Cognition b | ||
| Standard Score IQ | 106(13) | 100(11) |
Preschool Language Scale III, expressive scale (Zimmerman, et al., 1992).
Leiter International Performance Scale-Revised (Roid & Miller, 1997).
Procedures
ERPs and the measure of speed of speech processing
ERPs were collected at pre-treatment for SLI and TD samples and at post-treatment for the SLI sample. The ERP data provided the basis for the measure of speed of speech processing.
Desensitization to the ERP net
Prior to ERP sessions, seven of the SLI children needed 20-minute desensitization sessions in which children learned to sit still while watching a video while increasingly wet head-wear was put on their head. Of the seven, one child received three, another child received two, and the rest received one desensitization session prior to ERP data collection. None of the TD sample needed desensitization sessions.
Preparation for and equipment and software used to collect the ERP
Using standard application procedures, the 129-electrode net (Geodesic Sensor Net 200, EGI, Inc., Eugene, OR), after soaking in a warm saline solution, was placed on the child’s head. During data collection, all electrodes were referenced to Cz. Impedances were adjusted to <40 K Ohms prior to test commencement, and re-checked again at the end, of the test session. EEG recording was controlled by Net Station software (v. 4.1–4.2; EGI, Inc., Eugene, OR). EEG signals were sampled at 250 Hz with filter settings maintained at 0.1 Hz (high pass) and 100 Hz (low pass). Stimulus presentation was controlled by E-Prime (v. 1.1–1.2, PST, Inc., Pittsburgh, PA).
The child’s experience during ERP data collection
An age-appropriate video was shown during the entire testing session. During stimulus presentation, the video remained on with the sound muted. All stimuli were presented through a speaker positioned 1 meter above the midline of the child’s head. EEG and behavior were continuously monitored throughout testing. All stimuli were matched in loudness levels at 75 dB SPL(A), as measured at the child’s ear. The session lasted between 30 and 40 minutes.
The stimuli
Two contrasts were tested: a place of articulation (POA) contrast (/da/ vs. /ga/) and a voice onset (VOT) contrast (/ba/ vs. /pa/). Many previous researchers using speech stimuli that vary on POA or VOT have been motivated by a rapid temporal processing theory (e.g., Tallal, Miller, Jenkins, & Merzenich, 1997). However, using such stimuli in the current study should not be viewed as an intention to test the rapid temporal processing theory. We selected the stimuli because repeated demonstrations indicate that ERPs are sensitive to such stimulus differences (Molfese, Key, Maguire, Dove, & Molfese, 2005).
The POA stimulus set contained four consonant-vowel (CV) syllables designed to represent prototypical and transitional tokens for /da/ and /ga/. These were distinguished by the F2 frequency. F2 is the 2nd formant (i.e., a peak in acoustic resonance), which corresponds directly with constriction of the vocal track (Delattre, Liberman, & Cooper, 1955, Story & Bunton, 2010). Formants are described by the frequency of their spectrogram (i.e., a visual and quantitative representation of the acoustic resonance). The F2 frequencies for the prototypical stimuli were 1700 and 1640 Hz for /da/ and /ga/, respectively, with transitional token having F2 frequencies between these values. The VOT continuum was manipulated by beginning voicing of the vowel at 0, 20, (both intended to be /ba/), 40 and 60 (both intended to be /pa/) ms from the onset of the syllable. The prototypical /ba/ had 0 ms delay in the voicing and the prototypical /pa/ delayed voicing for 60 ms after syllable onset.
Except for the frequency of F2 for POA contrast or the voice onset time for VOT contrast, all other attributes of the stimuli were identical. All stimuli were matched in intensity, rise and decay times (40 ms), formant number (5), and duration (i.e., 250 ms). The stimuli were synthesized on a Klatt (cascade) synthesizer, so that the amplitudes of individual formants were modulated as a function of the respective formant frequencies, as in natural speech. The central frequencies of the steady-state portion of the formants were kept constant across different consonants.
The VOT stimuli were presented in a separate block from the POA stimuli and order of blocks was counterbalanced across children. Each block contained 45 presentations of sets of the four syllables (e.g., prototypical and transition tokens for /da/ and /ga/) in a random order. The inter-stimulus interval (ISI) varied randomly from 1.8 to 3.2 seconds. This equiprobable stimulus presentation method (i.e., equal number of stimulus presentations per stimulus) was proposed because it allowed us to maximize the number of analyzed trials while keeping the procedure sufficiently short for active preschoolers, thereby maximizing the number of children with analyzable data.
ERP data processing
Following data collection, signals were filtered again using a 30 Hz digital low-pass filter to eliminate higher frequencies from the data records. EEG records were segmented on stimulus onset to include a 100-ms pre-stimulus baseline and a 600 ms post-stimulus interval. Resulting single trials were screened using NetStation and manual procedures for eye-related artifacts. Trials with eye channel (electrode) differences in excess of 70 µV or more than 12 bad electrode channels (defined as detecting voltage shifts in excess of 150 µV within and across trials) were rejected. Data for electrodes characterized by consistently high noise levels were replaced using the spherical spline interpolation algorithm (Perrin, Pernier, Bertrand, Echallier, 1989). Following artifact screening, the single-trial data were averaged within each stimulus condition, the average reference was computed, and baseline correction was applied using the pre-stimulus period. Data from electrodes located at the perimeter of the electrode net were excluded from further analysis because artifacts frequently occurred at these electrodes due to poor scalp contact. A range of 16 – 45 “good” trials occurred, with a minimum of 16 trials per stimulus required for retention of the participant. Only the trials for the prototypical tokens were analyzed because these were discriminated by adults at 98% accuracy (SD = 3%), while transitional tokens were discriminated by adults at 65% (SD = 31%) accuracy. A match-to-sample discrimination paradigm was used to assess adult perception of stimuli.
Deriving the measure of speed of speech processing
A four-step process was followed using the Cartool software (http://sites.google.com/site/fbmlab/cartool; Murray et al., 2008; Murray et al., 2009; Brunet, Murray, & Michel, 2011). Figure 1 illustrates this process. Steps 1 and 2 occurred in the TD sample only. In Step 1, for each contrast (i.e. VOT and POA), analyses of global field power and global dissimilarity (Lehmann and Skrandies, 1980) were performed on the entire peri-stimulus epoch from 100ms pre-stimulus to 600ms post-stimulus onset. Both of these measures are reference-independent and consider the data at each time sample across the scalp as a vector (see Figure 2 for results). In this regard, these analyses use a multivariate approach that circumvents common circularity caveats (e.g. Kriegeskorte et al. 2009). Global field power (GFP) is the root mean square across the electrode montage and yields higher values for stronger responses (Koenig and Melie-Garcia, 2010). Global dissimilarity (DISS) is the root mean square of the difference between two GFP-normalized vectors. It can range from 0 to 2, with 0 indicating topographic equivalence and 2 indicating topographic inversion. For readers less familiar with DISS, it should be noted that DISS also equals the square root of the 2 minus 2 times the spatial correlation coefficient (Murray et al., 2008). Mean GFP waveforms were analyzed with a paired t-test at each time sample. Only effects meeting or exceeding a p-value ≤0.05 for at least 10 consecutive time samples were considered reliable (Guthrie & Buchwald, 1991). Global dissimilarity was analyzed using a Monte Carlo bootstrapping procedure that is colloquially referred to as topographic ANOVA (TANOVA; Murray et al., 2008).
Figure 1.
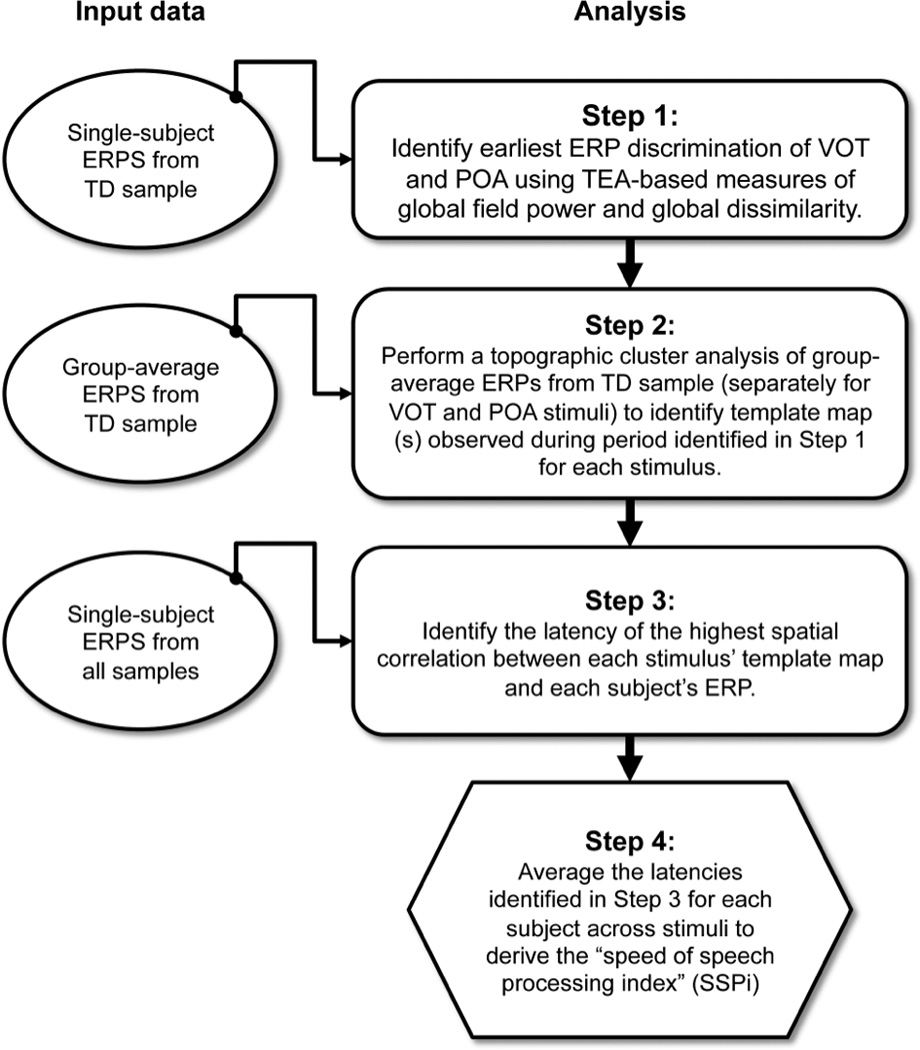
Flowchart of process used to derive speed of speech processing index. The left side of the flowchart indicates the input data for each of the analyses described on the right side of the flowchart.
Figure 2.
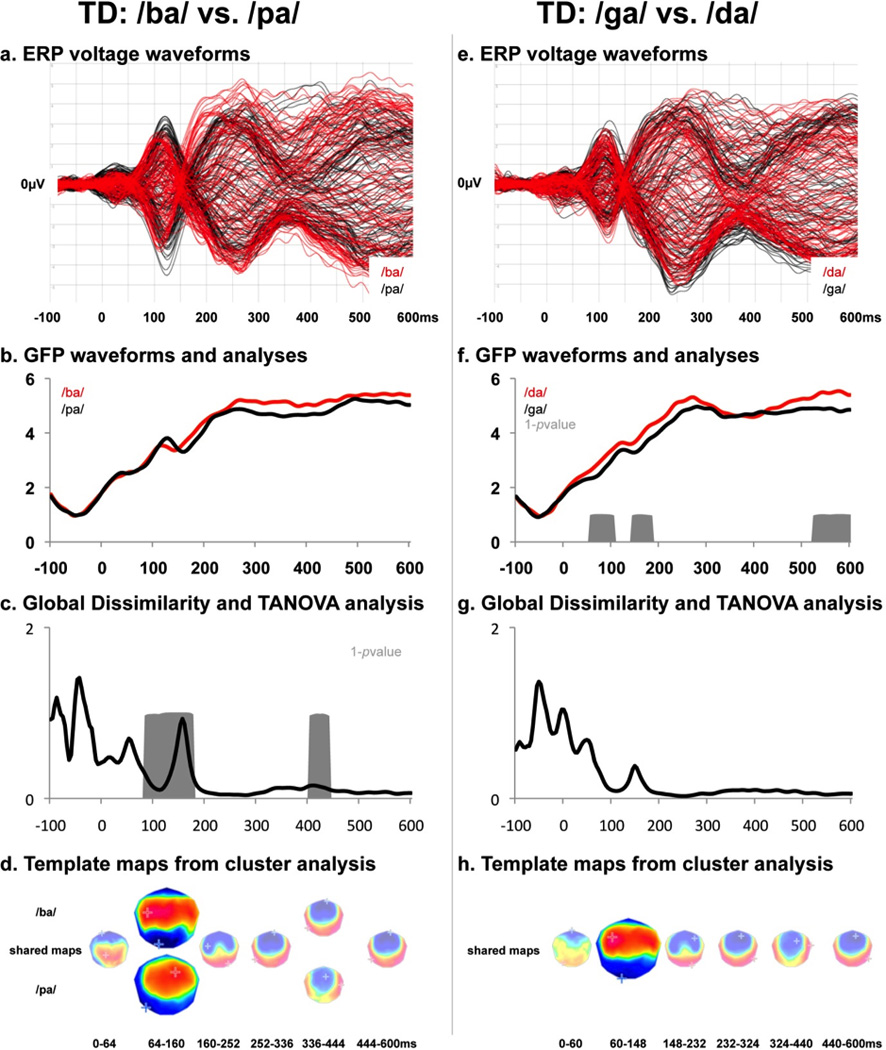
Results of the TEA of TD sample for the place of articulation (POA) and voice onset time (VOT) comparisons. Panels a and e display the group-averaged ERP across the electrode montage as a butterfly plot (i.e. with all voltage waveforms superimposed). Panels b and f display the group-averaged global field power (GFP) waveforms with gray areas indicative of significant differences using a paired t-test (p<0.05 for minimally 11 consecutive time samples). Panels c and g display the global dissimilarity (DISS) of the group-average ERPs as well as periods of significant topographic differences based on a Monte Carlo permutation analysis (gray areas; p<0.05 for minimally 11 consecutive time samples). Panels d and h display the results of the topographic cluster analysis performed on the group-averaged ERPs for each comparison separately, as well as the time period when a given template map was observed in the group-average ERPs. Maps are 2D projections with left hemiscalp on the left and nasion upwards. Maps are individually scaled to their maximum/minimum voltages, which are are indicated by red and blue crosses, respectively. Those template maps observed during the earliest period of significant differences in either GFP or DISS are highlighted.
In Step 2, hierarchical clustering was applied to the group-averaged ERP data from the TD sample over the full −100 to 600ms epoch. Separate clustering was performed with the concatenated group-average ERPs from the POA and VOT stimulus sets, respectively. Details of the clustering algorithm can be found in Murray et al. (2008). In the case of the present study, the following parameters were applied during clustering: merge clusters with greater than 90% spatial correlation and keep clusters with a minimal duration of 10 time samples. The optimal number of clusters was selected as the fewest number of clusters also meeting the following criteria: 1) a global explained variance of at least 80% for the concatenated ERPs from both stimuli of a given contrast, 2) a local cross-validation criterion minimum, and 3) a local Krzanowski-Lai criterion peak that was subsequent to the initial peak (see Murray et al., 2008 for details regarding these combined criteria). The output of this clustering analysis produced a set of template maps and their sequence within the group-average ERP to each stimulus. The goal of Step 2 was to identify the template maps for each stimulus that were observed over the time period identified from the analyses in Step 1, above. These template maps were considered to indicate the “typical” pattern of brain activity at the scalp elicited by each stimulus during the initial period of stimulus discrimination.
Steps 3 and 4 were applied to individual ERPs from each stimulus and in both diagnostic groups, including both measurement periods for the SLI group. To characterize individual differences, the spatial correlation was computed between individual ERPs and the TD-group-level template maps at each post-stimulus time sample. The latency of the highest spatial correlation was identified for each sound and averaged across sounds (Step 3). This latency was interpreted as the “latency of nearly-typical automatic processing of the speech sound”. Finally, the “speed of speech processing index” (SSPi) was derived by averaging within each participant the latency of nearly typical automatic processing across speech sounds (Step 4). Extant data were not available to support an a priori prediction of particular speech sounds that would be better than others for predicting benefit from a grammatical treatment or measures of grammar. Additionally, taking the across-stimuli average within the individual participant theoretically affords a more valid indicator of speed of speech processing and reduces the number of significance tests compared to analyzing each sound as a separate variable (Rushton, Brainerd, & Pressley, 1983).
For example, the best spatial correlations of ERP voltages of selected template maps with ERP voltages at the time sample at which the spatial correlation was at its max for participant 5 in the SLI sample were .91, .75, .68, and .86, for /da/, /ga/, /ba/, and /pa/, respectively. These occurred at 116, 108, 96, and 128 ms post-stimulus, which when averaged together results in 112 ms.
Language samples and the measure of productive grammatical level
At each of the six measurement periods, two 20-minute language samples were obtained. The examiner used a well-specified interaction style. Prescribed sets of toys, rotated by time period on an established schedule, were used to counter boredom. To assess far-transfer of trained grammatical structures, the examiner, toys, and interaction style differed from those used in treatment sessions. Language samples were transcribed from digitized recordings using ProcoderDV software (Tapp, 2003). The transcription of child utterances were also coded for bound morphemes (Miller & Chapman, 1993). The orthographed and coded language sample pairs were concatenated to yield one larger sample. The Index of Productive Syntax (IPSyn) module of the Computerized Profiling program (CP, Long, Fey, & Channell, 2000) with subsequent editing by a trained speech-language-pathologist was used to provide IPSyn coding. The total IPSyn score reflects the child's use of particular major syntactic and morphological structures in the language sample (Scarborough, 1990). Inter-observer reliability (intra-class correlation coefficients) on 20% of the randomly selected concatenated language samples for each period and treatment group on the total IPSyn ranged from .76 to .96 (mean = .86, SD = .07). More information on the measure of productive grammar is available in Yoder et al. (in press).
The Test of Auditory Comprehension of Language, revised (TACL-3, Carrow-Woolfolk, 1999)
The standard scores from the grammatical morpheme and elaborated phrases subscales of the TACL-3 were used as a measure of degree of impairment in grammatical understanding at the follow-up period (i.e., 5 months after the treatment phase ended). Grammatical morphemes sampled include word endings (e.g., plural, past, progressive), negation, comparatives (e.g., bigger), and tense and number variation for the copula (i.e., linking verbs) and auxiliary (i.e. helping verbs). Elaborated phrases that were sampled include the proper use of adjectives, negation, locatives, concatenatives, and embedded clauses. TACL-3 subscale standard scores have a population mean of 10 and SD of 3. Internal consistency of these subscales are in the .90s, while the test-retest reliabilities are in the .80s. TACL-3 grammatical morpheme and elaborated phrases subscales scores correlated with subscales of another language test between .65 and .85 (Carrow-Woolfolk, 1999).
Grammatical Treatments
Therapy sessions lasted 30-minute and were offered 3 times per week for a 6-month period. These 1:1 sessions occurred at a university clinic. Speech-language pathologists (SLPs) implemented the treatments after being trained for 1 month in their prescribed treatment. Quality and consistency of treatment implementation was monitored by a senior-level SLP, who was, in turn, trained by the first author. Fidelity of treatment implementation was assessed by coding the middle 15 minutes of sessions occurring at the 2nd, 4th, and 6th month of the treatment phase for all SLI participants. Number and quality of the teaching episodes were coded. Inter-observer reliability on the coding was assessed on a random sample of 20% of the treatment sessions coded. More information about the treatments is available in Yoder et al. (in press).
Ninety-six percent of the offered sessions were attended, with no difference between treatment groups (BTR M = 68.9/72, SD = 3.1; MLT M = 68.6/72, SD = 3.2). The rate per minute of the presumed active ingredient (grammatical recast for BTR and correct teaching episode for MLT) was considered excellent for both treatments (BTR M = 4.3, SD = .74; MLT M = 3.2, SD = .57). The average proportion of teaching episodes that were correctly implemented in the MLT group was .89 (SD = .17). The average proportion of opportunities recasted in the BTR group was .80 (SD = .07). The ICC for the rate of recasts per minute averaged .97 (SD = .01, range = .96 - .98). The ICC for rate of correct teaching episodes per minute was .95 (SD = .02, range = .94 - .98). More information on fidelity of treatment is available in Yoder et al. (in press).
Analysis Approach Used for Hypothesis 3 and 5
When the hypothesis test involved grammatical growth (Hypotheses 3 and 5), mixed level modeling was used because growth modeling with at least 5 measurement periods has been shown to provide more statistically powerful tests of effects involving treatments than other approaches (Maxwell, 1998). The values for Time variable were set to "0" at study entry, while Time values at other assessment periods were time from entry in months. This allowed treating Time as a continuous variable and allowed interpreting the intercept of growth curves as an estimate of initial IPSyn total score. We sought to fit growth with a straight line because doing so affords a straightforward interpretation of slope as growth rate. Level 2 variables relevant to hypotheses tested by mixed level modeling will be indicated in the relevant section of the results section. Significance tests of fixed effects (i.e., t tests) are the tests of hypotheses.
Results
Preliminary Findings
TEA findings
Group-average ERPs from the TD sample are displayed for the VOT and POA manipulations separately in Figures 2a and 2e, respectively. For the VOT manipulation within the TD sample, differences between ERPs to /ba/ and /pa/ first manifested as topographic differences over the 74–180ms post-stimulus interval with no evidence for GFP modulations (Figures 2b–c). For interpretation purposes, it is useful to note that DISS is a reflection of the extent to which momentary ERP topographies are spatially correlated between stimulus files in a group of participants. Significant DISS means that topographies are dissimilar (i.e., relatively uncorrelated). Non-significant DISS means that topographies are similar (i.e., relatively positively correlated). For the POA manipulation within the TD sample, differences between ERPs to /da/ and /ga/ first manifested as GFP differences over the 56–108ms post-stimulus interval with no evidence of differences in ERP topography (Figures 2f–g).
Using the grand-average data across TD participants but within each stimulus as the input data, the cluster analysis for the VOT manipulation indicated that 82% of the variance could be accounted for by 8 template maps for the /ba/ vs. /pa/ contrast (Figure 2d). Consistent with the abovementioned differences in topography between stimuli, one template map was observed in response to the /ba/ stimulus and another in response to the /pa/ stimulus. The cluster analysis for the POA manipulation indicated that 95% of the variance could be accounted for by 7 template maps for the /da/ vs. /ga/ contrast (Figure 2h). Consistent with the abovementioned differences in global field power but nonsignificant global dissimilarity, the same template map was observed for both /da/ and /ga/ stimuli.
As detailed in the Methods, a speed of speech processing index was calculated for each participant. The across-stimulus average of the best spatial correlation between an individual’s ERP and the TD-identified template map associated with the stimulus processing was .58 (SD = 0.15) for the TD sample, 0.58 (SD = 0.13) for the SLI sample at the pre-treatment period, and 0.57 (SD = 0.13) for the SLI sample at the post-treatment period (Figure 3b). Using an r (i.e., an effect size for associations) of .05 as the basis for judging statistical equivalence (i.e., delta), these mean spatial correlations were statistically equivalent across diagnostic groups (Tyron & Lewis, 2008). The mean spatial correlations indicate the degree to which the pattern of brain activity quantified by the TD group’s template map actually occurred in individual participants for both diagnostic groups. The average speed of processing within the SLI group at Time 1 was comparable between the MLT (M = 161, SD = 59) and BTR (M = 176, SD = 67) groups, t(46) = .88, p = .39.
Figure 3.
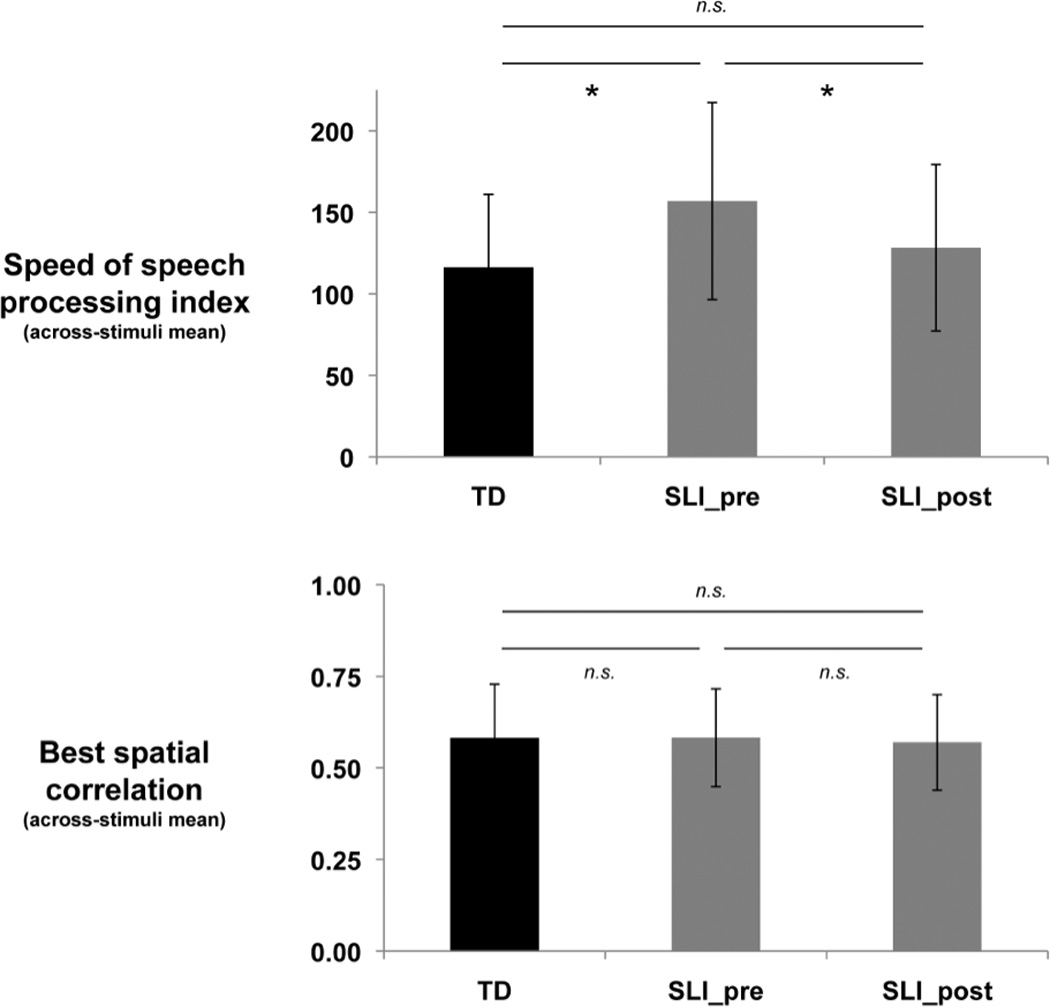
Analyses of speed of speech processing indices. The top panel displays the mean (±1 SD indicated) speed of speech processing indices, while the bottom panel displays the mean (±1 SD indicated) best spatial correlation. Data are shown from both the TD and SLI sample, as well as at both pre-treatment and post-treatment measurements in the case of the SLI sample.
Behavioral findings
As explained in detail in the Yoder et al (in press) report, the slope of the linear growth curve for the total IPSyn score was used to quantify the rate of growth of productive grammar. The average rate of growth on the IPSyn total score was about 1.5 points for each month in the study. Both the intercept, t(45) = 23, p < .001, and slope, t(45) = 12, p < .001, were significantly different from zero, and the intercept, X2(45) = 324; p < .001, and slope, X2(45) = 87, p < .001, had significant variance. Importantly, the treatment groups within the SLI sample were very similar at Time 1 on the measure of grammar (MLT M = 38.4, SD = 13.3; BTR M = 38.5, SD = 12.5).
Test of Primary Hypotheses
H1: The speed of speech processing is slower is children with SLI than in age-matched typical peers at pre-test, but not at post-test
Speech processing was faster in the TD (M = 116 ms post-stimulus, SD = 45 ms) than in the SLI (M = 157 ms, SD = 61 ms) children before treatment, t(104) = 3.99, p = 0 .0002, d = 0.76, but not after treatment, M for SLI= 128 ms post-stimulus, SD = 51 ms, t(104)=1.25, p=0.214, d = 0.25 (Figure 3a). Using a Cohen’s d of 0.1 as the basis for inferring statistical equivalence, the post-treatment speed of processing in the SLI group was not statistically equivalent to the speed of processing in the TD group, but was non-significantly different (i.e., indeterminantly different, Tyron & Lewis, 2008). Because the speed of speech processing in the TD sample was tested only at the pre-treatment period, an alternative explanation for the statistical equivalence might have been age differences in the TD group at pre-treatment period relative to that of the SLI group at post-treatment period. However, this was not the case. Chronological age at time of testing was not associated with speed of speech processing in the TD group (r = -.04) or in the SLI group at the post-treatment period (r = -.25, ns).
H2: Post-test speed of speech processing is faster than pre-test speed of speech processing
Within the SLI group, children were significantly faster at speech processing after the 6-month grammatical treatment, t(46) = 2.93, p = 0.005, d = 0.49. See Figure 3a.
H3: Pre-test speed of speech process will statistically interact with treatment group to predict rate of grammatical growth in the SLI group
This hypothesis was tested using a mixed model where treatment group (coded -.5 and .5, as suggested by Kraemer, Kiernan, Essex, & Kupfer, 2008), grand-mean-centered Speed of Speech Processing (SSPi) at Time 1, and the product term of SSPi x Treatment were Level 2 predictors. Between-treatment-group differences in the growth rate of the IPSyn did not vary as a function of pre-treatment speed of speech processing, t(44) = 1.33, p = .19 for the pre-treatment speed of speech processing x treatment group interaction predicting productive grammar growth.
H4: There will be a negative relation between post-test speed of speech processing and later impairment in comprehension of grammar
Post-treatment TEA-based speed of speech processing was negatively correlated with TACL-3 elaborated phrase standard scores at the 5-month follow-up period, r= −0.34, p= 0.018) (Figure 4a).
Figure 4.

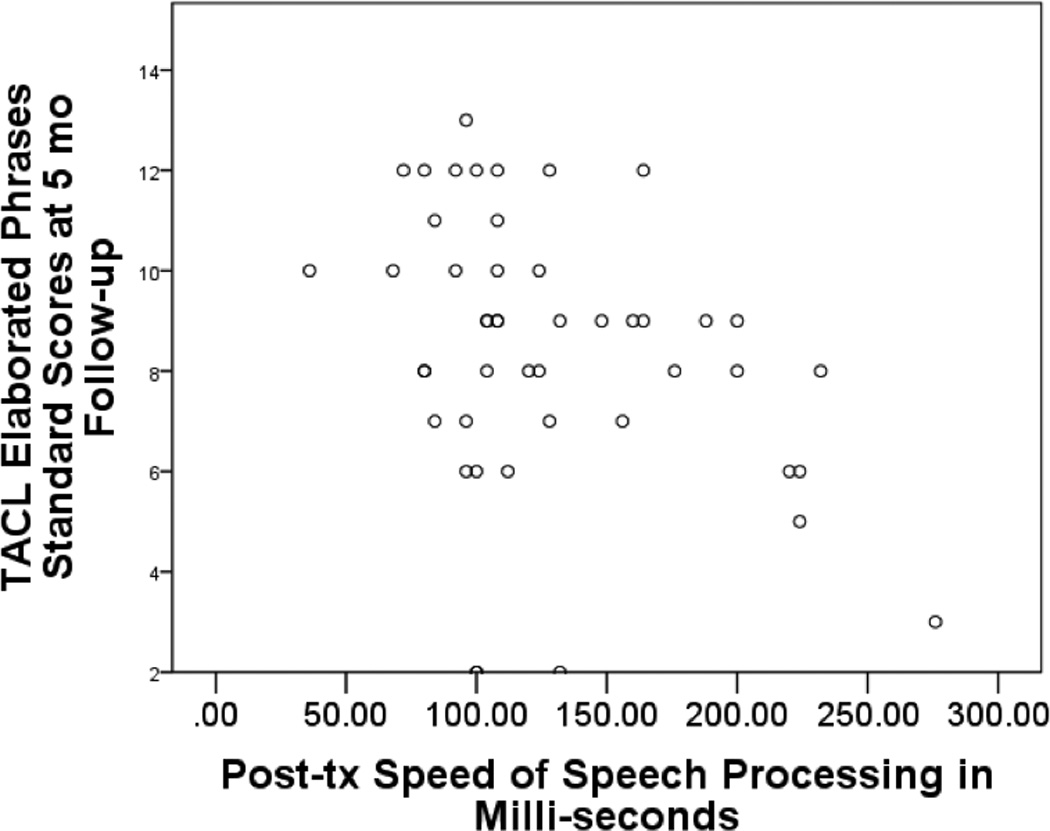
(a) Predictive value of post-treatment TEA-derived speed of speech processing and subsequent impairment in comprehension of phrase elaboration in SLI group, (b) Grammatical growth as a function of proportional change in speed of speech processing in SLI group during the treatment phase.
H5: Change in the speed of speech processing will be positively associated with the rate of gain in grammar during the treatment phase
This was tested by a mixed model in which proportional change in speed of speech processing was the Level 2 predictor of growth in the IPSYN. Proportional change in speed of speech processing was positively related to the slope of growth in the total IPSyn score, HLM fixed coefficient = .75(.37), t(45) = 2.02, p = .05 (see Figure 4b).
Discussion
Summary of Findings
The average latency of nearly typical brain activity associated with syllable processing was derived as an index of speed of speech processing in samples of TD and SLI preschoolers. TD preschoolers processed speech faster than SLI preschoolers prior to treatment, but not after treatment. Within the SLI group, children became faster in processing speech after treatment than before treatment. Also within the SLI sample, post-treatment speed of speech processing was negatively correlated with later degree of impairment in comprehension of phrase elaboration (i.e., faster processors had less impaired comprehension). Finally, the change in speed of speech processing was positively associated with growth rate of grammar during the treatment phase in the SLI sample. Pre-treatment speed of speech processing did not predict which grammatical treatment was superior in the SLI sample
Speculative Explanation for the Null Finding
It is not possible to offer a definitive explanation for why initial speech processing speed did not predict differential efficacy of the two methods of grammatical treatment in the SLI sample. However, it is possible that there were insufficient differences between the grammatical treatments to detect such a moderated treatment effect. Indeed, both treatments rely in part on grammatical recasts. Because grammatical recasts are temporally proximal to and have semantic overlap with immediately preceding child platform utterances it is thought that children are more likely to process grammatical information in recasts than in other child-directed speech. This may occur even in children with relatively slow speech processing. Alternatively or additionally, improvement in the speed of speech processing may have occurred sufficiently early in the treatment phase to enable the slow processors to benefit from recasts. Future research is needed to identify when during the grammatical treatment phase acceleration of speech processing occurs.
Strengths
This study had several strengths. The measure of grammar was ecologically-valid and constituted a test of far-transfer of grammatical structures learned. Both grammatical treatments were carried out with a high degree of fidelity. There were two measures of maintenance of effects on grammar. The sample sizes were large for ERP studies (Yoder, Blackford, Waller, & Kim, 2004). Only one measure of speed of processing was used to address the research questions. Although we recognize the value of multiple measures of constructs, limiting ourselves to a single ERP variable to test our research question is a highly falsifiable approach. The positivist tradition suggests that confirmatory results produced in the context of a highly falsifiable research approach tend to replicate more often than results produced in exploratory research approaches. Many ERP studies use an exploratory approach to identify which ERP variable best differentiates groups or best predicts the outcome without adjusting alpha (Yoder, Blackford, Waller, & Kim, 2004). The TEA approach uses the data from all electrodes and eliminates the need to pre-specify or use of study samples’ grand average waves to identify electrodes of interest. Our application of TEA also identified a temporal range of interest that corresponded to the post-stimulus epoch at which typically developing young children distinguish auditory stimuli, which replaced the need to examine the grand average wave of the clinical sample to identify a temporal region of interest. Using a TD sample to identify template maps and temporal ranges of interest to select the variable used in the SLI sample to quantify speed of processing greatly reduced the number of significance tests used to test the research questions and improved the probable replicability of findings. Importantly, the findings were consistent with current theory and most of our predictions, and thus provide support for the construct validity of the ERP measure as one that indexes speed of auditory processing (Cronbach & Meehl, 1955).
Limitations
As normative studies go, the size of the TD sample in the current study is limited, and the TD group was not sampled in a way that maximizes the probability that it was representative of the population (e.g. it was a sample of convenience). Future ERP work using larger and more representative samples of TD children is needed to provide normative ERP information.
The ages at which post-treatment speed of speech processing in the SLI sample and that in the TD sample were different. Although age was not a correlate of speed of speech processing in the current study, it is possible that habituation in the SLI sample could have affected TEA-measured speed of speech processing. While this possibility cannot be ruled out, it is an unlikely confound because there was a 6-month interval between ERP testings in the SLI sample.
Finally, there were no behavioral measures of speed of speech processing in this young group. Therefore, we relied on the nomological network approach to construct validation for the speed of speech processing approach.
Importance and implications of findings
The current findings indicate that passive, TD-referenced ERP data can be used to measure individual differences in speed of speech processing in a clinical sample. The TEA allow investigators to focus on timing, the strength of ERPs, without having to pre-specify or use the study sample to identify the scalp region at which relevant brain activity is detected. That is, global measures of the electric field at the scalp are quantified. Additionally, there is no reliance on a single time sample at which a peak’s amplitude is at its maximum, but rather a relatively homogeneous epoch of neural activity (i.e., a micro-state) is used to identify neural patterns associated with stimulus differentiation. Finally, the normative approach may hold more promise than a compensatory approach to using ERPs for clinical decision-making.
In a compensatory approach template maps are identified in the clinical sample’s grand average wave and then used to quantify timing of speech processing within that sample. Because template maps are identified through a purely empirical method and because there may be many possible compensatory generators the brain can use to process speech, identifying atypical template maps within a clinical sample more probably results in study-sample-specific template maps than does a normative approach. The typical human brain has evolved to solve the problem of processing speech using similar generators across typical individuals.
It is not difficult to imagine a future in which individual children’s brain responses are assessed and compared to normative data to identify the extent to which their initial speech processing is slow relative to age-expectations, which can then be used to inform clinical decisions. For example, clinicians are often trained to change a therapy method when a child is not showing behavioral changes. Unfortunately, our behavioral measures may be insensitive to changes in speech processing, which are related to changes in grammar. By using normative-TEA analysis, we may eventually be able to (a) identify initially slow speech processors, (b) retain them in a particular treatment if their speech processing is becoming faster, even if their grammatical performance has not begun to change, and (c) graduate them from therapy once their speed of speech processing is within normal limits (see also Tzovara et al., in press for analytical developments at the single-subject level).
Acknowledgments
The research was funded by NIDCD R01DC005994 and received support from the Vanderbilt Kennedy Center for Research on Human Development (P30HD15052). Dr. Murray receives support from the Swiss National Science Foundation (Grant# 310030B-133136).
The study was conducted by Paul Yoder, Special Education Department, Vanderbilt University; Dennis Molfese, Department of Molecular, Cellular & Craniofacial Biology, University of Louisville; Micah Murray, Neuropsychology and Neurorehabilitation Service, Vaudois University Hospital Center and University of Lausanne, Switzerland and Electroencephalography Brain Mapping Core, Center for Biomedical Imaging, Lausanne, Switzerland; and Alexandra P. F. Key, Department of Hearing and Speech Sciences, Vanderbilt University.
Contributor Information
Paul J. Yoder, Vanderbilt University
Dennis Molfese, University of Louisville.
Micah M. Murray, Vaudois University Hospital Center and University of Lausanne
Alexandra P. F. Key, Vanderbilt University
References
- Benasich A, Leevers H. Processing of rapidly presented auditory cues in infancy: Implications for later language development. In: Hayne H, Fagan J, editors. Progress in Infancy Research. Vol. 3. Mahwah, NJ: Lawrence Erlbaum Assoc; 2003. pp. 245–288. [Google Scholar]
- Bishop D, Bishop S, Bright P, James C, Delaney T, Tallal P. Different origin of auditory and phonological processing problems in children with language impairment: Evidence from a twin study. Journal of Speech, Language, and Hearing Research. 1999b;42:155–168. doi: 10.1044/jslhr.4201.155. [DOI] [PubMed] [Google Scholar]
- Bishop DV, Carlyon RP, Deeks JM, Bishop SJ. Auditory temporal processing impairment: Neither necessary nor sufficient for causing language impairment in children. Journal of Speech, Language, and Hearing Research. 1999a;42:1295–1310. doi: 10.1044/jslhr.4206.1295. [DOI] [PubMed] [Google Scholar]
- Brunet D, Murray M, Michel C. Spatiotemporal analysis of multichannel EEG: CARTOOL. Computational Intelligence and Neuroscience. 2011 doi: 10.1155/2011/813870. Advance online publication. [DOI] [PMC free article] [PubMed] [Google Scholar]
- Carrow-Woolfolk E. Test of Auditory Comprehension of Language. 3rd edition. Austin, TX: Pro-Ed; 1999. [Google Scholar]
- Ceponiene R, Lepisto T, Alku P, Aro H, Naatanen R. Event-related potential indeices of auditory vowel processing in 3-year old children. Clinical Neurophysiology. 2003;114:651–661. doi: 10.1016/s1388-2457(02)00436-4. [DOI] [PubMed] [Google Scholar]
- Cronbach LJ, Meehl PE. Construct validity in psychological tests. Psychological Bulletin. 1955;52:281–302. doi: 10.1037/h0040957. [DOI] [PubMed] [Google Scholar]
- Delattre PC, Liberman AM, Cooper FS. Acoustic Loci and Transitional Cues for Consonants. Journal of Acouistic Society of America. 1955;27:769–773. [Google Scholar]
- De Lucia M, Clarke S, Murray M. A temporal heirarchy for conspecific voalization discrimination in humans. Journal of Neuroscience. 2010;30:11210–11221. doi: 10.1523/JNEUROSCI.2239-10.2010. [DOI] [PMC free article] [PubMed] [Google Scholar]
- De Santis L, Clarke S, Murray M. Automatic and intrinsic auditory ‘what’ and ‘where’ processing in humans revealed by electrical neuroimaging. Cerebral Cortex. 2007;17:9–17. doi: 10.1093/cercor/bhj119. [DOI] [PubMed] [Google Scholar]
- Ellis-Weismer S, Evans JL. The role of processing limitations in early identification of specific language impairment. Topics in Language Disorders. 2002;22:15–29. [Google Scholar]
- Guthrie D, Buchwald J. Significance testing of difference potentials. Psychophysiology. 1991;28(2):240–244. doi: 10.1111/j.1469-8986.1991.tb00417.x. [DOI] [PubMed] [Google Scholar]
- Koenig T, Melie-García L. A method to determine the presence of averaged event-related fields using randomization tests. Brain topography. 2010;23(3):233–242. doi: 10.1007/s10548-010-0142-1. [DOI] [PubMed] [Google Scholar]
- Kraemer H, Kiernan M, Essex M, Kupfer D. How and why criteria defining moderators and mediators differ between the Baron and Kenny and MacArthur approaches. Health Psychology. 2008;27:101–108. doi: 10.1037/0278-6133.27.2(Suppl.).S101. [DOI] [PMC free article] [PubMed] [Google Scholar]
- Kriegeskorte N, Simmons W, Bellgowan P, Baker C. Circular analysis in systems neuroscience: the dangers of double dipping. Nature Neuroscience. 2009 doi: 10.1038/nn.2303. [DOI] [PMC free article] [PubMed] [Google Scholar]
- Law J, Garrett Z, Nye C. The efficacy of treatment for children with developmental speech and language delay/disorder: A meta-analysis. Journal of Speech, Language, Hearing Research. 2004;47:924–943. doi: 10.1044/1092-4388(2004/069). [DOI] [PubMed] [Google Scholar]
- Lehmann D. Principles of spatial analysis. In: Gevins AS, Remond A, editors. Handbook of electroencephalography and clinical neurophysiology, vol. 1: Methods of analysis of brain electrical and magnetic signals. Amsterdam: Elsevier; 1987. pp. 309–354. [Google Scholar]
- Lehmann D, Skrandies W. Reference-free identification of components of checkerboard-evoked multichannel potential fields. Electroencephalography and Clinical Neurophysiology. 1980;vol. 48(no. 6):609–621. doi: 10.1016/0013-4694(80)90419-8. [DOI] [PubMed] [Google Scholar]
- Leonard L. Children with specific language impairment. Cambridge, MA: MIT Press; 1998. [Google Scholar]
- Long S, Fey M, Channell R. Computerized Profiling(CP) Version 9.2.7 (MS-DOS). [Computer software] Cleveland, OH.: Department of Communication Sciences, Case Western Reserve University; 2000. [Google Scholar]
- Maxwell SE. Longitudinal designs in randomized group comparisons: When will intermediate observations increase statistical power? Psychological Methods. 1998;3(3):275–290. [Google Scholar]
- McArthur GM, Bishop DV. Auditory perceptual processing in people with reading and oral language impairments: Current issues and recommendations. Dyslexia. 2001;7:150–170. doi: 10.1002/dys.200. [DOI] [PubMed] [Google Scholar]
- Mikkola K, Kushnerenko E, Partanen S, Serenius-Sirve S, Leipala J, Huotilainen V, et al. Auditory event-related potentials and cognitive functioning of preterm children at five years of age. Clinical Neurophysiology. 2007;118:1494–1502. doi: 10.1016/j.clinph.2007.04.012. [DOI] [PubMed] [Google Scholar]
- Miller JF, Chapman RS. The relation between age and mean length of utterance in morphemes. Journal of Speech and Hearing Research. 1981;24(2):154–161. doi: 10.1044/jshr.2402.154. [DOI] [PubMed] [Google Scholar]
- Miller J, Chapman R. SALT: Systematic analysis of language transcripts: Basic SALT programs. Language Analysis Laboratory: University of Wisconsin; 1993. [Google Scholar]
- Mills DL, Coffey-Corina S, Neville HJ. Language comprehension and cerebral specialization from 13 to 20 months. Developmental Neuropsychology. 1997;13(3):397–445. [Google Scholar]
- Molfese DL. Neuroelectrical correlates of categorical speech perception in adults. Brain and Language. 1978;5:25–35. doi: 10.1016/0093-934x(78)90004-4. [DOI] [PubMed] [Google Scholar]
- Molfese D, Fonaryova Key A, Maguire M, Dove G, Molfese V. Event-related evoked potentials (ERPs) in speech perception. In: Pisoni D, Remez R, editors. The handbook of speech perception. Williston, VT: Blackwell; 2005. pp. 99–121. [Google Scholar]
- Murray M, Brunet D, Michel C. Topographic ERP analyses: A step-by-step tutorial review. Brain Topography. 2008;20:249–264. doi: 10.1007/s10548-008-0054-5. [DOI] [PubMed] [Google Scholar]
- Murray M, Camen C, Andino S, Bovet P, Clarke S. Rapid brain discrimination of sounds of objects. Journal of Neuroscience. 2006;26:1293–1302. doi: 10.1523/JNEUROSCI.4511-05.2006. [DOI] [PMC free article] [PubMed] [Google Scholar]
- Murray M, De Lucia M, Brunet D, Michel C. Principles of topographic analysis for electrical neuroimaging. In: Handy T, editor. Brain signal analysis: Advances in Neuroelectric and neuromagnetic methods. MIT Press; 2009. [Google Scholar]
- Perrin F, Pernier J, Bertrand D, Echallier JF. Spherical splines for scalp potential and current density mapping. Electroencephalography and Clinical Neurophysiology. 1989;72:184–0187. doi: 10.1016/0013-4694(89)90180-6. [DOI] [PubMed] [Google Scholar]
- Ponton C, Eggermont JJ, Khosla D, Kwong B, Don M. Maturation of human central auditory system activity: separating auditory evoked potentials by dipole source modeling. Clinical Neurophysiology. 2002;113(3):407–420. doi: 10.1016/s1388-2457(01)00733-7. [DOI] [PubMed] [Google Scholar]
- Roid G, Miller L. Leiter International Performance Scale - Revised. Wood Dale, IL: Stoelting, Co.; 1997. [Google Scholar]
- Rosen S. Auditory processing in dyslexia and specific language impairment: Is there a deficit? What is its nature? Does it explain anything? Journal of Phonetics. 2003;31:509–527. [Google Scholar]
- Rushton JP, Brainerd CJ, Pressley M. Behavioral development and construct validity: The principle of aggregation. Psychological Bulletin. 1983;94:18–38. [Google Scholar]
- Scarborough H. Index of productive syntax. Applied Psycholinguistics. 1990;11:1–22. [Google Scholar]
- Schopler E, Reichler R, Renner B. Childhood Autism Rating Scale. Los Angeles: Western Psychological Services; 1999. [Google Scholar]
- Shafer V, Ponton C, Datta H, Morr M, Schwartz R. Neurophysiological indices of attention to speech in children with specific language impairment. Clinical Neurophysiology. 2007;118:1230–1243. doi: 10.1016/j.clinph.2007.02.023. [DOI] [PMC free article] [PubMed] [Google Scholar]
- Story B, Bunton K. Relation of vocal tract shape, formant transitions, and stop consonant identification. Journal of Speech, Language, Hearing Research. 2010;53:1514–1528. doi: 10.1044/1092-4388(2010/09-0127). [DOI] [PMC free article] [PubMed] [Google Scholar]
- Tallal P, Miller SL, Jenkins WM, Merzenich MM. The role of temporal processing in developmental language-based learning disorders: Research and clinical implications. In: Blachman B, editor. Foundations of reading acquisition and dyslexia: Implications for early intervention. Mahwah, NJ: Erlbaum; 1997. pp. 49–66. [Google Scholar]
- Tapp J. ProcoderDV computer software] Nashville, TN: Vanderbilt Kennedy Center; 2003. [Google Scholar]
- Tyron W, Lewis C. An inferential confidence interval method of establishing statistical equivalence that corrects Tyron's reduction factor. Psychological Methods. 2008;13:272–277. doi: 10.1037/a0013158. [DOI] [PubMed] [Google Scholar]
- Tzovara A, Murray MM, Michel CM, De Lucia M. A tutorial review of electrical neuroimaging from group-average to single-trial event-related potentials. Developmental Neuropsychology. doi: 10.1080/87565641.2011.636851. in press. [DOI] [PubMed] [Google Scholar]
- Vygotsky LS. Mind and society: The development of higher psychological processes. Cambridge, MA: Harvard University Press; 1978. [Google Scholar]
- Weber-Fox C, Leonard L, Wray A, Tomblin JB. Electrophysiological correlates of rapid auditory and linguistic processing in adolescents with specific language impairment. Brain & Language. 2010;115:162–181. doi: 10.1016/j.bandl.2010.09.001. [DOI] [PMC free article] [PubMed] [Google Scholar]
- Wunderlich JL, Cone-Wesson BK. Maturation of CAEP in infants and children: A review. Hearing Research. 2006;212:212–223. doi: 10.1016/j.heares.2005.11.008. [DOI] [PubMed] [Google Scholar]
- Yoder PJ, Blackford J, Waller N, Kim G. Enhancing power while controlling family-wise error in electrocortical studies. Journal of Clinical and Experimental Neuropsychology. 2004;26:320–331. doi: 10.1080/13803390490510040. [DOI] [PubMed] [Google Scholar]
- Yoder PJ, Compton D. Identifying predictors of treatment response. Mental Retardation and Developmental Disabilities Research Reviews. 2004;10:162–168. doi: 10.1002/mrdd.20013. [DOI] [PubMed] [Google Scholar]
- Yoder PJ, McDuffie A. Treatment of primary language disorders in early childhood: Evidence of efficacy. In: Accardo P, editor. Disorders of language development. York Press: Baltimore; 2002. pp. 151–177. [Google Scholar]
- Yoder PJ, Molfese M, Gardner E. Initial ERP predict relative efficacy of two grammatical treatments in preschoolers with specific language impairment. Journal of Speech, Language, Hearing Research. 2010 doi: 10.1044/1092-4388(2010/09-0246). in press. [DOI] [PMC free article] [PubMed] [Google Scholar]
- Zimmerman I, Steiner B, Pond R. Preschool Language Scale-3rd Edition. San Antonio: Psychological Corporation; 1992. [Google Scholar]