

Abstract
Experimentally induced axonal regeneration is compromised by glial scar formation arising from leptomeningeal fibroblasts cells in and around the hydrogel scaffold implanted for nerve repair. Strategies are needed to prevent such fibroblastic reactive cell layer formation for enhanced axonal regeneration. Here, we implement the technique of layer-by-layer assembled degradable, hydrogen bonded multilayers on agarose hydrogels to incorporate an anti-mitotic drug (1-β-D-arabinofuranosylcytosine (Ara-C)) within the agarose hydrogels. We show controlled release of Ara-C under physiological conditions over a period of days. The concentrations of Ara-C released from agarose at the different time points were sufficient to inhibit fibroblast growth in vitro, while not adversely affecting the viability of the neuronal cells.
Keywords: Time controlled release, agarose, Ara-C, layer-by-layer assembly, reactive cell layer, nerve repair
1. Introduction
Patterned or templated scaffolds with arrays of uniaxial, uniform diameter channels similar to normal spinal cord have been shown to support linear axonal growth into spinal cord lesion sites in the central nervous system (CNS) [1]. Agarose hydrogels can be designed to match the mechanical properties of the spinal cord, is biocompatible and bioinert, and more importantly, is stable for extended period required for regenerating organized axons and, thus, is a good choice for nerve regeneration [1]. Templated agarose scaffolds for nerve guidance have been shown to exhibit excellent integration with host tissue [1]; however, a reactive cell layer (RCL) of adherent leptomeningeal fibroblasts forms at the interface of the distal end of the scaffold and the host matrix at the site of injury (Ref. [2] and M. H. Tuszynski, pers. commun.). The RCL forms several days after scaffold implantation, and limits the ability of the regenerated host axons to exit the distal end of the scaffold and reinnervate beyond the lesion site [2]. In a recent study by Gros et al., reduction of RCL formation between scaffold and host parenchyma has been put as a next immediate challenge to facilitate the axonal regeneration into host spinal cord beyond the lesion [2]. Furthermore, leptomeningeal fibroblasts also form a RCL within the channels of the templated scaffolds. Fibroblasts adhere to the inner wall of the channels and reduce the channel space available for the regenerating axons (M. H. Tuszynski, pers. commun.).
Previously, we proposed that the RCL formation could be attenuated, in part, by modulating the substrate cell adhesive property, to render the surface resistant to RCL formation [3]. Creating a cytophobic surface has been achieved, whereby degradable [3] or non-degradable thin multilayers [4] were used to create a cytophobic surface for extended periods lasting over weeks. Another approach to avoid the RCL formation could be to formulate a delivery system that slowly releases, in a controlled manner, a potent drug to inhibit fibroblast cell division with minimal impact on the regenerating axons.
1-β-D-Arabinofuranosylcytosine (Ara-C) is a chemotherapeutic agent used clinically for the treatment of acute leukemia [5]. Ara-C is an anti-mitotic agent often used at low concentrations (10 μM or less) to induce cell death of rapidly proliferating non-neuronal cells, such as astrocytes, in culture [6–9]. Ara-C, once transported into the cell by a membrane transporter [10–12], inhibits DNA synthesis [13], as well as DNA repair [14]. In addition to dividing cells, the neurotoxic effect of 16 μM Ara-C can cause apoptosis of postmitotic neurons [15–17]. Suggested mechanisms by which Ara-C causes neurotoxicity is through the generation of reactive oxygen species that lead to oxidative DNA strand breakage [18], as well as blocking DNA repair [18]. High doses of Ara-C administered in chemotherapy are cytotoxic and can cause severe secondary side-effects, including disorders of the CNS and peripheral nervous systems (PNS) [19–21]. A slow release formulation providing prolonged exposure of Ara-C to cerebrospinal fluid as compared to a standard injection delivery has been shown to provide better response and quality of life in patients being treated for leptomeningeal meningitis [22]. Indeed, several methods have been developed over the past decade to provide controlled release of Ara-C from polymeric matrices [20, 23–25]; however, none are compatible with the templated agarose scaffold fabrication process shown to be advantageous for nerve regeneration [1].
Controlled delivery of a low level (preferably less than 10 μM) of Ara-C at the site of injury provides a potential solution to control RCL formation. In this study, our objective was to provide controlled delivery of Ara-C from agarose hydrogels, since the implanted scaffolds exhibit extensive RCL formation at the site of injury during axonal regeneration. However, the current methods of incorporating drugs into hydrogel structures during the fabrication process [20, 24–30] are not compatible with the templated agarose scaffold fabrication process [1]. The latter exposes drugs to harsh organic solvents, such as tetrahydrofuran, that are used to selectively etch patterning constituents during the templated scaffold fabrication process [1], and is detrimental to the stability of the drug. Agarose is a weakly ionic hydrogel [31, 32] and has a broad range of pore diameters, from less than 1 nm up to greater than 500 nm [31–36]. Due to the relatively large average pore size of the agarose as compared to the size of the drug and the absence of strong interactions between the drug and agarose, preventing entrapment of the drug through entanglements or physical interactions, controlled release of the drug is not readily achieved. This is in contrast to other hydrogels that can maintain sustained release through entanglements or physical interactions with the drugs [27, 37–41].
Layer-by-layer (LbL) assembled multilayers, introduced by Decher [42], offer promise in the field of controlled drug delivery, due to their tunable film properties, flexibility in choice of assembly components and ease of processing [43, 44]. LbL multilayers can be tuned to incorporate varying amounts of drugs or proteins as well as provide sustained release under specified conditions of pH, salt or temperature [43–45]. The LbL methodology using non-degradable multilayers to provide controlled drug or protein release from synthetic hydrogels, previously loaded the drug during the hydrogel fabrication process [46, 47], which is not amenable with the fabrication process used for the templated agarose scaffolds. On the other hand, sustained release of drugs or proteins incorporated within degradable, hydrogen bonded (H-bonded) films has been recently demonstrated [3, 48]. Degradable multilayer assemblies, based on sequential embedding of drugs during the fabrication, can incorporate drugs, independent of their molecular weight [48–52]. Fabrication of degradable, H-bonded LbL multilayer films was initially reported by Stockton and Rubner [53] and Wang et al. [54]. Sukhishvili and Granick demonstrated the pH controlled assembly and degradation of poly(carboxylic acid)-based H-bonded LbL films [55, 56], which was followed by numerous studies involving these multilayers for various applications, e.g., to generate self-standing floating films, solid polymer electrolyte films, or for patterned delivery of nucleic acids to cells [57–59]. Carboxylic acid (–COOH)-based weak polyelectrolytes form H-bond interactions at low pH (pH < 3.5 in the case of poly(acrylic acid) (PAA)) and deprotonate to carboxylate ions (–COO−) at high pH, which degrades the H-bonded multilayer assembly [56]. Here, we employed degradable, H-bonded LbL multilayer assembly of PAA, PEG and Ara-C over agarose, subsequent to the fabrication of the agarose, and demonstrate controlled release of Ara-C from agarose at physiological pH at concentrations amenable to inhibiting fibroblast growth without affecting the neuron viability.
2. Materials and Methods
2.1. Materials
Poly(acrylic acid, sodium salt) solution (PAA, MW 15 kg/mol) and poly(ethylene glycol) (PEG, MW 10 kg/mol) were purchased from Sigma-Aldrich. 1-β-D-Arabinofuranosylcytosine (Ara-C, Cat. No. 251010) was purchased from Calbiochem. Ultrapure agarose (Sigma-Aldrich) was dissolved at a required concentration in 18.2 MΩ · cm deionized (DI) water (MilliQ, Millipore) at near 100°C. For all the experiments, unless otherwise specified, 2 ml of hot agarose solution was poured into 6-well tissue culture polystyrene (TCPS) plates (Costar, Corning). For UV-Vis absorbance experiments, the hot agarose solution was filled into a 96-well polystyrene plate (Evergreen Scientific). Agarose was allowed to gel at room temperature for about 10–15 min before further use.
2.2. LbL Formation over Agarose
PAA, PEG and Ara-C solutions used to fabricate the multilayer assemblies were prepared individually in DI water to a final concentration of 1 mg/ml and the pH of each solution was adjusted to 2.0, unless otherwise specified. In other words, PAA, PEG and Ara-C were contained in three separate solutions. DI water adjusted to pH 2.0 was used as the wash solution during the assembly. Multilayer assembly of [(PAA/PEG)5(Ara-C/PEG)5]3PAA, as described in Results and Discussion, was formed over agarose gel (agarose discs) prepared in 6-well plates. During the LbL assembly to form the multilayers, the substrates were dipped in PAA, PEG or Ara-C solutions in a sequential manner (depending on assembly step, as described in Results and Discussion) for 30 min followed by 10 min in a wash solution with agitation to create a multilayer. In the multilayer formation, as each of the components (PAA, PEG or Ara-C) were adsorbed onto the previous layer according to Fig. 1b, the component interacts with the previous layer through hydrogen bonding, i.e., PAA adsorbs onto PEG and vice versa through H-bonding; and Ara-C adsorbs onto PEG and vice versa also through H-bonding. A Carl Zeiss slide stainer was used to form the multilayers. PAA was kept as the terminating layer in each case. Films, when abbreviated as (PAA/PEG)n.5, denote the PAA/PEG multilayer where n is the number of PAA and PEG bilayers and the ‘.5’ indicates an additional, single terminating layer of PAA. After multilayer formation onto the agarose discs in 6-well plates, the LbL-coated agarose plate was left in DI water at pH 2.0 overnight and then analyzed further. This evaluated the ability of LbL-coated agarose to provide controlled release after storage in pH 2.0 DI water.
Figure 1.

(a) Chemical structure of 1-β-D-arabinofuranosylcytosine (Ara-C). (b) Multilayer assembly of PAA, PEG and Ara-C over agarose. The curved line represents the agarose. This figure is published in colour in the online edition of this journal, which can be accessed via http://www.brill.nl/jbs
At the start of the experiment, the agarose discs were transferred to a new 6-well plate to avoid the effect of Ara-C (if any) that may be released from the sides of the 6-well plate during cell culturing or release measurement experiments. Ara-C soaked (impregnated) agarose signifies that the agarose filled 6-well plate is immersed in a solution of Ara-C (1 mg/ml, pH 2.0) in 1 × PBS for approx. 24 h, washed with 1 × PBS (pH 2.0) for 20 min with agitation, and left in 1 × PBS (pH 2.0) overnight (similar to LbL-coated agarose plate which was also left overnight in DI water at pH 2.0). Also, instead of soaking agarose in Ara-C for 24 h at one stretch, we also mimicked the whole LbL process for impregnating (soaking) Ara-C in agarose (controls). We used pH 2.0 DI water without any PAA or PEG polymer added to it (i.e., only pH 2.0 water in lieu of the PAA and PEG solutions) and performed the LbL sequencing process with Ara-C. We obtained the same results as with the agarose impregnated or directly soaked in Ara-C solution for 24 h (data not shown).
To determine the incorporation of Ara-C during the multilayer build-up process, UV-Vis peaks of the 96-well plate were measured at 23°C in the range of 200–400 nm and a spectral resolution of 1 nm with a SPECTRAmax Plus 384 (Molecular Devices). The absorbance/scattering spectrum of bare agarose (non-coated agarose) was subtracted from each LbL-coated agarose spectrum. The concentrations of Ara-C loaded within the multilayers formed on the hydrogel were calculated at 272 nm based on the Beer–Lambert law, assuming the agarose hydrogel is a solution, and a standard curve of pure Ara-C dissolved in 1 × PBS. Further, we assumed that these calculated concentrations reflect the amount of free Ara-C encapsulated in the hydrogel rather than the total conjugated and non-conjugated Ara-C (see discussion in Section 2.4), since the calculations were performed calculations using the UV peak for pure Ara-C at 272 nm.
2.3. Cell Culture and Imaging
NIH-3T3 fibroblasts were purchased from American Type Culture Collection. All cell cultures were maintained in DMEM (catalog 11995, Invitrogen) with 10% FBS and 100 U/ml penicillin plus 100 μg/ml streptomycin (P/S) at 37°C and 10% CO2. In the Ara-C–fibroblasts studies, the fibroblasts were seeded at a density of approx. 2 × 10⁴ cells/ml onto glass cover-slip and placed into a 6-well plate (with cells facing up) with 2 ml media (described in Section 2.3.1).
2.3.1. Fibroblast Culture and Ara-C Release from Agarose Hydrogels
To study the effect of Ara-C released from LbL-coated agarose in 6-well plates, fibroblasts were cultured onto glass cover-slips (Corning) placed in a 6-well plate. The LbL-coated agarose 6-well plates were incubated in cell culture medium at 37°C, without cells initially, and the medium was replaced with fresh culture medium at 30 min, 16 and 24 h. This was performed to flush out the low pH water from the hydrogel, to minimize the effect of low pH on cell growth. After 24 h, the cells on the cover-slips were placed faced up onto the agarose discs in the 6-well plates. The cell culture medium was replaced every 24 h and the cells were monitored for 3 days, starting from when the cover-slips were placed onto the agarose filled 6-well plates.
Subsequently, a new batch of fibroblasts cultured on cover-slips (prepared as described above) was placed faced up onto these same agarose discs and the cells were monitored for another 3 days, with the culture medium replaced every 24 h. Phase contrast images were collected with a Leica DM IL inverted microscope equipped with a SPOT RT color camera (Diagnostics Instruments) using a 10× dry objective.
2.3.2. Primary Neuronal Isolation and Culture
Primary cortical neurons were isolated from 1-day-old Sprague–Dawley rat pups and cultured according to the published methods as described by Chandler et al. [60]. The cells were plated on poly(L-lysine)-coated 6-well plates at the concentration of 2 × 10⁶ cells/well in fresh cortical medium (DMEM, Invitrogen) supplemented with 10% horse serum, 25 mM glucose, 10 mM HEPES (all Sigma-Aldrich), 2 mM glutamine (Biosource International) and P/S at 37°C and 5% CO2. Cells were incubated for 2 days prior to performing the experiments, and the time point after 2 days of incubation is referred to as Day 0 when the experiments on neuronal cells were started in this study. At Day 0, 5 μM Ara-C was added to the culture medium in one set of samples, and in another set of samples the medium was replaced with supernatant in which Ara-C was released from LbL-multilayer-coated agarose as described below.
As explained in Section 2.1, 2 ml agarose was allowed to gel in each well of a 6-well plate and then coated with LbL multilayer. For the Ara-C release experiments, the LbL-coated agarose discs in the 6-well plates were incubated in 2 ml primary cortical neuronal medium (pH 7.4) at 37°C. The medium was replaced with 2 ml of fresh medium after each sampling interval (30 min, 16 and 24 h after the start of the release experiments, and every subsequent 24 h), and the collected medium was stored (sterile) at −20°C until further analysis. The media collected at 48, 72 and 96 h was added to primary cortical neurons at the time points of Day 0, Day 1 and Day 2, where the time point Day 0 for the neurons is described as above. Phase contrast images of the cells were collected at Day 0, Day 1, Day 2 and Day 3. In another set of experiments, the primary neurons were exposed to Ara-C for an extended period by adding the media collected at 120 and 144 h to the cells at Days 3 and 4, subsequent to Day 2 mentioned above. Phase contrast images were collected at Days 4 and 5 (see Appendix A).
2.4. Ara-C Release Measurements
For the Ara-C release experiments, the LbL-coated agarose and Ara-C soaked (impregnated) agarose (i.e., without LbL multilayers of PAA or PEG) in the 6-well plates were incubated in 2 ml 1 × PBS (pH 7.4) at 37°C. The buffer was replaced with 2 ml fresh PBS after each sampling interval, and the collected buffer was stored at −20°C until further analysis. The buffer was replaced with fresh PBS at the following intervals: 30 min, 16 and 24 h after the start of the release experiments (similar to the cell culture experiment described above in Section 2.3.1), and every subsequent 24 h.
Ara-C exhibits a UV peak at 272 nm due to the presence of its aromatic ring structure, while PAA and PEG do not exhibit such a UV-Vis peak (Appendix , Fig. A1). The concentrations of Ara-C released from Ara-C soaked (impregnated) agarose (i.e., without LbL multilayers of PAA or PEG) were determined using an UV-Vis spectrophotometer at 272 nm. However, since the Ara-C released could be conjugated with the PAA or PEG released from the LbL, the concentrations of free Ara-C in the LbL released samples were determined using reverse-phase high-pressure liquid chromatography (HPLC) with a UV-Vis detector [61]. This evaluation method was necessary for LbL released Ara-C since the PAA or PEG conjugated AraC would have different (and unknown a priori) extinction coefficients from its unconjugated form. This thereby prevented a direct UV-Vis spectrophotometer evaluation [61]. HPLC analysis of Ara-C was performed using a Waters 2695 Separations Module, Waters 2966 Photodiode Array Detector, 250 × 4.60 mm reverse-phase stainless steel column packed with 4 μm particles (Phenomenex, Synergi 4u Hydro-RP 80Å). A gradient of water (A) and HPLC grade acetonitrile (B), both containing 0.05% (v/v) trifluoroacetic acid (TFA, CF3COOH), was used (0–10 min, 5% B; 15 min, 50% B; 20 min, 60% B). Samples (10 μl injection volume from 25 μl in stock vial) were eluted at room temperature with a mobile phase consisting of 0.05% TFA in acetonitrile, at a flow rate of 1 ml/min. The pressure limits were set to 0–4000 psi. The free Ara-C was eluted at tR approx. 9 min at 272 nm in RP-HPLC. The concentration of free Ara-C in the samples was calculated based on the area under the peak corresponding to the retention time of pure Ara-C obtained at 272 nm. A standard curve was obtained using pure Ara-C dissolved in 1 × PBS to determine the Ara-C concentrations released from the agarose. Cumulative concentrations reported were determined by adding the release at each sampling interval. The release in terms of percentage was calculated as the fraction of the non-cumulative release amount to all the previous non-cumulative releases, i.e., the percent cumulative release at 48 h from the LbL-coated agarose was calculated by dividing the release at 48 h by the summation of the non-cumulative amounts released at 30 min, 16, 24 and 48 h. The plateau of the cumulative graph for the Ara-C impregnated/soaked agarose was considered to be the complete (i.e., 100%) release of the Ara-C from the agarose. All data shown are mean ± SD from at least 3 independent samples.
3. Results and Discussion
Degradable, H-bonded multilayers have been demonstrated as a potential method to provide controlled release of proteins from agarose hydrogels [3]. Such multilayers resist fibroblast attachment to the substrate for over a period of 2 weeks and thereby could be used to control the formation of a fibroblast RCL [3]. If these multilayers could be further coupled with an ability to provide controlled release of an anti-mitotic drug to arrest the growth of the RCL, it would provide a versatile, multi-prong approach to addressing the challenges of repairing nerve injury.
Ara-C contains hydroxyl groups, and a primary amine and carbonyl group, which could potentially form H-bonds with the polymers during LbL assembly. Figure 1a illustrates the chemical structure of Ara-C. We incorporated Ara-C as one of the multilayer components, along with PAA and PEG, to build degradable multilayers over agarose. This is one approach to achieve controlled release of Ara-C from the agarose hydrogels, in a fashion similar to another protein release study [3]. Ara-C is a small molecule, whereas proteins are polypeptides consisting of amino acids. The difference in the physical size and molecular weight of a polymer or polypeptide versus a small molecule could have a significant impact on the multilayer formation and release profiles. Nevertheless, we hypothesized that Ara-C can be incorporated into the multilayer structure based on the primary amine and hydroxyl groups on Ara-C that could form hydrogen bonds with PEG to provide controlled release of Ara-C.
To evaluate the possibility of controlled release of Ara-C from agarose hydro-gels, we assembled multilayers of PAA, PEG and Ara-C, i.e., [(PAA/PEG)5(Ara-C/PEG)5]3PAA on agarose, as shown in Fig. 1b. Agarose is a physically cross-linked double-helix 3-D gel network of polymer chains interconnected by H-bonding and hydrophobic interactions [31, 32]. PAA with protonated carboxylic groups has hydrophobic domains at low-pH conditions [62], which can form hydrophobic interactions and H-bonds with agarose under an acidic environment. Thus, we fabricated multilayers, according to Fig. 1b, on agarose hydrogels at a low pH of 2.0. Upon increasing the pH, the protonated PAA and primary amine on Ara-C would deprotonate and break their H-bonds with PEG. Nevertheless, not all of the H-bonds will break between Ara-C and PEG, and some of the Ara-C may remain partially conjugated with PEG, thereby reducing the amount of available free Ara-C (discussed in Section 3.3.1). Agarose hydrogels do not degrade over time, and are stable for at least 1 month, a period that is sufficient for axonal regeneration to occur in vivo [1, 2, 63]. The PAA/PEG film degrades slowly over time [3] and, thus, we believe that the slow degradation rates of these films should be able to address the reactive cell layer.
3.1. Ara-C Incorporation into Agarose during LbL Multilayer Assembly
To assess the incorporation of Ara-C during the buildup of the LbL multilayers, we measured the UV-Vis absorbance spectra of agarose during the intermediate steps of the sequential LbL dipping process. Figure 2a shows the UV-Vis spectrum of agarose loaded with [(PAA/PEG)5(Ara-C/PEG)5]n multilayers. Ara-C exhibits a UV peak at 272 nm due to the presence of its aromatic ring structure, while PAA and PEG do not exhibit such a UV-Vis peak (Appendix A, Fig. A1). However, in the building of the multilayers of Ara-C with PAA and PEG onto the agarose structure, we observed that the UV-Vis peak of the Ara-C red-shifted to 298 nm. This red shift may be due to conjugation of Ara-C with the PAA or PEG (see Section 3.3.1) within the multilayers, shifting the extinction coefficients of unconjugated Ara-C to its conjugated form. The rise in the absorbance values with higher number of multilayers indicates that Ara-C is being loaded within the agarose structure as the number of deposition cycles increases. Further, the concentration of the encapsulated Ara-C within the hydrogel was calculated (as explained in Section 2.2) as a function of the total number of Ara-C layers during the multilayer formation. Figure 2b shows an exponential increase in the Ara-C concentrations within the hydrogel as the number of Ara-C layers increases. This suggests an exponential growth of [(PAA/PEG)5(Ara-C/PEG)5]n films on the agarose, similar to PLL and polypeptide, polysaccharides or nucleic acid-based multilayer films [64–67]. Thus, the UV-Vis characterization suggests that Ara-C is continually being loaded as the number of deposition cycles is increased.
Figure 2.

(a) UV-Vis spectrum of agarose loaded with multilayers of (PAA/PEG)5 (AraC/PEG)2(PAA/PEG)5(Ara-C/PEG)[(PAA/PEG)5(Ara-C/PEG)5]n, where n represents the number of repetitions of the sequence [(PAA/PEG)5(Ara-C/PEG)5]. In the plot, P represents (PAA/PEG) and A represents (Ara-C/PEG) multilayers and the numeric value represents the number of replicates. P5A5P5A1 represents the base multilayer for each case in the UV-Vis measurements. (b) Plot of Ara-C concentration within agarose hydrogel after the LbL multilayer deposition as a function of total number of Ara-C layers according to the multilayer sequence shown in panel (a). This figure is published in colour in the online edition of this journal, which can be accessed via http://www.brill.nl/jbs
3.2. Qualitative Evaluation of the Effect of Agarose Released Ara-C on Fibroblast Growth
LbL-coated agarose discs, without cells, were initially incubated in culture medium for up to 24 h, with the medium replaced at 30 min, 16 and 24 h. This first 24 h released some of the Ara-C from the LbL-coated agarose, prior to culturing the discs with the cells (quantification of this release is discussed in Section 3.3.2). Subsequently, cover-slips containing cells were placed on top of these LbL-coated agarose discs. Figure 3a shows the phase contrast images of fibroblasts cultured on a cover-slip in contact with LbL-coated agarose discs. After one day of culture with LbL-coated agarose discs (i.e., Day 1, which is 48 h since exposing the LbL-coated agarose to physiological pH, see Materials and Methods), the effect of Ara-C on the cells is noticeable as compared to the control cells exposed to non-coated agarose. As shown in Fig. 3b, the cell number decreased significantly in the treated condition as compared to the controls, suggesting that free Ara-C was released from the LbL-coated agarose on Day 1 (48 h). The effect of Ara-C released from LbL-coated agarose was further evaluated for an extended period, subsequent to the times shown in Fig. 3. After 3 days (96 h) of release from the LbL-coated agarose discs, fresh fibroblast cells were exposed to these discs for another 3 days. As illustrated in Fig. A2 (Appendix A), we observe that the released Ara-C had an impact on the fresh batch of fibroblasts as compared to the control cells exposed to non-coated agarose. This suggests that free Ara-C continued to release from the LbL-coated agarose for up to 168 h.
Figure 3.

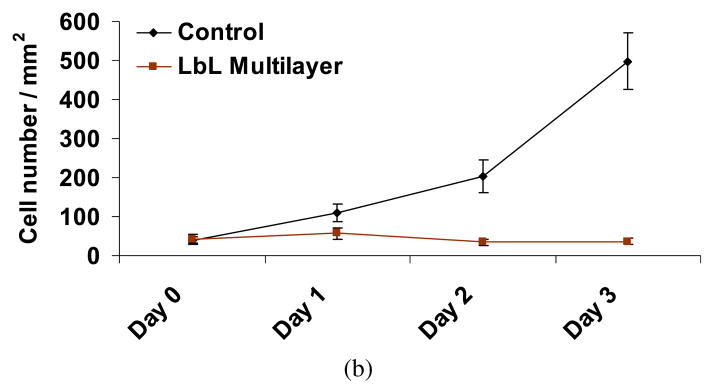
Fibroblasts cultured on a cover-slip in contact with LbL multilayer ([(PAA/PEG)5 (Ara-C/PEG)5]3PAA)-coated agarose. Prior to exposure to the cells, the LbL-coated agarose discs were incubated in cell culture media (without any cells) for 24 h, with fresh culture medium replaced at 30 min, 16 h and 24 h. (a) Cells were monitored for 3 days (indicated as Day 1 (48 h), Day 2 (72 h) and Day 3 (96 h)). Scale bar = 100 μm. Time in parentheses represents the age of the LbL-coated agarose, i.e., it denotes the time since the start of the multilayer degradation in culture media, where the initial 24 h of degradation was performed in the absence of cells. Controls are fibroblasts in contact with non-coated agarose. (b) The number of cells cultured on the covers-slips in contact with the LbL-multilayer-coated and non-coated agarose. Day 0 signifies fresh cells, i.e., just before placing the cells in contact with LbL-coated agarose. Student’s t -test (two-tailed) was used to evaluate the statistical significances: P < 0.00000004 at Day 1, Day 2 and Day 3 for cells exposed to LbL released Ara-C as compared to control. This figure is published in colour in the online edition of this journal, which can be accessed via http://www.brill.nl/jbs
Figure 4 shows the fibroblasts cultured on a cover-slip placed in contact with agarose discs without LbL (control, left panel), and agarose discs coated with PAA and PEG but without Ara-C, i.e., (PAA/PEG)15.5 multilayer on agarose (right panel). The number of PAA layers on (PAA/PEG)15.5-coated agarose was the same as in the ([(PAA/PEG)5(Ara-C/PEG)5]3PAA)-coated agarose with Ara-C. As evident from Fig. 4, PAA and PEG released from the agarose did not alter the fibroblast growth as compared with the control. PEG, but not PAA, is FDA approved and non-toxic. However, as illustrated in Fig. 4, multilayers of PAA and PEG do not appear toxic to the cells. In a previous study, the cytotoxic effect of PAA released from a similar LbL configuration was quantitatively assessed and found to be non-toxic [3]. These results suggest that the reduced growth rate of the fibroblasts observed in Fig. 3 is due to the release of the Ara-C from the LbL-coated hydrogels, and not due to cytotoxicity of PAA or PEG.
Figure 4.

Fibroblasts cultured on a cover-slip in contact with LbL multilayer ((PAA/PEG)15.5)-coated agarose, without (w/o) Ara-C. Cells were monitored for 3 days (indicated as Day 1 (48 h), Day 2 (72 h) and Day 3 (96 h)). Scale bar = 100 μm. Time in parentheses represents the age of the LbL-coated agarose, i.e., it denotes the time since the start of multilayer degradation in culture media, where the initial 24 h of degradation was performed in the absence of cells (with no cells and media replaced at 30 min, 16 h and 24 h). Controls are fibroblasts in contact with non-coated agarose.
3.2.1. Dose Response of Pure Ara-C on Fibroblast
Although we observed the effect of released Ara-C on fresh fibroblasts for up to 6 days (168 h) (as discussed above in Section 3.2), it is not possible to determine from Fig. 3a whether the reduced growth of the cells is due to free Ara-C that has continued to be released at subsequent time points, i.e., Day 2 (72 h) and Day 3 (96 h), or due to the continued effect of the Ara-C released and taken up by the cells on Day 1 (48 h). Depending on the concentration, Ara-C once taken up by the cells can inhibit cell growth for a long period (discussed below). Whether the Ara-C released on Day 1 continues its effects depend, in part, on the concentration of the Ara-C released. To shed light on this question, we added varying concentrations of pure Ara-C directly to the fibroblasts for 24 h and monitored the cells for 72 h. This provided a qualitative assessment of the effective concentration of Ara-C and the length of time the Ara-C was effective in the cells.
Ara-C was added to the cells for the first 24 h, and subsequently with the media (without Ara-C) replaced every 24 h and the cells monitored for up to 72 h (Figs 5a, 5b and A3 in Appendix A). The concentration of Ara-C added ranged from 0.25 μg/ml to 20 μg/ml. As evident from Figs 5a, 5b and A3, the effectiveness of the Ara-C decreased with concentration (20 μg/ml > 1.40 μg/ml > 0.70 μg/ml > 0.25 μg/ml). Cell growth in the presence of LbL released Ara-C (Fig. 3b) appeared to be roughly similar to the cell growth observed in cultures with Ara-C directly added within the concentrations limits of 0.7–20 μg/ml (Fig. 5b). The same cell seeding density was used in all the cases shown in Figs 3a and 5a. Although the cell growth in the 0.70 μg/ml and 0.25 μg/ml Ara-C cultures were slower than the control cells at each time point, the overall cell growth was faster than in the cells cultured with LbL released Ara-C. Thus, given that this is a qualitative assessment of the Ara-C released from the LbL-coated agarose, we can only estimate that the Ara-C concentration released from the LbL-coated agarose discs may range from approx. 1 μg/ml to 20 μg/ml on Day 1 (48 h). There could be two possibilities, it could be that either a high concentration of Ara-C (near to 20 μg/ml) was released within Day 1 (48 h), or the Ara-C release at low concentrations was maintained for up to Day 3 (96 h). Although this approach cannot be used to provide a quantitative estimate of the Ara-C release from the LbL-coated agarose, it does provide some indication of the range of Ara-C released and how long the effect of the Ara-C taken up on Day 1 lasts. To obtain a more quantitative estimate of the Ara-C released from the LbL-coated agarose disc at each time point, we measured the amount of Ara-C released with RP-HPLC.
Figure 5.

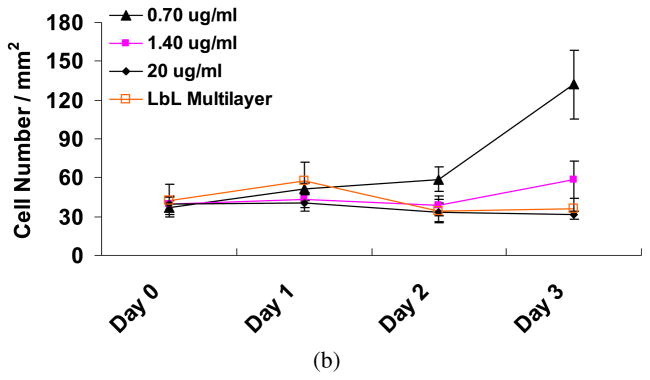
(a) The effect on fibroblast growth of directly adding pure Ara-C. Varying concentrations of Ara-C were added once, for the first 24 h and subsequently replaced with non-Ara-C containing media. The fibroblasts were monitored for up to 3 days. The effectiveness of the Ara-C decreased with concentration. Scale bar = 100 μm. (b) The number of cells as a function of time. Day 0 are fresh cells, i.e., just before adding the Ara-C to the cells. For comparison, growth rate of cells in contact with LbL-multilayer-coated agarose (Fig. 3b) is also plotted. The growth rate of the control cells (data not plotted) is similar to those plotted in Fig. 3b. Student’s t -test (two-tailed) was used to evaluate the statistical significances between the number of cells exposed to LbL-coated agarose and the number of cells in the direct Ara-C treatment. Day 1: P < 0.01 (0.7 μg/ml), P < 0.000003 (1.4 μg/ml) and P < 0.0000003 (20 μg/ml). Day 2: P < 0.000002 (0.7 μg/ml), P < 0.05 (1.4 μg/ml) and P < 0.5 (20 μg/ml). Day 3: P < 0.0000003 (0.7 μg/ml), P < 0.005 (1.4 μg/ml) and P < 0.001 (20 μg/ml). This figure is published in colour in the online edition of this journal, which can be accessed via http://www.brill.nl/jbs
3.3. Quantitative Evaluation of Free Ara-C
3.3.1. Quantitative Evaluation of Free Ara-C in a Mixture of PAA-PEG-Ara-C
The released Ara-C could be conjugated with either PAA or possibly with PEG released from the LbL. Ara-C could conjugate with PAA by forming an amide bond between the primary amine on Ara-C and the protonated carboxylic acid group on PAA at low pH, while PEG may form H-bond interactions. This would reduce the amount of free Ara-C as the relative concentrations of PAA and PEG increases. To confirm this, we prepared a solution of Ara-C, PAA and PEG, where the amount of Ara-C was kept constant while the amounts of PAA or PEG were increased. The RP-HPLC analysis showed that the amount of free Ara-C decreased as the relative amounts of PAA and PEG increased with a fixed amount of Ara-C (Fig. 6, where 6.25 μg of total Ara-C was added to each sample).
Figure 6.
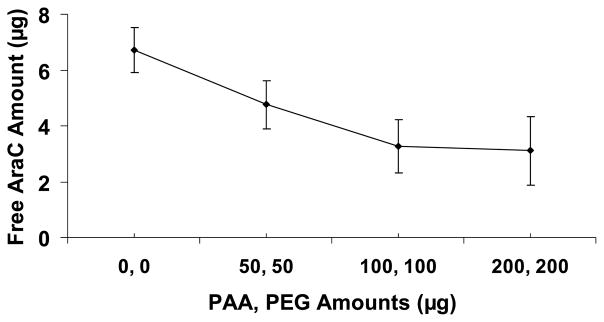
RP-HPLC measurements of the amount of free Ara-C in the solution mixtures of PAA, PEG and Ara-C as a function of increasing PAA and PEG amounts (no LbL). The x-axis indicates the amount of both PAA and PEG in the solution, e.g., (100, 100) μg on the x-axis indicates that 100 μg of PAA and 100 μg of PEG were added to the solution. Total amount of pure Ara-C added to each solution was 6.25 μg.
3.3.2. Quantitative Evaluation of Agarose Released Ara-C
Figure 7a and 7b shows the non-cumulative and cumulative concentrations, respectively, of free Ara-C released from the LbL-coated agarose discs at the time points noted. The time points shown in Fig. 7b correspond to the time points shown in parentheses in Fig. 3a. The average concentration of free Ara-C released from LbL at each time point was approx. 1 μg/ml (Fig. 7a and 7b). This amount falls within the range shown in Fig. 5. Therefore, the qualitative (as described in Section 3.2.1) and quantitative assessment of Ara-C release correlate. The total amount of free Ara-C encapsulated within the agarose after the multilayer formation (15 layers of Ara-C) was estimated to be 16.47 μg/ml hydrogel, as explained in Sections 2.2 and 3.1. Figure 7b shows the amounts of free Ara-C released also in terms of the percentage of total free Ara-C encapsulated within the LbL coated hydrogel. This is calculated based on the non-cumulative and cumulative releases shown in Fig. 7a and 7b, respectively.
Figure 7.

Non-cumulative and cumulative free Ara-C concentrations released from: (a, b) LbL-coated agarose and (c, d) non-coated Ara-C impregnated (soaked) agarose, both exposed to 1 × PBS at physiological pH. The cumulative concentrations are determined from 24 h onwards after the supernatant changes at 30 min and 16 h shown in panels (a) and (c). This figure is published in colour in the online edition of this journal, which can be accessed via http://www.brill.nl/jbs
Figure 7c and 7d demonstrates the non-cumulative and cumulative concentrations, respectively, of Ara-C (or free Ara-C) released from the Ara-C impregnated (soaked) agarose. The concentrations of Ara-C released were much higher at each time point for the Ara-C impregnated agarose, i.e., more of the Ara-C was released than was released from the LbL-coated agarose (comparing Fig. 7a with 7c; and Fig. 7b with 7d). The daily concentration of Ara-C released from the LbL-coated agarose remained at a near constant level of approx. 1 μg/ml (ranging from 0.62 to 1.48 μg/ml) at each time point. In contrast, the impregnated (soaked) agarose Ara-C release concentrations were decreased over time, i.e., releasing 9.96, 5.37, 2.43, 1.29, 0.79 and 0.48 μg/ml at 30 min, 16, 24, 48, 72 and 96 h, respectively. The cumulative plot for Ara-C impregnated agarose reached a near plateau at 96 h. However, the almost constant daily release and the non-plateau cumulative plot suggest that the release was more controlled from the LbL-coated agarose, and which would continue to release after 96 h. Figure 7d also shows the amount of Ara-C released in terms of the percentage of total Ara-C encapsulated within the Ara-C impregnated hydrogel. This is calculated based on the non-cumulative and cumulative releases shown in Fig. 7c and 7d, respectively. Comparing Fig. 7b and 7d, the release from the LbL-coated agarose was more controlled, releasing approx. 22% of the encapsulated Ara-C within the first 24 h, unlike the Ara-C impregnated (soaked) agarose which released approx. 88% of Ara-C released within the first 24 h. This supports that the LbL-coated agarose provided better controlled release of Ara-C than the Ara-C impregnated (soaked) agarose.
The concentration of Ara-C released from LbL-coated agarose was significantly lower than the levels at which the nerve cells in culture are deleteriously affected [8, 9, 15, 16]. Ara-C induces apoptosis in cultured cerebellar neurons in a concentration-dependent manner, with an EC50 value of approx. 60 μM [15]. Ara-C can enhance neuronal survival at low concentrations (10 μM = 2.43 μg/ml) by reducing the cell division of non-neuronal cells present in neuronal culture [8]. Also, it has been shown that an initial pulse delivery of Ara-C supplied twice at the concentrations of 10 μM did not deleteriously affect the Schwann cells (supporting cells in nerve regeneration) while successfully eliminating a large number of fibroblasts in a human peripheral nerve culture [9]. Therefore, in view of these previous studies, the amount of agarose released from LbL-coated agarose falls within a permissible limit, such that the released Ara-C should not affect the axonal growth negatively at the site of injury, but should be able to inhibit the growth of leptomeningeal fibroblasts around the scaffold. Nevertheless, we tested the effect of Ara-C released from the multilayer coated agarose on primary cortical neurons cultured in vitro, and observed that the low concentrations of Ara-C released from the multilayers did not adversely affect the viability of the neurons in culture (Fig. 8a and Appendix A, Fig. A4). Low concentrations of Ara-C released from the LbL eliminated some of the astrocytes, without significantly impacting the neurons (Fig. 8b). A typical treatment used to obtain a nearly pure culture of neurons, free of astrocytes, is 5 μM of Ara-C supplemented to neuron–astrocytes co-culture for a period of 2 days, and then replaced with medium without Ara-C [7, 68]. Figure 8a and 8b illustrates neuron–astrocytes co-culture exposed to media supplemented with 5 μM (approx. 1.2 μg/ml) Ara-C (with the media replaced every 24 h) or LbL released Ara-C (with the media replaced every 24 h with daily Ara-C releases, as described above) for the duration of the study. The concentrations of Ara-C released from LbL every 24 h ranged from 0.62 to 1.48 μg/ml (as discussed above), and decreased over time. Since the Ara-C concentration in the 5 μM control experiment added daily for the duration of the study was higher than the concentrations of Ara-C in the LbL released samples (and especially at the later time points), the cell number in the former case was lower than in the latter as indicated in Fig. 8b. Furthermore, an extended period of exposure to 5 μM of Ara-C decreased the number of neurons as compared with LbL released Ara-C (Appendix A, Fig. A4). Therefore, we believe that lower neurotoxicity occurs with the LbL strategy, mainly due to the lower concentration of Ara-C being released over time.
Figure 8.

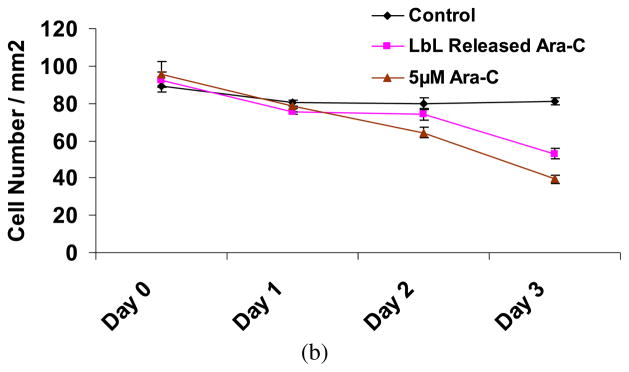
(a) Primary cortical neurons, as shown in the rightmost column, in culture medium containing Ara-C released from LbL-multilayer-coated agarose. Day 0 represents the time point at which the medium containing LbL released Ara-C was first exposed to the cells. Cells were 2 days old in culture prior to time point Day 0. The middle column illustrates primary cortical neurons cultured in medium supplemented with 5 μM Ara-C starting at Day 0. The medium supplemented with Ara-C was subsequently replaced every 24 h. The leftmost column are primary neurons cultured in regular cortical neuronal medium (without Ara-C) for the duration of the experiment, replaced every 24 h. (b) The number of neurons cultured with media containing Ara-C released from the LbL-multilayer-coated agarose and replaced every 24 h, with media supplemented with 5 μM Ara-C and replaced every 24 h, and with regular neuronal media replaced every 24 h (control). Student’s t -test (two-tailed) was used to evaluate the statistical significances: P < 0.1 (Days 0 and 1), P < 0.01 (Day 2), P < 0.001 (Day 3) for LbL released Ara-C and 5 μM Ara-C as compared to control; P < 0.001 for LbL released Ara-C as compared to 5 μM Ara-C on Days 2 and 3. This figure is published in colour in the online edition of this journal, which can be accessed via http://www.brill.nl/jbs
3.4. Effect of Ara-C Loading Solution Concentration
We also observed that the amount of Ara-C released from the LbL-coated agarose reduced if the concentration of bulk Ara-C solution at the beginning of LbL formation was decreased from 1 mg/ml to 500 μg/ml, as evident from the fibroblasts exposed to LbL released Ara-C when the bulk concentration of Ara-C was 500 μg/ml (Appendix A, Fig. A5). In all other cases discussed in this study, the bulk concentration of Ara-C at the beginning of LbL formation was 1 mg/ml. It is well known that the amount of polymer adsorbed or loaded within the multilayer structure reduces with decreasing polymer concentration at the time of LbL formation [69]. Thus, this reduced release of Ara-C could be due to decreased Ara-C loading and, thus, less free Ara-C release from the multilayer structure. Finally, although 500 μg/ml may not be sufficient to adequately reduce the fibroblast growth rate, the bulk concentration of Ara-C can be optimized between 500 μg/ml and 1 mg/ml to further minimize the neurotoxicity of the LbL released Ara-C for extended periods of release while sufficiently reducing the growth of the fibroblasts.
4. Conclusions
We demonstrate controlled release of an anti-mitotic agent, Ara-C, from agarose hydrogels as a strategy to control the reactive cell layer formation of fibroblasts in and around implanted scaffolds used for axonal regeneration of the central and peripheral nervous systems. LbL multilayers of PAA/PEG/Ara-C were formed over agarose to delay the release of Ara-C from agarose. The inhibitory affect of Ara-C released from LbL-coated agarose was demonstrated on fibroblast growth. The concentrations of Ara-C released can be modulated such that they should not affect axonal growth. Currently, we are in the process of assessing the effect of Ara-C released from LbL-coated agarose scaffolds on the reactive cell layer formation in vivo.
Acknowledgments
We thank Nhung Tran (Cellular and Biomolecular Lab, MSU) for the isolation of primary rat neuronal cells, and Joseph Leykam (Research Technology Support Facility, MSU) for his support in HPLC experiments. The work was supported in part by the National Institute of Health (R01GM079688 and R21RR024439), the National Science Foundation (CBET 0941055, CBET-1049127 and CBET 0832730) and the Veterans Administration RR&D service.
Appendix A
Figure A1.
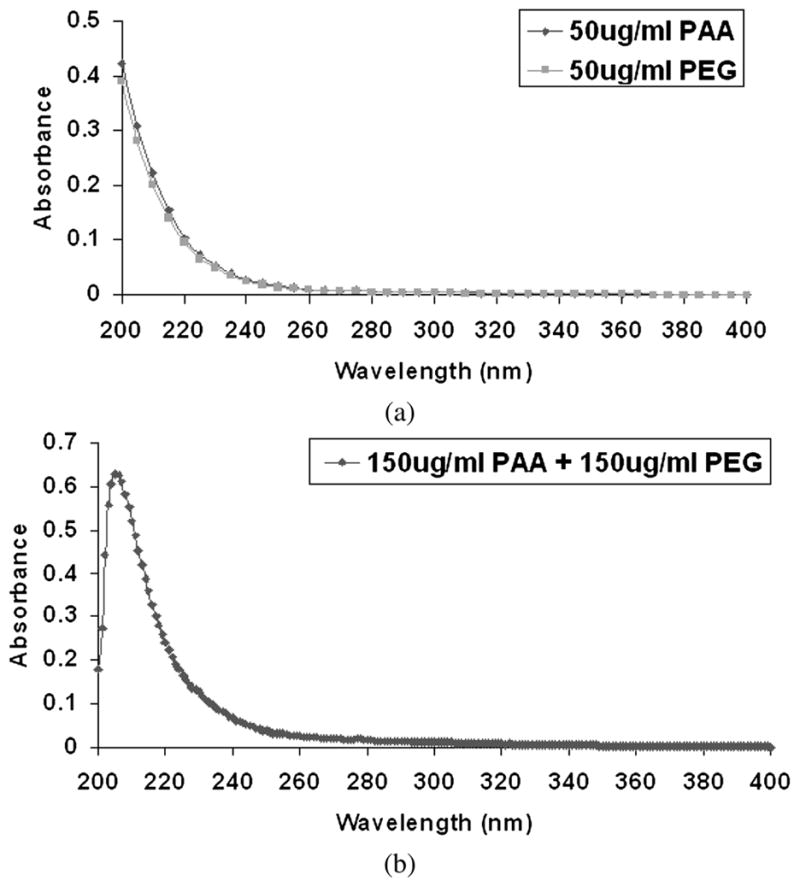
UV-Vis spectrum of (a) PAA and PEG alone and (b) PAA and PEG mixture.
Figure A2.

Fibroblasts cultured on a cover-slip in contact with LbL multilayer ([(PAA/PEG)5 (Ara-C/PEG)5]3PAA)-coated agarose 96 h after exposing LbL-coated agarose discs in cell-culture media, as described in Fig. 3. Fresh cells in contact with LbL-coated agarose discs after 96 h were monitored for another 3 days (indicated as Day 4 (120 h), Day 5 (144 h) and Day 6 (168 h)). Scale bar = 100 μm.
Figure A3.

The effect on fibroblast growth after directly adding pure Ara-C. Varying concentrations of Ara-C were added once, for the first 24 h, and subsequently replaced with non-Ara-C containing media. The fibroblasts were monitored for up to 3 days. The effectiveness of the Ara-C decreased with concentration. Scale bar = 100 μm.
Figure A4.
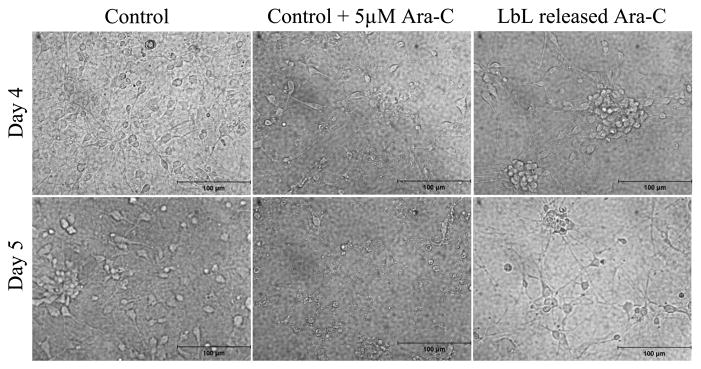
Primary cortical neurons in culture medium containing Ara-C released from LbL-multilayer-coated agarose are shown in the rightmost panels. Primary cortical neurons cultured in medium supplemented with 5 μM Ara-C, replaced every 24 h, are shown in the middle panels. Primary neurons cultured in regular cortical neuronal medium (without Ara-C), replaced every 24 h, are shown in the leftmost panels. Day 4 and Day 5 represent the time points subsequent to those shown in Fig. 8.
Figure A5.

Fibroblasts cultured on a cover-slip in contact with LbL multilayer ([(PAA/PEG)5 (Ara-C/PEG)5]3PAA)-coated agarose, when the bulk concentration of Ara-C loading solution at the beginning of LbL formation was 500 μg/ml. Prior to exposure to the cells, the LbL-coated agarose discs were incubated in cell culture media (without any cells) for 24 h, with fresh culture medium replaced at 30 min, 16 and 24 h. Cells were monitored for 3 days (indicated as Day 1 (48 h), Day 2 (72 h) and Day 3 (96 h)). Scale bar = 100 μm. Time in parentheses denotes the time since the start of the multilayer degradation in culture media, where the initial 24 h of degradation was performed in the absence of cells. Controls are fibroblasts in contact with non-coated agarose.
References
- 1.Stokols S, Sakamoto J, Breckon C, Holt T, Weiss J, Tuszynski MH. Tissue Eng. 2006;12:2777. doi: 10.1089/ten.2006.12.2777. [DOI] [PubMed] [Google Scholar]
- 2.Gros T, Sakamoto JS, Blesch A, Havton LA, Tuszynski MH. Biomaterials. 2010;31:6719. doi: 10.1016/j.biomaterials.2010.04.035. [DOI] [PubMed] [Google Scholar]
- 3.Mehrotra S, Lynam D, Maloney R, Pawelec KM, Tuszynski MH, Lee I, Chan C, Sakamoto J. Adv Funct Mater. 2010;20:247. doi: 10.1002/adfm.200901172. [DOI] [PMC free article] [PubMed] [Google Scholar]
- 4.Mehrotra S, Hunley SC, Pawelec KM, Zhang LX, Lee I, Baek S, Chan C. Langmuir. 2010;26:12794. doi: 10.1021/la101689z. [DOI] [PMC free article] [PubMed] [Google Scholar]
- 5.Capizzi RL. Invest New Drugs. 1996;14:249. doi: 10.1007/BF00194527. [DOI] [PubMed] [Google Scholar]
- 6.Kidambi S, Lee I, Chan C. Adv Funct Mater. 2008;18:294. doi: 10.1002/adfm.200601237. [DOI] [PMC free article] [PubMed] [Google Scholar]
- 7.Patil S, Chan C. Neurosci Lett. 2005;384:288. doi: 10.1016/j.neulet.2005.05.003. [DOI] [PubMed] [Google Scholar]
- 8.Manakova S, Puttonen KA, Raasmaja A, Mannisto PT. Toxicol In Vitro. 2003;17:367. doi: 10.1016/s0887-2333(03)00024-9. [DOI] [PubMed] [Google Scholar]
- 9.Calderon-Martinez D, Garavito Z, Spinel C, Hurtado H. J Neurosci Methods. 2002;114:1. doi: 10.1016/s0165-0270(01)00493-9. [DOI] [PubMed] [Google Scholar]
- 10.Plagemann PGW, Marz R, Wohlhueter RM. Cancer Res. 1978;38:978. [PubMed] [Google Scholar]
- 11.Wiley JS, Jones SP, Sawyer WH, Paterson ARP. J Clin Invest. 1982;69:479. doi: 10.1172/JCI110472. [DOI] [PMC free article] [PubMed] [Google Scholar]
- 12.Young JD, Jarvis SM. Biosci Rep. 1983;3:309. doi: 10.1007/BF01122895. [DOI] [PubMed] [Google Scholar]
- 13.Major PP, Egan EM, Herrick DJ, Kufe DW. Biochem Pharmacol. 1982;31:2937. doi: 10.1016/0006-2952(82)90266-0. [DOI] [PubMed] [Google Scholar]
- 14.Fram RJ, Kufe DW. Pharmacol Ther. 1985;31:165. doi: 10.1016/0163-7258(85)90021-x. [DOI] [PubMed] [Google Scholar]
- 15.Dessi F, Pollard H, Moreau J, Benari Y, Charriautmarlangue C. J Neurochem. 1995;64:1980. doi: 10.1046/j.1471-4159.1995.64051980.x. [DOI] [PubMed] [Google Scholar]
- 16.Geller HM, Cheng KY, Goldsmith NK, Romero AA, Zhang AL, Morris EJ, Grandison L. J Neurochem. 2001;78:265. doi: 10.1046/j.1471-4159.2001.00395.x. [DOI] [PubMed] [Google Scholar]
- 17.Wallace TL, Johnson EM. J Neurosci. 1989;9:115. doi: 10.1523/JNEUROSCI.09-01-00115.1989. [DOI] [PMC free article] [PubMed] [Google Scholar]
- 18.Tomkins CE, Edwards SN, Tolkovsky AM. J Cell Sci. 1994;107:1499. doi: 10.1242/jcs.107.6.1499. [DOI] [PubMed] [Google Scholar]
- 19.Keime-Guibert F, Napolitano M, Delattre JY. J Neurol. 1998;245:695. doi: 10.1007/s004150050271. [DOI] [PubMed] [Google Scholar]
- 20.Blanco MD, Trigo RM, Teijon C, Gomez C, Teijon JM. Biomaterials. 1998;19:861. doi: 10.1016/s0142-9612(97)00247-0. [DOI] [PubMed] [Google Scholar]
- 21.Kwong YL, Yeung DYM, Chan JCW. Ann Hematol. 2009;88:193. doi: 10.1007/s00277-008-0645-y. [DOI] [PubMed] [Google Scholar]
- 22.Glantz MJ, LaFollette S, Jaeckle KA, Shapiro W, Swinnen L, Rozental JR, Phuphanich S, Rogers LR, Gutheil JC, Batchelor T, Lyter D, Chamberlain M, Maria BL, Schiffer C, Bashir R, Thomas D, Cowens W, Howell SB. J Clin Oncol. 1999;17:3110. doi: 10.1200/JCO.1999.17.10.3110. [DOI] [PubMed] [Google Scholar]
- 23.Gomez C, Blanco MD, Bernardo MV, Olmo R, Muniz E, Teijon JM. Eur J Pharm Biopharm. 2004;57:225. doi: 10.1016/S0939-6411(03)00154-1. [DOI] [PubMed] [Google Scholar]
- 24.Esposito E, Pastesini C, Cortesi R, Gambari R, Menegatti E, Nastruzzi C. Int J Pharm. 1995;117:151. [Google Scholar]
- 25.Sastre RL, Blanco MD, Gomez C, del Socorro JM, Teijon JM. Polym Int. 1999;48:843. [Google Scholar]
- 26.Bouhadir KH, Kruger GM, Lee KY, Mooney DJ. J Pharm Sci. 2000;89:910. doi: 10.1002/1520-6017(200007)89:7<910::AID-JPS8>3.0.CO;2-#. [DOI] [PubMed] [Google Scholar]
- 27.Hoare TR, Kohane DS. Polymer. 2008;49:1993. [Google Scholar]
- 28.Nuttelman CR, Tripodi MC, Anseth KS. J Biomed Mater Res A. 2006;76:183. doi: 10.1002/jbm.a.30537. [DOI] [PubMed] [Google Scholar]
- 29.Richardson TP, Peters MC, Ennett AB, Mooney DJ. Nature Biotechnol. 2001;19:1029. doi: 10.1038/nbt1101-1029. [DOI] [PubMed] [Google Scholar]
- 30.Sutter M, Siepmann J, Hennink WE, Jiskoot W. J Control Rel. 2007;119:301. doi: 10.1016/j.jconrel.2007.03.003. [DOI] [PubMed] [Google Scholar]
- 31.Fatin-Rouge N, Milon A, Buffle J, Goulet RR, Tessier A. J Phys Chem B. 2003;107:12126. [Google Scholar]
- 32.Liang SM, Xu J, Weng LH, Dai HJ, Zhang XL, Zhang LN. J Control Rel. 2006;115:189. doi: 10.1016/j.jconrel.2006.08.006. [DOI] [PubMed] [Google Scholar]
- 33.Gutenwik J, Nilsson B, Axelsson A. AIChE J. 2004;50:3006. [Google Scholar]
- 34.Maaloum M, Pernodet N, Tinland B. Electrophoresis. 1998;19:1606. doi: 10.1002/elps.1150191015. [DOI] [PubMed] [Google Scholar]
- 35.Pernodet N, Maaloum M, Tinland B. Electrophoresis. 1997;18:55. doi: 10.1002/elps.1150180111. [DOI] [PubMed] [Google Scholar]
- 36.Xiong JY, Narayanan J, Liu XY, Chong TK, Chen SB, Chung TS. J Phys Chem B. 2005;109:5638. doi: 10.1021/jp044473u. [DOI] [PubMed] [Google Scholar]
- 37.Lynch I, de Gregorio P, Dawson KA. J Phys Chem B. 2005;109:6257. doi: 10.1021/jp0502149. [DOI] [PubMed] [Google Scholar]
- 38.Nakamae K, Nishino T, Kato K, Miyata T, Hoffman AS. J Biomater Sci Polymer Edn. 2004;15:1435. doi: 10.1163/1568562042368095. [DOI] [PubMed] [Google Scholar]
- 39.Park H, Temenoff JS, Holland TA, Tabata Y, Mikos AG. Biomaterials. 2005;26:7095. doi: 10.1016/j.biomaterials.2005.05.083. [DOI] [PubMed] [Google Scholar]
- 40.Peppas NA, Hilt JZ, Khademhosseini A, Langer R. Adv Mater. 2006;18:1345. [Google Scholar]
- 41.Peppas NA, Leobandung W. J Biomater Sci Polymer Edn. 2004;15:125. doi: 10.1163/156856204322793539. [DOI] [PubMed] [Google Scholar]
- 42.Decher G. Science. 1997;277:1232. [Google Scholar]
- 43.Lynn DM. Adv Mater. 2007;19:4118. [Google Scholar]
- 44.Tang ZY, Wang Y, Podsiadlo P, Kotov NA. Adv Mater. 2006;18:3203. [Google Scholar]
- 45.De Geest BG, Sanders NN, Sukhorukov GB, Demeester J, De Smedt SC. Chem Soc Rev. 2007;36:636. doi: 10.1039/b600460c. [DOI] [PubMed] [Google Scholar]
- 46.De Geest BG, Dejugnat C, Sukhorukov GB, Braeckmans K, De Smedt SC, Demeester J. Adv Mater. 2005;17:2357. [Google Scholar]
- 47.Matsusaki M, Sakaguchi H, Serizawa T, Akashi M. J Biomater Sci Polymer Edn. 2007;18:775. doi: 10.1163/156856207781034160. [DOI] [PubMed] [Google Scholar]
- 48.Kim BS, Park SW, Hammond PT. ACS Nano. 2008;2:386. doi: 10.1021/nn700408z. [DOI] [PubMed] [Google Scholar]
- 49.Picart C, Schneider A, Etienne O, Mutterer J, Schaaf P, Egles C, Jessel N, Voegel JC. Adv Funct Mater. 2005;15:1771. [Google Scholar]
- 50.Serizawa T, Yamaguchi M, Akashi M. Angew Chem, Int Edn. 2003;42:1115. doi: 10.1002/anie.200390293. [DOI] [PubMed] [Google Scholar]
- 51.Wood KC, Boedicker JQ, Lynn DM, Hammond PT. Langmuir. 2005;21:1603. doi: 10.1021/la0476480. [DOI] [PubMed] [Google Scholar]
- 52.Wood KC, Chuang HF, Batten RD, Lynn DM, Hammond PT. Proc Natl Acad Sci USA. 2006;103:10207. doi: 10.1073/pnas.0602884103. [DOI] [PMC free article] [PubMed] [Google Scholar]
- 53.Stockton WB, Rubner MF. Macromolecules. 1997;30:2717. [Google Scholar]
- 54.Wang LY, Wang ZQ, Zhang X, Shen JC, Chi LF, Fuchs H. Macromol Rapid Commun. 1997;18:509. [Google Scholar]
- 55.Sukhishvili SA, Granick S. J Am Chem Soc. 2000;122:9550. [Google Scholar]
- 56.Sukhishvili SA, Granick S. Macromolecules. 2002;35:301. [Google Scholar]
- 57.DeLongchamp DM, Hammond PT. Langmuir. 2004;20:5403. doi: 10.1021/la049777m. [DOI] [PubMed] [Google Scholar]
- 58.Mehrotra S, Lee I, Chan C. Acta Biomater. 2009;5:1474. doi: 10.1016/j.actbio.2009.01.004. [DOI] [PMC free article] [PubMed] [Google Scholar]
- 59.Ono SS, Decher G. Nano Lett. 2006;6:592. doi: 10.1021/nl0515504. [DOI] [PubMed] [Google Scholar]
- 60.Chandler LJ, Newsom H, Sumners C, Crews F. J Neurochem. 1993;60:1578. doi: 10.1111/j.1471-4159.1993.tb03326.x. [DOI] [PubMed] [Google Scholar]
- 61.Schiavon O, Pasut G, Moro S, Orsolini P, Guiotto A, Veronese FM. Eur J Med Chem. 2004;39:123. doi: 10.1016/j.ejmech.2003.10.005. [DOI] [PubMed] [Google Scholar]
- 62.Neumann MG, Tiera MJ. Pure Appl Chem. 1997;69:791. [Google Scholar]
- 63.Stokols S, Tuszynski MH. Biomaterials. 2006;27:443. doi: 10.1016/j.biomaterials.2005.06.039. [DOI] [PubMed] [Google Scholar]
- 64.Elbert DL, Herbert CB, Hubbell JA. Langmuir. 1999;15:5355. [Google Scholar]
- 65.Picart C, Lavalle P, Hubert P, Cuisinier FJG, Decher G, Schaaf P, Voegel JC. Langmuir. 2001;17:7414. [Google Scholar]
- 66.Picart C, Mutterer J, Richert L, Luo Y, Prestwich GD, Schaaf P, Voegel JC, Lavalle P. Proc Natl Acad Sci USA. 2002;99:12531. doi: 10.1073/pnas.202486099. [DOI] [PMC free article] [PubMed] [Google Scholar]
- 67.Ren KF, Ji J, Shen JC. Biomaterials. 2006;27:1152. doi: 10.1016/j.biomaterials.2005.07.021. [DOI] [PubMed] [Google Scholar]
- 68.Patil S, Balu D, Melrose J, Chan C. BMC Res Notes. 2008;1:20. doi: 10.1186/1756-0500-1-20. [DOI] [PMC free article] [PubMed] [Google Scholar]
- 69.Clark SL, Montague MF, Hammond PT. Macromolecules. 1997;30:7237. [Google Scholar]