

Abstract
The task induced blood oxygenation level dependent signal changes observed using functional magnetic resonance imaging (fMRI) is critically dependent on the relationship between neuronal activity and hemodynamic response. Therefore, understanding the nature of neurovascular coupling is important when interpreting fMRI signal changes evoked via task. In this study, we used regional homogeneity (ReHo), a measure of local synchronization of the BOLD time series, to investigate whether the similarities of one voxel with the surrounding voxels is a property of neurovascular coupling. FMRI scans were obtained from fourteen subjects during bilateral finger tapping (FTAP), digit-symbol substitution (DSST) and periodic breath holding (BH) paradigm. A resting-state scan was also obtained for each of the subjects for 4 minutes using identical imaging parameters. Inter-voxel correlation analyses were conducted between the resting-state ReHo, resting-state amplitude of low frequency fluctuations (ALFF), breath hold (BH) responses and task activations within the masks related to task activations. There was a reliable mean voxel-wise spatial correlation between ReHo and other neurovascular variables (BH responses and ALFF). We observed a moderate correlation between ReHo and task activations (FTAP: r = 0.32; DSST: r = 0.22) within the task positive network and a small yet reliable correlation within the default mode network (DSST: r = −0.08). Subsequently, a linear regression was used to estimate the contribution of ReHo, ALFF and BH responses to the task activated voxels. The unique contribution of ReHo was minimal. The results suggest that regional synchrony of the BOLD activity is a property that can explain the variance of neurovascular coupling and task activations; but its contribution to task activations can be accounted for by other neurovascular factors such as the ALFF.
Keywords: BOLD, fMRI, breath hold, resting-state, regional homogeneity
INTRODUCTION
Functional MRI (fMRI), as it is based upon the blood oxygenation level dependent (BOLD) contrast, is an indirect measure of neuronal activity (1). Increased regional neuronal activity induced by a task is accompanied by an enhancement of regional cerebral metabolic rate of oxygen so that the increase in oxygen may facilitate the conversion of glucose into the brain’s primary source of energy (Adenosine-5′-triphosphate, ATP). This in turn causes an up-regulation of regional cerebral blood flow and blood volume. Thus, neurovascular coupling which reflects the relationship between the bona fide regional neuronal activity and subsequent changes in the cerebral blood flow is one physiological contributor to the BOLD task activations.
Regional differences in vasculature have been shown to influence the BOLD task activations (2). Hypercapnia is an accumulation of carbon dioxide which induces vasodilation and thus, increases the cerebral blood flow. This method for deriving estimates of the vascular activity in the absence of neuronal activity has been shown to affect the BOLD signal in both humans and anesthetized rats (3-6). Hypercapnia can also be induced while breath holding (BH) which requires the subjects to periodically pause breathing (5,7,8). Task-free alternatives to hypercapnic methods have also been proposed. These methods estimate the vascular activity from the low frequency amplitude fluctuations of the resting-state fMRI BOLD signals (9-12). In general, these methods have been shown to reliably estimate and minimize the influences of the vascular activity on the BOLD-based estimates of neural activity.
Regional homogeneity (ReHo) (13) is a measure of the local synchronization of the fMRI BOLD time series typically in the resting-state of a given voxel to the nearest neighboring voxels (typically 26 voxels) using Kendell’s coefficient of concordance (KCC). ReHo does not take into account the amplitude of the time series fluctuations (14). Recent studies have shown that a significant relationship exists between ReHo in the resting-state and behavioral performance (i.e. reaction time) of a stop signal task (15). Based upon this result, we hypothesized that ReHo might be a measure of the spontaneous neuronal activity which in part influences the neuronal activity during a task and thus the task activations. Conversely, ReHo might also reflect mechanisms of neurovascular coupling that are common to both synchronized spontaneous and task-related activities.
To test these hypotheses, we conducted an inter-voxel correlation analyses between ReHo, ALFF in the resting-state, and BH responses to assess whether ReHo accounts for the variance of neurovascular coupling. Subsequently, linear regression models were used to estimate the unique and overlapping contributions of ReHo, ALFF and BH responses to the variance of task activated voxels. We hypothesized that ReHo would be correlated with ALFF, BH responses, and task activations due to the common hemodynamic response underlying them.
METHODS
Subjects
Fourteen young healthy subjects (8 F; mean age = 24 years) were recruited from the campuses of the University of Texas at Dallas (UTD) and the University of Texas Southwestern Medical Center (UTSW). The experimental procedures of the current study were approved by UTD and UTSW Institutional Review Boards. All subjects signed a written consent and received an honorarium for their participation.
Tasks
Each subject performed the following tasks: 1) bilateral finger tapping task (FTAP), 2) digit-symbol substitution task (DSST), and 3) periodic breath holding (BH). Resting-state scans were also obtained. All subjects were verbally instructed to relax with their eyes closed during the resting-state scan.
The FTAP paradigm consisted of sequentially touching each finger of each hand to its respective thumb. The subjects were asked to perform as best as they could with one touch and release during each tap. This paradigm consisted of an initial 20 sec of rest followed by four repetitions of alternate periods of 20 sec of bilateral finger tapping and 20 sec of rest (Figure 1).
Figure 1.
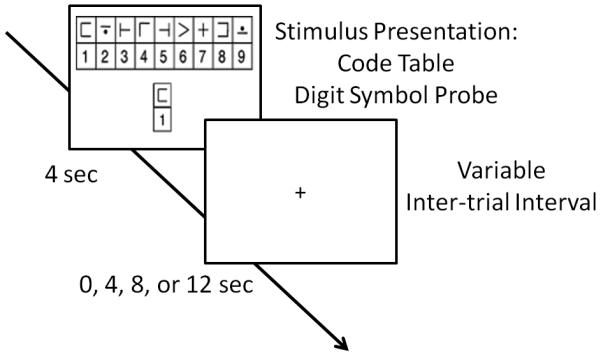
The modified digit symbol substitution task (DSST) paradigm. During each trial, a novel code table appeared in the middle of the screen and the probe digit-symbol pair below it for 4 sec with variable stimulus onset asynchrony of 0, 4, 8, or 12 sec.
The DSST paradigm was adapted from Wechsler Adult Intelligence Scale (16) which consisted of a code table with digit and nonsense symbol pairs (17). During the scan, the subjects simultaneously viewed a code table and a single digit-symbol probe on a projector screen for 4 sec followed by variable stimulus onset asynchrony of 0 sec, 4 sec, 8 sec or 12 sec as shown in Figure 1. The subjects pressed a right-thumb button if the probe pair matched one of the digit-symbol pairs on the code table; otherwise, they pressed a left-thumb button. A single scanning run consisted of 52 trials. Half of the probe pairs that were presented to the subjects were digit-symbol pairs in the code table whereas the other half of the probe pairs were not from the code table.
The BH paradigm consisted of a 40 sec rest period (normal breathing) followed by three repetitions of alternate periods of 20 sec of breath hold and 40 sec of normal breathing. Subjects were instructed to perform an inspirational breath holding inhaling volume of air similar to a normal breath cycle. Subjects were also trained prior to the actual scanning session to avoid inhaling larger volume of air than the normal volume during the scan.
MRI Data Acquisition
The Seimens Allegra 3T scanner was equipped with a fixed asymmetric head gradient coil and a shielded end cap quadrature transmit/receive birdcage radio-frequency coil. The subjects were positioned in a supine position on the gantry with the head in a midline location of the coil. To minimize head motion, foam padding and a pillow were used to secure the subjects. The high resolution anatomical images were acquired using an MPRAGE sequence of 1 mm isovoxel (sagittal TE=3.7 ms; flip angle = 12 °). All gradient echo echo-planar imaging (EPI) images were obtained during the tasks with the following parameters: field of view of 220 mm, 64 × 64 matrix, time of repetition/TE =2000/30 ms and slice thickness of 4 mm. A flip angle of 80° was used to minimize flow weighting. Thirty-two slices in the axial plane covering the entire brain was obtained. During the FTAP, BH and resting-state scans, 90, 110 and 120 EPI images were obtained, respectively. We obtained 120 EPI images during the resting-state scan to obtain a similar number of images as DSST. The DSST paradigm was scanned in three separate runs, with 150 EPI images for each run.
Data Analysis
Preprocessing
SPM8 package (http://www.fil.ion.ucl.ac.uk/spm/) with MATLAB 7.10 was used for imaging data analysis. The first two images for each scan session were discarded for all the subjects. The functional images were motion corrected using realignment function and co-registered to the subject’s anatomical images in native space. The subject’s deformation field maps obtained from the structural images was applied to the functional images to normalize them into the MNI space. The normalized images were resampled at 3 mm3 resolution. The functional images were not spatially smoothed to conduct inter-voxel analyses such that the image processing artifact was not a contributing factor to the significant correlations.
Task Activations
In the general linear model (GLM), the period of FTAP and periodic BH were modeled as a box-car function. The BH was modeled with an onset delay of 7 seconds to account for the BOLD response delay. The stimulus onset of DSST task was modeled as a delta function. The box-car or delta function was then convolved with a canonical hemodynamic response function (18). The general linear models were estimated in a voxel-wise manner across all the tasks. The average of the 3 runs was obtained for the DSST task. The activation (β) maps representing FTAP, BH signal changes and averaged effect of DSST were obtained for each subject as shown in Figure 2.
Figure 2.

Voxel-wise variances of the FTAP activations, the DSST activations, the BH responses, the ALFF, and the ReHo across the whole brain of a single subject. The color coding was adjusted to present the full range of the variance for each map. Z values in the bottom represent the z coordinates in the MNI space.
Resting-state ReHo and ALFF Maps
The time series of the resting-state fMRI data of each voxel was linearly detrended and bandpass filtered ranging between 0.01 to 0.08 Hz. ReHo and ALFF were calculated using the Resting-State fMRI Data Analysis Toolkit V1.7 (REST) (http://www.restfmri.net) in all subjects. ReHo map was obtained using Kendall’s coefficient of concordance (KCC) (13). KCC was computed using a cubic cluster size of 27 voxels, and the central voxel of every cubic cluster was assigned a derived KCC value. A large ReHo value implies that the resting-state time series of a given voxel has high regional synchronization with its 26 surrounding voxels’ time series. ALFF map was computed by estimating the low frequency power of each voxels. The low-frequency power of each voxel within the region of interest was divided by the mean low-frequency power of the region of interest (ROI) mask.
Intervoxel Correlation Analysis
Three masks were defined corresponding to 1) the FTAP task activations, 2) the DSST task activations and 3) the DSST deactivations. A voxel-wise variance map of a single subject is shown in Figure 2. We identified the masks using a one sample t-test with a threshold of p<0.001 (uncorrected) for FTAP and DSST as shown in Figure 3. Task positive and task negative mask were created separately for the DSST; however, a one-sample t-test did not result in a task negative mask for FTAP.
Figure 3.
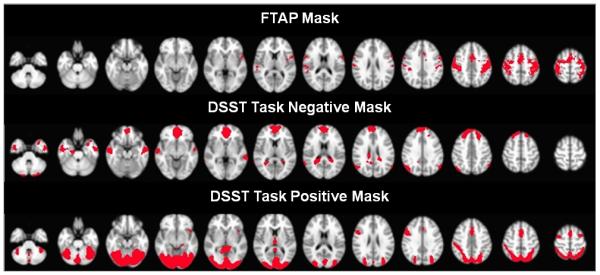
Masks used for inter-voxel correlation analysis. The motor network mask (top row) was defined by group activations of bilateral finger tapping task (FTAP). The task negative (middle row) and task positive (bottom row) masks were defined by group negative and positive activations of digit symbol substitution task (DSST), respectively.
For each subject, task activations from FTAP and DSST, BH responses, ALFF and ReHo from the voxels within the masks were extracted. The current study employed an inter-voxel analysis to investigate the spatial correlation between 1) BH responses and ReHo, 2) ALFF and ReHo, 3) task activations and ReHo, and 4) BH responses and ALFF within these masks. Studies have used both inter-voxel and subject-level correlation analyses to study the linear relationships between resting-state parameters, breath hold responses, and task activations (19). We obtained Pearson’s correlation coefficients for each of these analyses and conducted one-sample t-test of the transformed z scores to test the consistency of correlations across all the subjects.
Linear Regression Models
In addition to simple correlations between these variables, a set of linear regression models were used to estimate the unique and joint (overlapping) contributions of ALFF, ReHo and BH to task activations. The regression models are as follows:
| (1) |
| (2) |
| (3) |
| (4) |
| (5) |
| (6) |
| (7) |
Using these linear models, we calculated the r2 value representing the percentage of variance that was explained by the whole model for each subject. Next, the unique and overlapping relative contributions of ReHo, ALFF and BH responses to the variance of task activations were derived through subtraction of the calculated r2 values (see supplementary material for detailed information).
RESULTS
ReHo, BH Responses and ALFF
Inter-voxel correlation between ReHo and BH responses were consistent across all subjects and on average 0.415 ± 0.091 (p < 0.01) for FTAP, 0.2709 ± 0.086 (p < 0.01) for DSST positive network and 0.3165 ± 0.141 (p < 0.01) for DSST negative network also known as the default mode network (DMN) as shown in Figure 4.
Figure 4.

Correlations of regional homogeneity (ReHo) and breath hold (BH) activations within the three masks, a) FTAP, b) DSST TPN, c) DSST TNN. The upper panels illustrate the scatter plot for a single subject, and the lower panels show the correlation coefficient for each subject.
ReHo and ALFF were positively correlated. The correlation between ReHo and ALFF of resting-state were on average 0.642 ± 0.079 (p < 0.01), 0.431 ± 0.135 (p < 0.01) and 0.555 ± 0.124 (p < 0.01) for the FTAP, DSST positive network, and DSST negative network, respectively (Figure 5).
Figure 5.
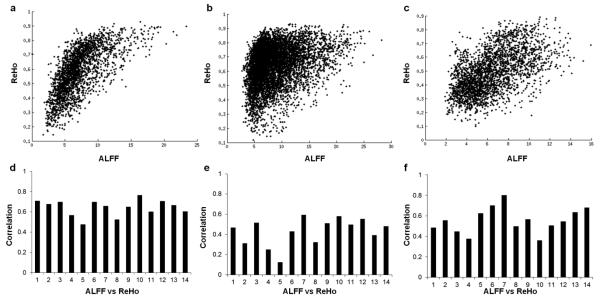
Correlations of regional homogeneity (ReHo) and amplitude of low frequency fluctuations (ALFF) within the FTAP, DSST task positive and task negative masks, respectively. The upper panels illustrate the scatter plot for a single subject, and the lower panels show the correlation coefficient for each subject.
ReHo and Task Activations
ReHo was positively correlated to the FTAP activations (0.318 ± 0.139, p <0.01), and the DSST activations within the task positive network (TPN) (0.223 ± 0.102, p<0.01) as shown in Figure 6 plots A and B, respectively. ReHo was negatively correlated to the task deactivations in the task negative network (TNN) of DSST (−0.0795 ± 0.0140, p<0.01) (Figure 6 plot C).
Figure 6.

Correlations of regional homogeneity (ReHo) and task activations within the three masks, a) FTAP, b) DSST TPN, c) DSST TNN. The upper panels illustrate the scatter plot for a single subject, and the lower panels show the correlation coefficient for each subject. Correlations were calculated in corresponding masks associated with task activations
There were strong correlations between neurovascular variables, BH responses and ALFF, in both tasks across all the subjects (Figure 7 plot a) as reported by others (10,11). In addition, task activations were correlated with two neurovascular variables, BH responses (Figure 7, plot b) and ALFF (Figure 7, plot c).
Figure 7.
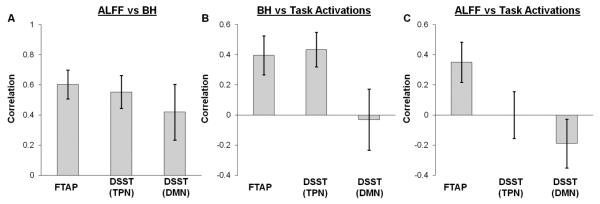
(Plot A) the group mean correlations between amplitude of low frequency fluctuations (ALFF) and breath hold activations (BH), (plot B) between BH and task activations and (plot C) between ALFF and task activations. Task activations are from bilateral finger tapping task (FTAP) and digit symbol substitution task (DSST).
Contributions of ReHo to Task Activations
The total contribution of ReHo, BH and ALFF accounted for 23.80% ± 13.79% of the total variances of FTAP activations (sum of all the variances in Figure 8 plot A). BH responses were the greatest unique contributor (6.82% ± 8.91%) whereas the unique contribution of ReHo was minimal (1.46%± 5.04%) to the motor task activation.
Figure 8.
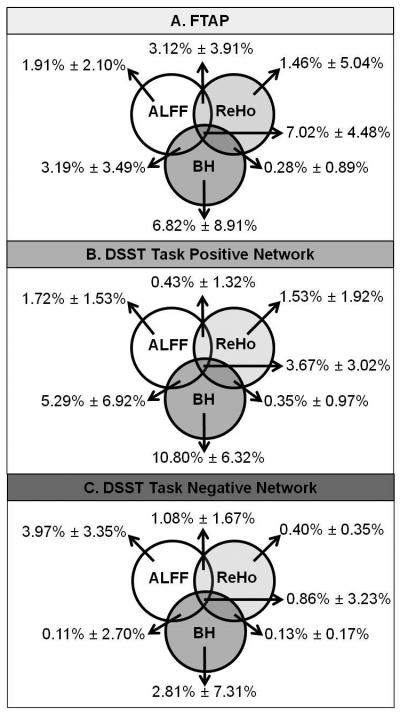
Venn diagram illustrating relative unique and overlapping contributions of regional homogeneity (ReHo, right circle), amplitude of low frequency fluctuations (ALFF, left circle) and breath hold (BH, lower circle) to FTAP (plot A) and DSST (plot B and C) task activation variances.
The total contribution of ReHo, BH and ALFF was on average 34.78% ± 18.40% for TNN (Figure 8 plot B) and 11.93% ± 14.86 % for TNN (Figure 8 plot C). BH responses were the greatest unique contributor to the DSST activations for TNN (10.80%±6.32%). Similar to FTAP, the unique contribution of ReHo was minimal to DSST TPN (1.53%± 1.92%) and DSST TNN (0.40%± 0.35%).
DISCUSSION
The current study systematically investigated the relationship between ReHo, ALFF, BH activation, FTAP and DSST activation. There were three main findings: 1) ReHo was moderately correlated with BH responses, 2) ReHo and ALFF were strongly correlated, and 3) ReHo was positively and negatively correlated with TPN and TNN, respectively, where the unique contribution of ReHo to amplitude of task activations was minimal.
Relationship between ReHo and Neurovascular Variables
BH responses and ReHo were moderately correlated (from 0.27 to 0.42). Breath holding has been shown to induce a hypercapnic state, that is, an increase in arterial carbon dioxide which in turn produces vasodilation and thus an increase in BOLD signal (5,7,8). Other studies have reported that regions with poor vascular responses have been associated with lower BOLD signal (10,12). Evidence suggests that highly vascularized areas (e.g. greater density of capillary beds) demonstrate considerably elevated local activity patterns compared to the less vascularized regions (20,21). As a result, the hemodynamic response of a particular voxel due to evoked neuronal activity has been shown to indirectly increase the metabolic activities of the surrounding voxels (e.g.(22). The present result suggests that BH responses may reflect the underlying vascular network in addition to the hypercapnic response during vascular perturbations.
Relationship between ReHo and ALFF
We observed a strong positive correlation between ReHo and ALFF (from 0.43 to 0.64) which reflects the temporal synchrony and amplitude fluctuation of spontaneous neuronal activity of a given voxel, respectively (e.g. (23-25). Our result suggests that high spontaneous neuronal activity in a given voxel is accompanied by elevated synchronization of the surrounding voxels and enhanced amplitude fluctuations of the resting-state BOLD signal. Previous studies from our group have shown that ALFF is highly correlated with BH responses (9,26). Positive correlations between ReHo and ALFF, and between ALFF and BH responses, suggests that the combination of both neuronal and physiological properties underlying both ReHo and ALFF contribute to higher correlations compared to the correlations between ReHo and BH responses.
Relationship between ReHo and Task Activations
ReHo was able to predict the amplitude of task activations, consistent with recent findings that showed a significant relationship between ReHo and activations evoked by a visuo-motor task (27). However, the unique contribution of ReHo to the variance of task activations was nominal. The current result suggests that regional synchrony may not influence the amplitude of task activations, rather the correlative relationship between ReHo and task activations may be due to the local neurovascular coupling that influences the amplitude of task activations (10,28,29). Therefore, the large overlapping contribution of ReHo, ALFF and BH responses to the variance of FTAP and DSST activations may be explained by 1) the local physiological processes such as the cerebral blood flow, cerebral blood volume, and metabolic rate of oxygen or 2) the same vascular beds such as the capillary density, the diameter of arteries, as well as the peripheral branches mediating resting-state, BH responses, and task activations (2) since higher ALFF and BH responses have been observed in regions comprised of large vessels(26).
Our data demonstrates that there is still a large portion of the variance (~76% in FTAP and ~65% in DSST) that are unexplained by the resting state properties and BH responses. Since the BOLD contrast is an indirect measure of cerebral metabolism, other physiological noises such as cardiac pulsatility of the blood(30), respiration accompanied by head motion(31), breathing variations (breathing depth and rate)(3,32) and heart rate fluctuations(33) may explain some portion of the unexplained variance in task activations. In addition, task activations also explain a portion of the variance in task activation reference vector. Future studies are warranted to determine the unique and overlapping contributions of these parameters to the unexplained variance in task activations.
Negative Correlation between Task Activations and Neurovascular Variables in Task Negative Network
An interesting finding of the current study was the negative correlations between task activations and other parameters including ReHo, ALFF, and BH responses in the DMN (Raichle et al., 2001). DMN is comprised of regions including the posterior cingulate cortex/precuneus, medial prefrontal cortex, bilateral inferior parietal lobule, and inferior temporal gyrus and has been implicated to be involved in various aspects of self-referential processing (34-36). Higher cerebral blood flow, ReHo and ALFF have been reported in DMN compared to other regions of the brain during the resting-state condition (37). Cerebral blood flow in DMN has been shown to decrease during a wide range of goal-directed tasks (34,35,38-40). Our result support previous findings that, within the DMN regions, a voxel with higher neurovascular coupling or spontaneous neuronal activity demonstrated by higher BOLD signal of resting-state decreases during DSST. Thus, the relationships between DSST activations and neurovascular parameters were reversed in the DMN regions.
However, the mechanisms of negative BOLD activation are currently less well understood. The negative BOLD activations may reflect a decrease in neuronal activity (41). Alternatively, negative BOLD activation might be caused by an excessive increase in neuronal activity causing the metabolic rate of oxygen to exceed the increase in CBF, resulting in a net increase in deoxygenation hemoglobin (42). Our results agree with the former explanation; future studies are needed to investigate the complex relationships among spontaneous neuronal activity, CBF, metabolism, and task activation within the DMN (e.g.(43).
Supplementary Material
Acknowledgement
This research was supported by NIH 5R01NS049176 (BBB).
REFERENCES
- 1.Kim SG, Ogawa S. Biophysical and physiological origins of blood oxygenation level-dependent fMRI signals. Journal of cerebral blood flow and metabolism: official journal of the International Society of Cerebral Blood Flow and Metabolism. 2012;32(7):1188–1206. doi: 10.1038/jcbfm.2012.23. [DOI] [PMC free article] [PubMed] [Google Scholar]
- 2.Gati JS, Menon RS, Ugurbil K, Rutt BK. Experimental determination of the BOLD field strength dependence in vessels and tissue. Magnetic resonance in medicine: official journal of the Society of Magnetic Resonance in Medicine / Society of Magnetic Resonance in Medicine. 1997;38(2):296–302. doi: 10.1002/mrm.1910380220. [DOI] [PubMed] [Google Scholar]
- 3.Wise RG, Ide K, Poulin MJ, Tracey I. Resting fluctuations in arterial carbon dioxide induce significant low frequency variations in BOLD signal. NeuroImage. 2004;21(4):1652–1664. doi: 10.1016/j.neuroimage.2003.11.025. [DOI] [PubMed] [Google Scholar]
- 4.Rostrup E, Law I, Blinkenberg M, et al. Regional differences in the CBF and BOLD responses to hypercapnia: a combined PET and fMRI study. NeuroImage. 2000;11(2):87–97. doi: 10.1006/nimg.1999.0526. [DOI] [PubMed] [Google Scholar]
- 5.Bandettini PA, Wong EC. A hypercapnia-based normalization method for improved spatial localization of human brain activation with fMRI. NMR in biomedicine. 1997;10(4-5):197–203. doi: 10.1002/(sici)1099-1492(199706/08)10:4/5<197::aid-nbm466>3.0.co;2-s. [DOI] [PubMed] [Google Scholar]
- 6.Kannurpatti SS, Biswal BB, Hudetz AG. Differential fMRI-BOLD signal response to apnea in humans and anesthetized rats. Magnetic resonance in medicine: official journal of the Society of Magnetic Resonance in Medicine / Society of Magnetic Resonance in Medicine. 2002;47(5):864–870. doi: 10.1002/mrm.10131. [DOI] [PubMed] [Google Scholar]
- 7.Thomason ME, Foland LC, Glover GH. Calibration of BOLD fMRI using breath holding reduces group variance during a cognitive task. Human brain mapping. 2007;28(1):59–68. doi: 10.1002/hbm.20241. [DOI] [PMC free article] [PubMed] [Google Scholar]
- 8.Riecker A, Grodd W, Klose U, et al. Relation between regional functional MRI activation and vascular reactivity to carbon dioxide during normal aging. Journal of cerebral blood flow and metabolism: official journal of the International Society of Cerebral Blood Flow and Metabolism. 2003;23(5):565–573. doi: 10.1097/01.WCB.0000056063.25434.04. [DOI] [PubMed] [Google Scholar]
- 9.Biswal BB, Kannurpatti SS, Rypma B. Hemodynamic scaling of fMRI-BOLD signal: validation of low-frequency spectral amplitude as a scalability factor. Magnetic resonance imaging. 2007;25(10):1358–1369. doi: 10.1016/j.mri.2007.03.022. [DOI] [PMC free article] [PubMed] [Google Scholar]
- 10.Di X, Kannurpatti SS, Rypma B, Biswal BB. Calibrating BOLD fMRI Activations with Neurovascular and Anatomical Constraints. Cereb Cortex. 2012 doi: 10.1093/cercor/bhs001. [DOI] [PMC free article] [PubMed] [Google Scholar]
- 11.Kannurpatti SS, Biswal BB. Detection and scaling of task-induced fMRI-BOLD response using resting state fluctuations. NeuroImage. 2008;40(4):1567–1574. doi: 10.1016/j.neuroimage.2007.09.040. [DOI] [PMC free article] [PubMed] [Google Scholar]
- 12.Kannurpatti SS, Motes MA, Rypma B, Biswal BB. Increasing measurement accuracy of age-related BOLD signal change: minimizing vascular contributions by resting-state-fluctuation-of-amplitude scaling. Human brain mapping. 2011;32(7):1125–1140. doi: 10.1002/hbm.21097. [DOI] [PMC free article] [PubMed] [Google Scholar]
- 13.Zang Y, Jiang T, Lu Y, He Y, Tian L. Regional homogeneity approach to fMRI data analysis. NeuroImage. 2004;22(1):394–400. doi: 10.1016/j.neuroimage.2003.12.030. [DOI] [PubMed] [Google Scholar]
- 14.Kendall MG, Gibbons JD. Rank correlation methods. Oxford University Press; UK: 1990. [Google Scholar]
- 15.Tian L, Ren J, Zang Y. Regional homogeneity of resting state fMRI signals predicts Stop signal task performance. NeuroImage. 2012;60(1):539–544. doi: 10.1016/j.neuroimage.2011.11.098. [DOI] [PubMed] [Google Scholar]
- 16.Wechsler D. The psychometric tradition: Developing the Wechsler Adult Intelligence Scale. Contemporary Educational Psychology. 1981;6(2):82–85. [Google Scholar]
- 17.Rypma B, Berger JS, Prabhakaran V, et al. Neural correlates of cognitive efficiency. NeuroImage. 2006;33(3):969–979. doi: 10.1016/j.neuroimage.2006.05.065. [DOI] [PubMed] [Google Scholar]
- 18.Friston KJ, Fletcher P, Josephs O, Holmes A, Rugg MD, Turner R. Event-related fMRI: characterizing differential responses. NeuroImage. 1998;7(1):30–40. doi: 10.1006/nimg.1997.0306. [DOI] [PubMed] [Google Scholar]
- 19.Kannurpatti SS, Rypma B, Biswal BB. Prediction of Task-Related BOLD fMRI with Amplitude Signatures of Resting-State fMRI. Frontiers in systems neuroscience. 2012;6:7. doi: 10.3389/fnsys.2012.00007. [DOI] [PMC free article] [PubMed] [Google Scholar]
- 20.Frostig RD, Lieke EE, Ts’o DY, Grinvald A. Cortical functional architecture and local coupling between neuronal activity and the microcirculation revealed by in vivo high-resolution optical imaging of intrinsic signals. Proceedings of the National Academy of Sciences of the United States of America. 1990;87(16):6082–6086. doi: 10.1073/pnas.87.16.6082. [DOI] [PMC free article] [PubMed] [Google Scholar]
- 21.Grinvald A, Lieke E, Frostig RD, Gilbert CD, Wiesel TN. Functional architecture of cortex revealed by optical imaging of intrinsic signals. Nature. 1986;324(6095):361–364. doi: 10.1038/324361a0. [DOI] [PubMed] [Google Scholar]
- 22.Koopmans PJ, Barth M, Norris DG. Layer-specific BOLD activation in human V1. Human brain mapping. 2010;31(9):1297–1304. doi: 10.1002/hbm.20936. [DOI] [PMC free article] [PubMed] [Google Scholar]
- 23.Liu D, Yan C, Ren J, Yao L, Kiviniemi VJ, Zang Y. Using coherence to measure regional homogeneity of resting-state FMRI signal. Frontiers in systems neuroscience. 2010;4:24. doi: 10.3389/fnsys.2010.00024. [DOI] [PMC free article] [PubMed] [Google Scholar]
- 24.Yang H, Long XY, Yang Y, et al. Amplitude of low frequency fluctuation within visual areas revealed by resting-state functional MRI. NeuroImage. 2007;36(1):144–152. doi: 10.1016/j.neuroimage.2007.01.054. [DOI] [PubMed] [Google Scholar]
- 25.Ni L, Qi R, Zhang LJ, et al. Altered regional homogeneity in the development of minimal hepatic encephalopathy: a resting-state functional MRI study. PloS one. 2012;7(7):e42016. doi: 10.1371/journal.pone.0042016. [DOI] [PMC free article] [PubMed] [Google Scholar]
- 26.Di X, Kannurpatti SS, Rypma B, Biswal BB. Calibrating BOLD fMRI activations with neurovascular and anatomical constraints. Cereb Cortex. 2013;23(2):255–263. doi: 10.1093/cercor/bhs001. [DOI] [PMC free article] [PubMed] [Google Scholar]
- 27.Kalcher K, Boubela RN, Huf W, et al. RESCALE: Voxel-specific task-fMRI scaling using resting state fluctuation amplitude. NeuroImage. 2012;70C:80–88. doi: 10.1016/j.neuroimage.2012.12.019. [DOI] [PMC free article] [PubMed] [Google Scholar]
- 28.Mennes M, Zuo XN, Kelly C, et al. Linking inter-individual differences in neural activation and behavior to intrinsic brain dynamics. NeuroImage. 2011;54(4):2950–2959. doi: 10.1016/j.neuroimage.2010.10.046. [DOI] [PMC free article] [PubMed] [Google Scholar]
- 29.Sirotin YB, Das A. Anticipatory haemodynamic signals in sensory cortex not predicted by local neuronal activity. Nature. 2009;457(7228):475–479. doi: 10.1038/nature07664. [DOI] [PMC free article] [PubMed] [Google Scholar]
- 30.Dagli MS, Ingeholm JE, Haxby JV. Localization of cardiac-induced signal change in fMRI. NeuroImage. 1999;9(4):407–415. doi: 10.1006/nimg.1998.0424. [DOI] [PubMed] [Google Scholar]
- 31.Glover GH, Li TQ, Ress D. Image-based method for retrospective correction of physiological motion effects in fMRI: RETROICOR. Magnetic resonance in medicine: official journal of the Society of Magnetic Resonance in Medicine / Society of Magnetic Resonance in Medicine. 2000;44(1):162–167. doi: 10.1002/1522-2594(200007)44:1<162::aid-mrm23>3.0.co;2-e. [DOI] [PubMed] [Google Scholar]
- 32.Birn RM, Diamond JB, Smith MA, Bandettini PA. Separating respiratory-variation-related fluctuations from neuronal-activity-related fluctuations in fMRI. NeuroImage. 2006;31(4):1536–1548. doi: 10.1016/j.neuroimage.2006.02.048. [DOI] [PubMed] [Google Scholar]
- 33.Shmueli K, van Gelderen P, de Zwart JA, et al. Low-frequency fluctuations in the cardiac rate as a source of variance in the resting-state fMRI BOLD signal. NeuroImage. 2007;38(2):306–320. doi: 10.1016/j.neuroimage.2007.07.037. [DOI] [PMC free article] [PubMed] [Google Scholar]
- 34.Raichle ME, MacLeod AM, Snyder AZ, Powers WJ, Gusnard DA, Shulman GL. A default mode of brain function. Proceedings of the National Academy of Sciences of the United States of America. 2001;98(2):676–682. doi: 10.1073/pnas.98.2.676. [DOI] [PMC free article] [PubMed] [Google Scholar]
- 35.Spreng RN, Mar RA, Kim AS. The common neural basis of autobiographical memory, prospection, navigation, theory of mind, and the default mode: a quantitative meta-analysis. J Cogn Neurosci. 2009;21(3):489–510. doi: 10.1162/jocn.2008.21029. [DOI] [PubMed] [Google Scholar]
- 36.Gusnard DA, Akbudak E, Shulman GL, Raichle ME. Medial prefrontal cortex and self-referential mental activity: relation to a default mode of brain function. Proceedings of the National Academy of Sciences of the United States of America. 2001;98(7):4259–4264. doi: 10.1073/pnas.071043098. [DOI] [PMC free article] [PubMed] [Google Scholar]
- 37.Zou Q, Wu CW, Stein EA, Zang Y, Yang Y. Static and dynamic characteristics of cerebral blood flow during the resting state. NeuroImage. 2009;48(3):515–524. doi: 10.1016/j.neuroimage.2009.07.006. [DOI] [PMC free article] [PubMed] [Google Scholar]
- 38.Mazoyer B, Zago L, Mellet E, et al. Cortical networks for working memory and executive functions sustain the conscious resting state in man. Brain research bulletin. 2001;54(3):287–298. doi: 10.1016/s0361-9230(00)00437-8. [DOI] [PubMed] [Google Scholar]
- 39.Takeuchi H, Taki Y, Nouchi R, et al. Effects of working memory training on functional connectivity and cerebral blood flow during rest. Cortex; a journal devoted to the study of the nervous system and behavior. 2012 doi: 10.1016/j.cortex.2012.09.007. [DOI] [PubMed] [Google Scholar]
- 40.Shulman GL, Fiez JA, Corbetta M, et al. Common blood flow changes across visual tasks .2. Decreases in cerebral cortex. Journal of Cognitive Neuroscience. 1997 doi: 10.1162/jocn.1997.9.5.648. [DOI] [PubMed] [Google Scholar]
- 41.Shmuel A, Augath M, Oeltermann A, Logothetis NK. Negative functional MRI response correlates with decreases in neuronal activity in monkey visual area V1. Nature neuroscience. 2006;9(4):569–577. doi: 10.1038/nn1675. [DOI] [PubMed] [Google Scholar]
- 42.Schridde U, Khubchandani M, Motelow JE, Sanganahalli BG, Hyder F, Blumenfeld H. Negative BOLD with large increases in neuronal activity. Cereb Cortex. 2008;18(8):1814–1827. doi: 10.1093/cercor/bhm208. [DOI] [PMC free article] [PubMed] [Google Scholar]
- 43.Goense J, Merkle H, Logothetis NK. High-resolution fMRI reveals laminar differences in neurovascular coupling between positive and negative BOLD responses. Neuron. 2012;76(3):629–639. doi: 10.1016/j.neuron.2012.09.019. [DOI] [PMC free article] [PubMed] [Google Scholar]
Associated Data
This section collects any data citations, data availability statements, or supplementary materials included in this article.