Abstract
Alternative promoter usage is typically associated with mRNAs with differing first exons that contain or consist entirely of a 5′ untranslated region. The murine Bcrp1 (Abcg2) transporter has three alternative promoters associated with mRNAs containing alternative untranslated first exons designated E1A, E1B, and E1C. The E1B promoter regulates Bcrp1 transcription in mouse intestine. Here, we report the identification and characterization of a novel Bcrp1 promoter and first exon, E1U, located upstream from the other Bcrp1 promoters/first exons, which is the predominant alternative promoter utilized in murine testis. Using in silico analysis we identified a putative steroidogenic factor-1 (SF-1) response element that was unique to the Bcrp1 E1U alternative promoter. Overexpression of SF-1 in murine TM4 Sertoli cells enhanced Bcrp1 E1U mRNA expression and increased Bcrp1 E1U alternative promoter activity in a reporter assay, whereas mutation of the SF-1 binding site totally eliminated Bcrp1 E1U alternative promoter activity. Moreover, expression of Bcrp1 E1U and total mRNA and Bcrp1 protein was markedly diminished in testes from adult Sertoli cell-specific SF-1 knockout mice, in comparison to testes from wild-type mice. Binding of SF-1 to the SF-1 response element in the E1U promoter was demonstrated by chromatin immunoprecipitation assays. In conclusion, nuclear transcription factor SF-1 is involved with the regulation of a novel promoter of Bcrp1 that governs transcription of the E1U mRNA isoform in mice. The present study furthers understanding of the complex regulation of Bcrp1 expression in specific tissues of a mammalian model.
1. Introduction
Breast Cancer Resistance Protein (BCRP, formally known as ABCG2) is a cellular membrane transporter widely expressed in pharmacologically relevant organs in humans [1]. Expression of BCRP in the intestine, liver (bile canaliculi), proximal renal tubular epithelium, and testis, as well as in the blood-brain and blood placental barriers has been shown to alter BCRP substrate drug absorption, distribution, and elimination [1–7]. BCRP is also expressed in certain normal and neoplastic stem cells, and in a variety of normal and neoplastic tissues and cell lines, where it may contribute to xenobiotic protection or cancer chemotherapeutic drug resistance in these cells [8]. As in humans, the murine orthologue of BCRP, Bcrp1, is expressed in a variety of mouse tissues including brain and testis, where it may play a role in drug disposition by limiting penetration of xenobiotic compounds that are Bcrp1 substrates [9].
The wide tissue distribution of BCRP expression leads to the hypothesis that BCRP transcription is controlled by unique, tissue-specific promoters. Evidence is mounting in support of this hypothesis for humans and mice [10–13]. Alternative promoter usage for BCRP was first noted by the observation of differential expression of novel leader exons in drug-selected human cancer cell lines compared to parental cells [10]. These novel first exons – termed E1a, E1b, and E1c – were also differentially expressed among a variety of human tissues, suggesting that the respective promoters upstream could be involved with tissue-specific regulation of BCRP transcription. Furthermore, a search of mRNA clones or expressed sequence tags (EST) in the GENBANK database against BCRP exon 2 found an additional first exon in four ESTs isolated from brain that was approximately 73 kb upstream of E1a, b, and c (and 90 kb upstream from the translational start site in exon 2), which was designated E1u [10]. Other investigators found hyperexpression of BCRP mRNA in blast cell samples from children with acute megakaryocytic leukemia, a subtype of acute myeloid leukemia (AML), compared to samples from children with other AML subtypes; BCRP mRNA containing an exon 90 kb upstream from the translational start site (presumably E1u) was isolated exclusively from the acute megakaryocytic leukemia samples [12].
In mice, multiple leader exons and alternative promoter usage was found to regulate Bcrp1 (Abcg2) expression during hematopoiesis [11]. Three alternative first exons of Bcrp1 were identified in C57BL/6J mice, which were termed E1A, E1B, and E1C. Using PCR analysis, all three mRNA isoforms were found in mouse brain, adult liver, and kidney, but mouse intestine only expressed the E1B isoform [11]. The E1B isoform was also predominant in Ter119+ erythroid cells from mouse bone marrow and in mouse fetal liver cells, whereas in cell fractions enriched for self-renewing hematopoietic stem cells, the E1A mRNA isoform predominated. The 5′ upstream region of E1A was found to have promoter activity in a reporter assay and to contain putative hematopoietic transcription factor binding sites [11]. Work in our own laboratory found that the promoter upstream of Bcrp1 exon E1B was the predominant promoter controlling Bcrp1 expression in mouse intestine; furthermore, the E1B promoter contained a functional cAMP response element unique only to that promoter which bound p-CREB and was regulated by cAMP [13].
The purpose of the present research is to examine Bcrp1 mRNA expression in a variety of murine tissues, to relate this to the expression of the various first exon mRNA isoforms of Bcrp1, and to uncover control mechanisms unique to tissue-specific Bcrp1 promoters. Our work reveals that among the murine tissues tested, the E1U mRNA isoform expression is limited almost exclusively to the testis. The promoter upstream from E1U contains a functional steroidogenic factor-1 (SF-1) response element that binds to and is activated by SF-1 in proportion to the expression of SF-1.
SF-1 is an orphan nuclear receptor that plays an important role in sex-differentiation, and in the development and regulation of steroidogenic organs such as the gonads, placenta and adrenal gland; it is also expressed in the pituitary gland and in the ventromedial nucleus of the hypothalamus (VMNH) [14, 15]. SF-1 is involved in the transcriptional regulation of genes involved with the process of steroidogenesis and possibly a wide variety of other cellular processes such as angiogenesis, apoptosis and proliferation [16]. SF-1 responsive genes are numerous, and include most genes in the steroidogenic pathway, steroid hydroxylase genes, the luteinizing hormone and prolactin receptors [14], and the follicle stimulating hormone receptor (FSHR) [17].
2. Materials and Methods
2.1. Materials and cell culture
The rat anti-mouse Bcrp1 (BXP-9) (Abcam, Cambridge, MA) and the rabbit anti-mouse SF-1 antibodies (Millipore) were used. The rabbit anti-mouse GAPDH, and the horseradish peroxidase (HRP) labeled secondary antibodies were purchased from Cell Signaling Technology (Danvers, MA). The SF-1 plasmid was obtained from Addgene (Cambridge, MA). Vorinostat (SAHA) was kindly provided by the division of Cancer Treatment and Diagnosis, National Cancer Institute (NCI).
TM4, a mouse Sertoli cell line, was purchased from the American Type Culture Collection (ATCC, Manassas, VA). TM4 cells were cultured in a 1:1 mixture of Ham’s F12 medium and DMEM with 1.2 g/L sodium bicarbonate and 15 mM HEPES supplemented with 5% horse serum and 2.5% FBS (Biosource), plus 10% penicillin-streptomycin. All experiments were performed with TM4 cells between passages 2 and 5, and within 6 months of receipt from the ATCC.
2.2. Animals
Male FVB/NCr mice (6 weeks old, NCI) or male C57BL6/J mice (6–8 weeks old, NCI) were allowed to acclimatize for at least two weeks with sufficient food and water. In accordance with an animal use protocol approved by University of Maryland School of Medicine Institutional Animal Care and Use Committee (assurance number 1106007), mice were euthanized by cervical dislocation; the brain, heart, liver, lung, kidney, spleen, muscle and testis were removed and washed twice in ice cold saline. The tissues were then flash frozen and stored in liquid nitrogen until further analysis.
All animal experiments involving the breeding of SF-1 floxed animals [18, 19] to transgenic mice where Cre recombinase expression is under control of Sertoli cell-specific elements of the anti-Mullerian hormone (AMH) gene promoter (AMH-Cre animals) were approved by the Institutional Animal Care Research advisory committee of the University of Pittsburgh (PHS assurance number A3187-01). Studies of tissues from these animals done at the University of Maryland were approved by the University of Maryland Institutional Animal Care and Use Committee (exemption DR-051301A). SF-1 floxed animals were purchased from the Jackson Laboratory (Bar Harbor, ME). The testes tissues used in these studies were from animals that were homozygous for the SF-1 floxed allele and heterozygous for the AMH-Cre transgene. Cre recombinase is expressed in testes at embryonic day 15 (E15) of development [20]. Crosses performed for this outcome involved crossing males heterozygous for the AMH-Cre allele to females homozygous for the SF-1 floxed allele. Litters born to this cross were PCR-genotyped by tail clips at weaning. Primers used for SF-floxed are: Flox SF-1 Neo (TGAGATGACAGGAGATTCTGC), forward loxP (CCAGGAAGACAACTTCTCCGT), and reverse loxP (TGTCTCAGGGAGACCATGAG). The three primers were used in a single reaction and the size of products determined if the products were wild type vs. the floxed allele. AMH-Cre mice were genotyped using general Cre primers (Cre-Forward: 5′-GCATTACCGGTCGATGCAACGAGTG – 3′ and Cre-Reverse: 5′ – GAACGCTAGAGCCTGTTTTGCACGTTC – 3′). Testes from two pairs of knockout (AMH-Cre+/−, SF-1 Lox+/+) and control (AMH-Cre+/−, SF-1 Lox+/−) mice were used, with each mouse pair from the same mating. The ages of the mice from each mating were 115 days (16.4 weeks) and 116 days (16.6) weeks.
2.3. RNA and protein preparation
Flash frozen samples were individually crushed using a mortar and pestle and divided into two equal portions. One portion was Trizol (Invitrogen Corp, Carlsbad, CA) extracted to obtain RNA and then reverse transcribed with M-MULV reverse transcriptase (Roche Diagnostics, Basel, Switzerland). The other portion was homogenized by homogenizer in RIPA buffer (50 mM Tris-HCl, pH 7.4; 1% NP-40; 0.25% sodium deoxycholate; 150 mM NaCl; 1 mM EDTA; 1 mM sodium orthovanadate; 1μg/mL aprotinin and 2 mM Pefabloc SC) and centrifuged at 12,000 × g for 20 min. The supernatant was collected and stored at −80°C until further protein analysis.
Testis from Sertoli cell-specific SF-1 knockout (AMH-Cre+/−, SF-1 Lox+/+) and wild type siblings (AMH-Cre+/−, SF-1 Lox+/−) were weighed, and then stored frozen until further use. Frozen testes were crushed in Trizol using a mortar and pestle, then the RNA extracted, reverse transcribed to cDNA with M-MULV reverse transcriptase (Roche Diagnostics, Basel, Switzerland), then subjected to quantitative, real-time RT-PCR using methods described in Section 2.6 and primers given in Table 1, or as reported previously [13].
Table 1.
Primers
| Primer Name | Sequence | Function |
|---|---|---|
| SF-1 F | TACCACTACGGGCTGCTCAC | RT-qPCR |
| SF-1 R | GCTGCGTCTTGTCGATTTTG | RT-qPCR |
| SF-1 PM1S | cacttcctccaaCAAacaCATAcctcctaatagtgcc | Site directed mutagenesis |
| SF-1 PM1AS | ggcactattaggaggTATGtgtTTGttggaggaagtg | Site directed mutagenesis |
| Bcrp1E1U/SF-1 F | GGTGGTGACGGGACAGTTAG | ChIP qPCR |
| Bcrp1E1U/SF-1 R | CCCTGCCCCTAACAAATCTT | ChIP qPCR |
| FSHR/SF-1 F | CCTGTGGACTCCCAACAACA | ChIP qPCR |
| FSHR/SF-1 R | CTGAGGTCCCTGGCAACTTC | ChIP qPCR |
| E1U Bcrp1 F | AGACACCCTGATGTTACC | RT-qPCR, PCR |
| Bcrp1 3′ R | GGGCCACATGATTCTTCCAC | PCR |
2.4. Bcrp1 transcriptional start site (TSS) and promoter region predictions
All of the four Bcrp1 5′ untranslated regions (UTRs) predicted in silico were contained within an 80kb genomic region 5′ upstream to the translational start site in Exon 2 of Bcrp1 mRNA. This region was examined for potential transcriptional start sites (TSS) using TSS prediction programs (PromoSer, Dragon TSS, PromH(W)) and for potential promoter regions using promoter prediction programs (Proscan, PAGEN and Gene2Promoter) [21–27]. The identified TSSs and promoter regions were then mapped in relation to the translational start site in Exon 2 of Bcrp1 mRNA. Putative trans elements in the four alternative Bcrp1 promoter regions were predicted using the SiteGA transcription factor binding site prediction web tool [28]. The Transcription Regulatory Regions Database (TRRD) program TRRD Site [29] was used to identify potential binding sites for transcription factors within the E1U core promoter region.
2.5. dbEST BLAST analysis
The mouse Bcrp1 mRNA sequence [30] was probed against the database of Expressed Sequence Tags (dbEST) at NCBI using the Basic Local Alignment Search Tool (BLAST) network service to identify ESTs with significant sequence similarity to Bcrp1 mRNA. The ESTs identified were then queried against the Mus musculus chromosome 6 genomic contig [31] which contains Bcrp1 mRNA, to identify possible alternative 5′ untranslated regions (UTRs) of Bcrp1.
2.6. Quantitative RT-PCR for Bcrp1 mRNA isoforms
The alternative Bcrp1 mRNA isoforms from different murine tissues were quantified by qRT-PCR, using standard curves generated by serial dilution of the respective full-length isoforms inserted in pcDNA3 vector as described previously [13]. Additionally, in this paper some assays were performed using twenty ng of the reverse-transcribed RNA, then PCR-amplified in real time with IQ SYBR green mix (Bio-Rad, Hercules, CA) using the MyiQ Single-Color Real-Time PCR Detection System (Bio-Rad). Each reaction was performed in duplicate. The data from three different mice were collected and analyzed for significant differences in Bcrp1 mRNA isoform expression in the different mouse tissues. The data for the TM4 cell line is representative of at least three different passages. The qRT-PCR primer sequences for total Bcrp1 and 5′ UTR isoforms: E1U, E1A, E1B and E1C, and β-actin are the same as previously described [13]. The primers used for SF-1 are shown in Table 1, as are the primers used to amplify a full-length E1U cDNA. Data from qRT-PCR studies are expressed as copies of mRNA per microgram of reverse-transcribed cDNA, or as copies of mRNA/copies of β-actin mRNA.
2.7. Western Blotting
80 μg of testis or TM4 cell protein lysates were electrophoresed on a 4–12% SDS-PAGE gel and transferred to PVDF membranes. The membranes were then probed overnight with rat anti-mouse Bcrp1 antibody (Abcam) or rabbit anti-mouse SF-1 antibody at 4°C, followed by HRP-labeled anti-rat and anti-rabbit secondary antibodies (Cell Signaling) for 1 h at room temperature. The membranes were re-probed with GAPDH rabbit monoclonal antibody followed by the HRP labeled anti-rabbit secondary antibody. GAPDH was used as loading control. Autographic images were scanned with an Epson Perfection V300 photo scanner, and band density was analyzed with ImagJ software.
2.8. 5′ RACE
RNA obtained from mouse testis was subjected to 5′ rapid amplification of cDNA ends (RACE) with First Choice RLM-RACE kit (Ambion Inc, Austin, TX) in conformity with kit instructions, utilizing kit-supplied 5′ RACE forward primers and user synthesized Bcrp1 specific reverse primers (as previously reported) [13]. The 5′ RACE product obtained was then cloned into the pCR2.1 vector and subsequently transformed into TOP10 bacteria using the TOPO TA cloning kit (Invitrogen). Plasmid DNA was extracted from several positive bacterial clones and sequenced at the Biopolymer/Genomics Shared Service of the University of Maryland Greenebaum Cancer Center using a Model 3730XL 96-capillary high-throughput sequencer (Applied Biosystems, Foster City, CA). The sequences obtained were subjected to BLAST analysis against the 100kb region upstream to the translational start site in Exon 2 of mouse Bcrp1 gene at NCBI using BLAST network service.
2.9. Reporter assay
Reporter assays were performed as described previously [13]. Briefly, TM4 cells were cultured in 24-well plates at a density of 200,000 cells/well. Six hours after plating, TM4 cells were transfected with 0.2 μg of empty pGL3-basic vector or with 0.2 μg of pGL3 vector containing the −1875/+10 E1A or −1847/+60 E1B or −1904/+83 E1C or −1906/+64 E1U Bcrp1 deletion construct along with 4 ng of pRL-TK, the internal control, using X-tremeGENE HP DNA transfection reagent (Roche). After 30 hr of transfection, cells were lysed in passive lysing buffer and luciferase activity was determined with a Dual-luciferase reporter assay kit (Promega). The results are expressed as the ratio of the firefly luciferase activity divided by the internal (Renilla luciferase) control.
2.10. Mutation of the SF-1 CIS response element on the −1906/+64 E1U deletion construct; determining its effect on promoter activity
Three adjacent point mutations (underlined in Table 1) were introduced in the SF-1 binding site, predicted on the −1906/+64 Bcrp1 E1U promoter region, using a PCR-based site-directed mutagenesis kit (Stratagene, La Jolla, CA) according to the manufacturer’s standard protocol. The reporter activity of −1906/+64 E1U deletion construct with the SF1 point mutation (E1UMut) was then measured in TM4 cells. The primers used for the point mutations are shown in Table 1.
2.11. Generation of SF-1 overexpressing TM4 cell line (TM4/SF-1)
TM4 cells were transfected with 2 μg of an SF-1 expression vector (pcDNA3 plasmid containing a full-length cDNA for SF-1, Addgene, Cambridge, MA) or 2 μg of pcDNA3 empty vector for 30 hr. Following transfection, TM4 cells were selected with G418 (500 μM) for two weeks. Individual TM4 cell clones overexpressing SF-1 that survived G418 selection were then isolated and cultured in complete culture medium.
2.12. Chromatin immunoprecipitation (ChIP) assay
Mice testis (weighing approximately 0.1 g) were cut into small pieces and gently pressed to release the spermatozoa; 2 mL of PBS containing protease inhibitor cocktail (EMD Chemicals, Inc.) were then added and the cells were washed once to remove spermatozoa, then resuspended in PBS/protease inhibitor cocktail and subjected to ChIP assay as per the manufacturer’s instructions (Millipore, Temecula, CA). Briefly, the small pieces of tissue were cross-linked with 1% formaldehyde for 15 min at room temperature with rotation, and then the reaction was stopped by glycine (final concentration of 0.125 M) for 5 min at room temperature. The samples were washed with PBS and lysed in sodium dodecyl sulfate lysis buffer. DNA was sheared to 200–1000 bps by sonication. The sonicated cell lysates were precleared with salmon sperm DNA blocked protein A agarose beads (Millipore). Immunoprecipitation of protein-DNA complexes was then performed on the pre-cleared lysates with rabbit anti-SF-1 antibody (Millipore). Simultaneously, the pre-cleared lysates were also incubated with normal rabbit IgG (Cell Signaling Technology) as control for potential non-specific co-immunoprecipitations. DNA was quantified by quantitative real-time PCR using primers specific for the SF-1 CIS response element in the Bcrp1 E1U promoter. Another pair of primers specific for the known SF-1 CIS response element in the murine FSHR promoter was used as positive control [32]. The qPCR primers used specific for two SF-1 CIS response elements are shown in Table 1.
2.13. Statistical Analysis
The t-test was used for simple comparisons between mean values. One-way analysis of variance with post hoc Dunn’s test was used to analyze E1U, E1A, E1B and E1C isoforms expressed in different mouse tissues.
3. Results
3.1. Bcrp1 mRNA expression is high in the murine testis
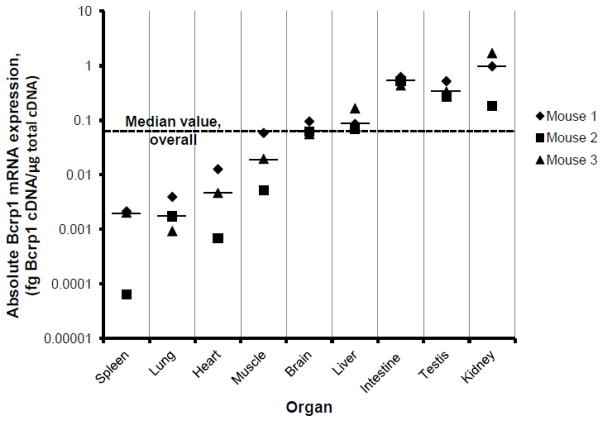
A wide range of expression of Bcrp1 mRNA was noted amongst the 9 mouse organs studied from each of three male FVB/NCr mice (Figure 1). Median values for each organ are indicated by the horizontal bars in the figure; the overall median value for all determinations for the 9 organs from 3 mice (N=27) is indicated in the figure by the horizontal dashed line. Bcrp1 expression in brain was approximately equal to the overall median value of Bcrp1 expression for all organs. The median value for Bcrp1 mRNA expression in the intestine, testis, kidney, and liver was higher than the overall median value, whereas the median mRNA expression in spleen, lung, heart, and muscle tissue from these three mice was lower than the overall median value. Bcrp1 expression was also high in the kidney and testis of 6- to 8-week old male C57BL6/J mice (supplemental Figure S1).
FIGURE 1.
Bcrp1 mRNA expression in a variety of male FVB/NCr mouse tissues, as measured by reverse-transcription qPCR. Data for organs/tissues taken from 3 different mice are displayed. The short horizontal lines represent the median value for each organ/tissue. The median value of Bcrp1 mRNA expression for all determinations is indicated by the horizontal dashed line. Data are expressed as fg of Bcrp1 cDNA per microgram of reverse-transcribed cDNA; points represent the mean of two PCR assays.
3.2. In silico prediction of promoter regions and Bcrp1 TSS
BLAST analysis of the 5′ upstream region of Bcrp1 against the mouse dbEST in GENBANK and Bcrp1 exon 2 identified ESTs with 4 distinct untranslated leader exons alternatively spliced to Bcrp1 Exon 2 (Figure 2, supplemental Table S1). Three of these first exons, located 58 kb, 15 kb and 5 kb 5′ upstream from Exon 2 of Bcrp1, corresponded to the previously reported alternative first exons E1A, E1B and E1C respectively [11, 13]. The fourth leader exon, based on an EST derived from murine testis, is a novel finding which we designate E1U (Figure 2, supplemental Table S1).
FIGURE 2.
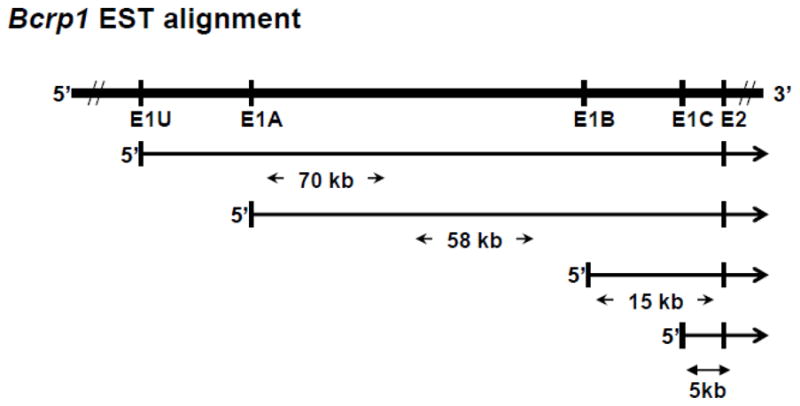
Schematic of the alignment of Bcrp1 ESTs in relation to Exon 2 of Bcrp1. dbEST BLAST analysis identified ESTs that aligned with four distinct Bcrp1 5′ UTR alternative first exon sequences, E1U, E1A, E1B, and E1C. See also supplemental Table S1.
The TSS/promoter prediction programs (PromoSer, Dragon TSS, PromH(W), Proscan, PAGEN, and Gene2Promoter) predicted three alternative Bcrp1 TSSs and promoters with high confidence in the 80 kb genomic region 5′ upstream of Bcrp1 translational start site in Exon 2 (supplemental Figure S2). TSSs were predicted 15 and 58 kb upstream from Exon 2, corresponding to E1A and E1B identified by the dbEST BLAST search (Figure 2, supplemental Figure S2). Proscan predicted promoters that aligned with E1U, E1A and E1B. Interestingly, none of the programs identified a TSS or promoter that aligned with E1C (Figure 2, supplemental Figure S2).
3.3. Tissue-specific alternative first exon expression of Bcrp1 mRNA
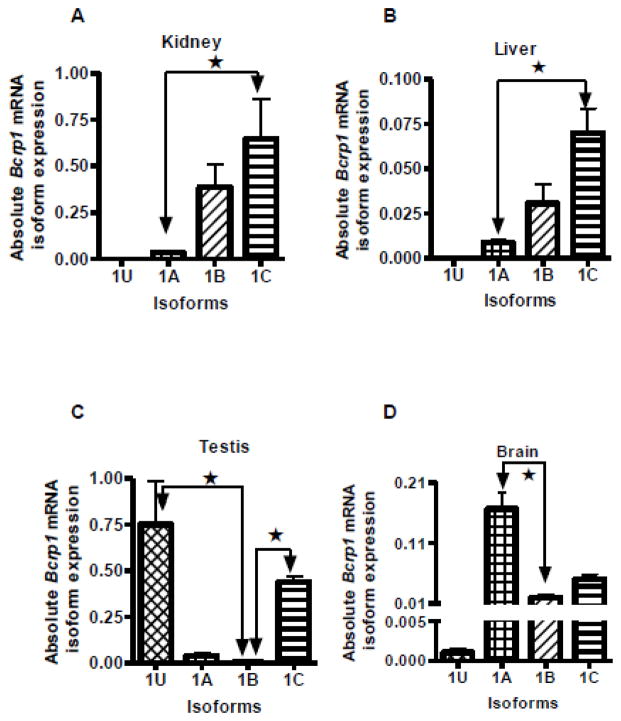
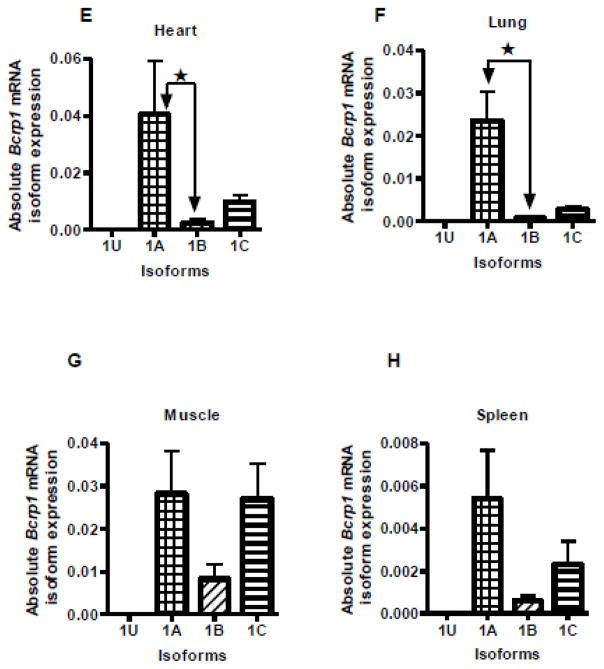
A quantitative real-time RT-PCR assay was used to identify the relative expression of the alternative Bcrp1 first exon transcripts in mouse kidney, liver, testis, brain, heart, lung, muscle and spleen of male FVB/NCr mice (Figure 3). In a previous study, we reported that the E1B Bcrp1 mRNA isoform predominated in the mouse intestine [13]; hence, data for mouse intestine are not shown here. Among the tissues currently studied, it appears that the E1B mRNA isoform is expressed to an intermediate extent in kidney and liver, and only to a minor extent in the other tissues studied. In C57BL6/J mice, E1B was the predominant mRNA isoform expressed in the kidney (supplemental Figure S3A). In FVB/NCr mice, E1A was the major isoform expressed in heart, lung and brain, whereas E1C was predominant in kidney and liver tissue. Muscle had comparable expression of both E1A and E1C Bcrp1 mRNA isoforms. It is of note that E1U expression was limited almost exclusively to testis; with the exception of a very low level of E1U transcripts in the brain (Figure 3D), levels of E1U transcripts in all other tissues were undetectable, including in our previous study of murine intestine [13]. In addition to E1U, FVB/NCr mouse testis also expressed significant amounts of E1C (Figure 3C). In contrast to FVB/NCr mice, testes from C57BL6/J mice expressed predominantly E1U (supplemental Figure S3B).
FIGURE 3.
Quantitative measurement of Bcrp1 mRNA with alternative untranslated first exons in male FVB/NCr mouse tissues. Significant (P<0.05) differences in alternative first exon mRNA expression in each tissue is denoted by ★, as determined by one-way analysis of variance with post hoc Dunn’s test. Data are expressed as copies of mRNA per microgram of reverse-transcribed cDNA. Data points represent the mean and standard deviation of determinations from 3 mice; each PCR assay was run in duplicate. A, B. Kidney and liver had significantly high expression of E1C compared to E1A but no statistically significant difference was found compared to E1B expression. C. E1U was expressed in the testis, and to a very small extent in brain, but in no other organs. Testis had significantly high expression of both 1U and 1C 5′ UTRs. D, E, and F. Brain, heart and lung had significantly higher expression of E1A than E1B. G, and H. Muscle and spleen did not exhibit any statistically significant differences in the expression of E1A, E1B, or E1C.
Using 5′ UTR-specific forward primers and a common reverse primer in the 3′ end of Bcrp1 mRNA (Table 1), full-length (2.1 kb) transcripts were identified for the E1U, E1A and E1C Bcrp1 mRNA isoforms in mouse testis. Sequencing of the 2.1 kb E1U Bcrp1 mRNA followed by BLAST analysis of the sequences against the reference Bcrp1 mRNA sequence in the NCBI nucleotide database established the E1U Bcrp1 mRNA to be a full-length Bcrp1 mRNA isoform. This sequence of the E1U Bcrp1 mRNA is available in GenBank (accession number KF662864).
3.4. Alternative Bcrp1 mRNA first exons expressed in mouse testis
To validate the in silico and qRT-PCR findings for alternative first exon usage in FVB/NCr mouse testis, 5′ RACE PCR studies were performed. 5′ RACE of FVB/NCr mouse testis followed by cloning and sequence analysis identified three different Bcrp1 leader exons expressed in this tissue (Figure 4). Two of these three were variants of E1U. Of the 16 PCR products that were cloned and sequenced, all first exons identified had a common splice acceptor site at the 5′ end of Bcrp1 Exon 2. Eleven clones had a splice donor site corresponding to E1U; 5 had a splice donor site corresponding to E1C; no clones were identified corresponding to E1A or E1B, consistent with the qRT-PCR findings in Figure 3C. The E1C leader exon was consistently 127 bp in length across all the five clones analyzed. On the other hand, the E1U isoforms were comprised of a variable upstream exon (E1U2) spliced to the 5′ end of a constant downstream exon (E1U1). The E1U1 exon was 85 bp in length in all the 11 E1U clones identified whereas the E1U2 exons were either 50 bp or 45 bp in length, and were located 440 bp and 402 bp upstream of the 5′ end of E1U1 respectively, with partially overlapping sequences (Figure 4). These Bcrp1 5′ RACE sequences are available in GenBank (accession numbers KF662865 – KF662878).
FIGURE 4.
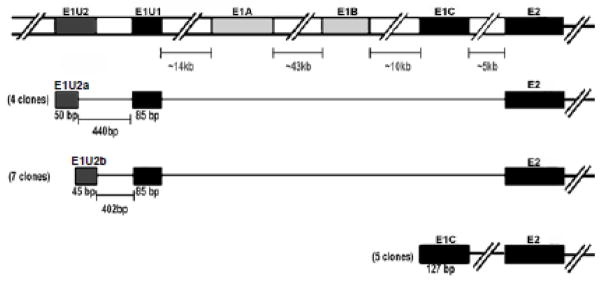
5′ RACE PCR analyses of the alternative Bcrp1 first exons expressed in the FVB/NCr mouse testis. Only the E1U and E1C Bcrp1 alternative first exons are expressed in FVB/NCr mouse testis, accounting for ~70% and ~30%, respectively, of the mRNA species expressed. E1U was not a single exon but two exons. A variable upstream exon designated as E1U2 was either 50 bps or 45 bps in length with their sequences overlapping at their 3′ and 5′ ends respectively. Both of these exons were ~400 bp upstream of a constant exon E1U1 spliced to Exon 2 of Bcrp1 mRNA. E1C in the mouse testis was 127 bp in length and was consistent in 5 different clones analyzed.
3.5. In silico evaluation of the E1U promoter of Bcrp1 identifies an SF-1 binding site
The Transcription Regulatory Regions Database (TRRD) program TRRD Site [29] was used to identify potential binding sites for transcription factors within the E1U core promoter region spanning −2000 to +1 bps upstream from E1U1 (Figure 5). An SF-1 binding site with a score of 0.96 (a score of 1.0 is maximum) was predicted at −566 bp to −557 bp upstream of the E1U1 region. TRRD did not predict an SF-1 binding site in the 1 kb regions upstream from E1A, E1B, E1C, or E2. The sequence of the SF-1 site in E1U is 5′ CAAGGTCATA-3′. A STAT1 binding site with a score of 0.98 was also predicted by the TRRD Site program at −28 bp to −14 bp upstream of the E1U1 region (Figure 5). Since SF-1 plays a critical role in development and regulation of the hypothalamic-pituitary-gonadal axis, we chose to focus on SF-1 and expression of Bcrp1 mRNA in the testis for the remainder of this work.
FIGURE 5.
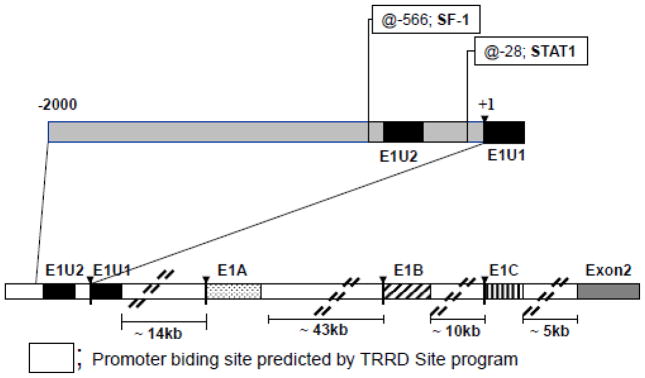
Prediction of trans factor binding sites in the E1U promoter region using the TRRD Site program – SF-1 and STAT1 sites are indicated.
3.6. SF-1 is expressed in mouse testis; low SF-1 expression found in TM4 murine Sertoli cells
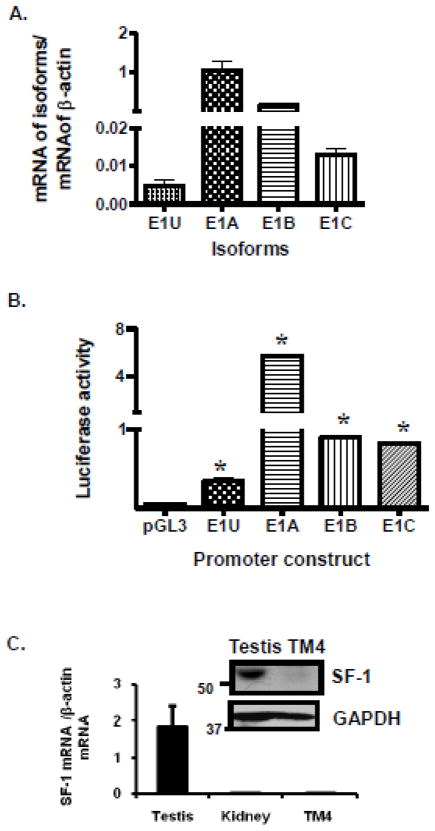
TM4 murine Sertoli cells were chosen to assess the functionality of the Bcrp1 E1U promoter because Sertoli cells comprise the blood-testis barrier, TM4 cells express functional Bcrp1 [33], and they grow in tissue culture, making them suitable for manipulations such as reporter assays. Furthermore, we found that TM4 cells express low but detectable levels of E1U mRNA (Figure 6A) and exhibit E1U promoter activity (Figure 6B), unlike a variety of other murine cell lines that we tested (data not shown). However, it should be kept in mind that previous reports indicate that TM4 cells do not retain Sertoli cell characteristics [34]. Unlike intact Sertoli cells, which express high levels of SF-1, relatively low expression of SF-1 mRNA has been reported in TM4 cells [35]. Our findings concur with this: SF-1 mRNA expression was found to be high in mouse testis but low in mouse kidney and in TM4 Sertoli cells (Figure 6C); similarly SF-1 protein expression was high in mouse testis but low in TM4 cells (inset, Figure 6C). Unlike murine testis tissue, TM4 cells expressed low levels of E1U or E1C mRNA (Figure 6A), and relatively high levels of E1A and E1B mRNA. Similarly, a reporter assay for the E1U promoter revealed low but measurable activity in TM4 cells; however, reporter assays for E1A, E1B, and E1C showed higher activity (Figure 6B). The high levels of E1A and E1B mRNA and promoter activity in TM4 compared to E1U may be because TM4 cells in culture may not be characteristic of the Sertoli or testicular cells from which they arose.
FIGURE 6.
TM4 cell characteristics. A. Quantitative measurement of Bcrp1 first exon expression in TM4 cells, relative to the expression of β-actin, using qPCR. B. Reporter assay of the activity of the E1U, E1A, E1B, and E1C promoters in TM4 cells. The data shown represent the mean and standard deviation of 3 different experiments, done on different days. Each individual assay was run in duplicate. The * indicate a significant difference from empty pGL3 vector control using the t-test (P<0.01). C. Expression of SF-1 mRNA relative to that of β-actin in C57BL6/J mouse testis and kidney, and in TM4 cells; Inset: Western blot showing SF-1 protein expression in mouse testis (C57BL6/J) and in TM4 cells. Results are typical of those obtained in 3 determinations, done on different days.
3.7. Upregulation of SF-1 enhances transcription by the E1U promoter
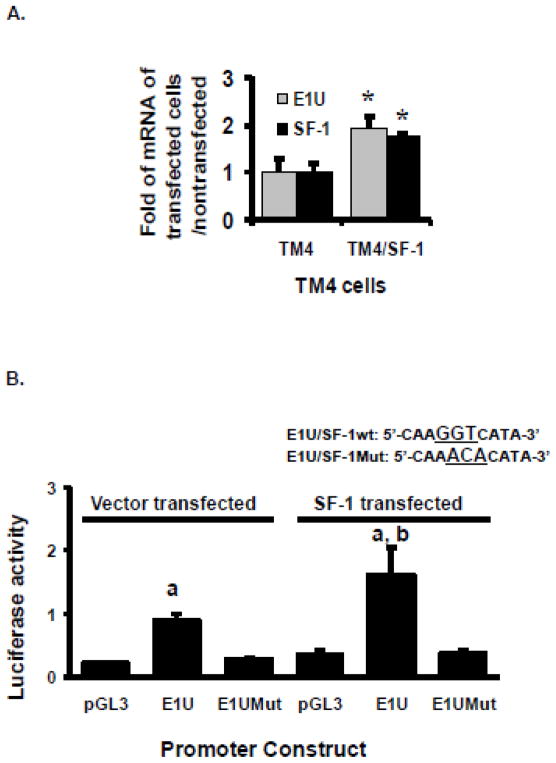
To investigate whether the low expression of Bcrp1 E1U mRNA and Bcrp1 E1U reporter construct activity in TM4 cells is due to low SF-1 expression, we enhanced the expression of SF-1 in TM4 cells by transfection, or by the use of a histone deacetylase inhibitor, as reported previously [14]. In the SF-1 transfected TM4/SF-1 cells, the expression of SF-1 and Bcrp1 E1U mRNA was approximately twice that observed in cells transfected with empty vector (Figure 7A). Similarly, the reporter activity of the E1U promoter construct was approximately two-fold higher in TM4/SF-1 cells compared to empty vector controls (P<0.05, t-test; Figure 7B). Introduction of three adjacent DNA base pair mutations in the putative SF-1 response element in the E1U promoter used in the reporter assay (underlined in Figure 7B) caused complete loss of E1U promoter activity in both vector control and SF-1 transfected cells (Figure 7B), supporting the notion that the CIS acting site identified is a functional SF-1 response element.
FIGURE 7.
Hyperexpression of SF-1 in TM4 cells transfected to overexpress SF-1. A. Expression of Bcrp1 E1U mRNA isoform and SF-1 mRNA in SF-1 transfected cells (TM4/SF-1) and in vector transfected control cells (TM4). The * indicate significantly (P<0.05) higher mRNA levels compared to the corresponding vector transfected control cells (TM4) using the t-test. B. E1U promoter activity in vector control and SF-1 transfected cells; effects of mutation of the SF-1 binding region in the promoter construct (E1UMut). Using the t-test, a statistically significant (P<0.05) difference compared to empty pGL3 vector control is denoted by a; A statistically significant (P<0.05) difference compared to the E1U promoter construct in vector transfected TM4 cells is denoted by b. The data shown represent the mean and standard deviation of 3 different experiments, done on different days. Each individual assay was run in duplicate.
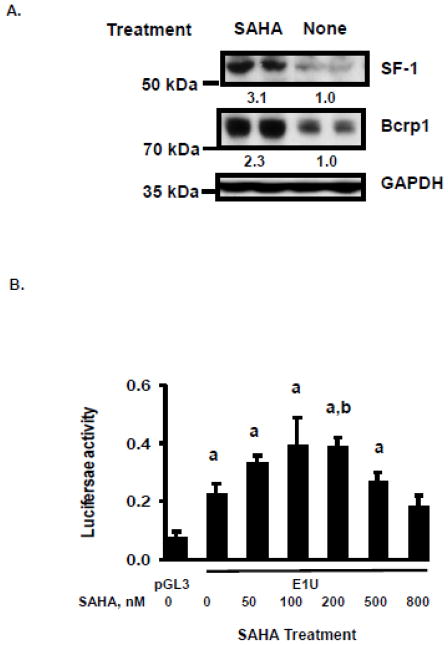
SF-1 protein was reported to be stabilized and its transactivation properties activated after the C-terminal lysine motifs are acetylated by coactivators with histone acetyltransferase (HAT) activity such as GCN5 [14] or the cAMP response element-binding protein (CREB) binding protein (p300/CBP) [36]; accordingly, cellular levels of SF-1 were found to increase following exposure to the histone deacetylase (HDAC) inhibitor trichostatin A [14]. We find that 48 hr exposure of TM4 cells to 200 nM of the HDAC inhibitor vorinostat results in approximately two-fold upregulation of Bcrp1 protein, and three-fold upregulation of SF-1 protein in these cells (Figure 8A). Furthermore, vorinostat caused a dose-dependent increase in E1U promoter activity at concentrations of up to 200 nM (Figure 8B). Higher concentrations caused diminution of promoter activity, possibly due to toxic effects of vorinostat. After subtraction of empty vector background, exposure to 200 nM vorinostat (24 hr) caused approximately a two-fold increase in E1U promoter activity in these cells (Figure 8B, C). Mutation of the SF-1 binding site in the E1U promoter abolished transcription of luciferase in the E1U promoter reporter assays, even after stimulation by vorinostat (Figure 8C). Finally, the expression of SF-1 mRNA, Bcrp1 E1U mRNA and Bcrp1 total mRNA all increased in TM4 cells after treatment with 200 nM vorinostat for 24 hr (Figure 8D).
FIGURE 8.
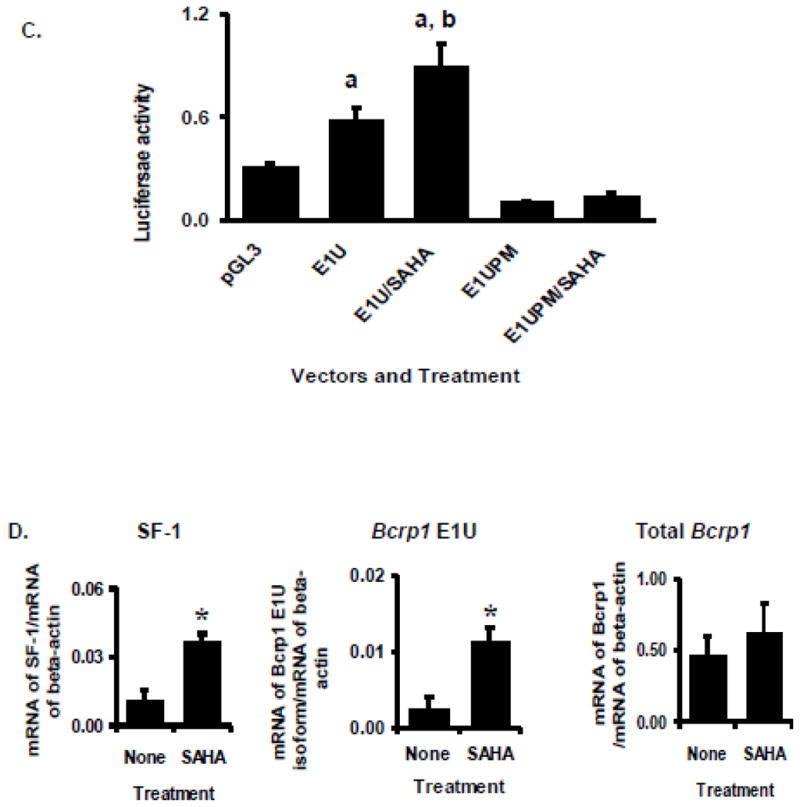
Hyperexpression of SF-1 in TM4 cells by exposure to vorinostat (SAHA). A. Western blot for SF-1, Bcrp1, and GAPDH following culture of TM4 cells with and without 200 nM vorinostat (SAHA) for 48 hours. Results are typical of those obtained in 3 determinations, done on different days. Quantification of band density for SF-1 and Bcrp1 following SAHA treatment relative to control is given as a numerical value below the lanes in Figure 8A. B. Luciferase reporter assays of the Bcrp1 E1U promoter construct in TM4 cells following 24-hour exposure to the indicated concentrations of vorinostat (SAHA). Using the t-test, a statistically significant (P<0.05) difference compared to empty pGL3 vector control is denoted by a; A statistically significant (P<0.05) difference E1U expression in vorinostat treated cells compared to E1U without vorinostat treatment is denoted by b. C. The increase in E1U promoter activity stimulated by vorinostat (200 nM, 24 hours) is abolished by mutation of the SF-1 binding site in the E1U promoter (E1UPM). Using the t-test, a statistically significant (P<0.05) difference compared to empty pGL3 vector control is denoted by a. A statistically significant (P<0.05) difference in E1U expression between vorinostat-treated and -untreated cells is denoted by b. D. Quantitative, real-time RT-PCR assays for SF-1, Bcrp1 E1u mRNA, and Bcrp1 total mRNA relative to expression of β-actin mRNA following exposure to 200 nM vorinostat (SAHA) for 24 h. The * indicates statistically significant greater amounts of mRNA and protein in the vorinostat-treated group compared to untreated group, P<0.05 (t-test). The data shown represent the mean and standard deviation of 3 different experiments, done on different days. Each individual assay was run in duplicate.
3.8. Sertoli cell-specific disruption of the SF-1 gene drastically reduces testicular expression of E1U and total Bcrp1 mRNA
To determine whether knockout of the SF-1 gene altered Bcrp1 expression in Sertoli cells, we utilized a conditional murine knockout system where SF-1 disruption was targeted specifically to Sertoli cells (AMH-Cre+/−, SF-1 Lox+/+ mice) and wild-type siblings (AMH-Cre+/−, SF-1 Lox+/−). The Sertoli cell-specific knockout animals form rudimentary testes, including seminiferous tubules (not yet published). In testes from the Sertoli cell-specific knockout animals, the expression of Bcrp1 E1U mRNA, total Bcrp1 mRNA, and SF-1 mRNA is markedly diminished compared to wild-type mice (P<0.001, <0.05, <0.05, respectively, t-test; Figure 9A). In contrast, the expression of β-actin mRNA in the testes of the knockout animals was equivalent to that of the wild-type siblings (Figure 9A).
FIGURE 9.
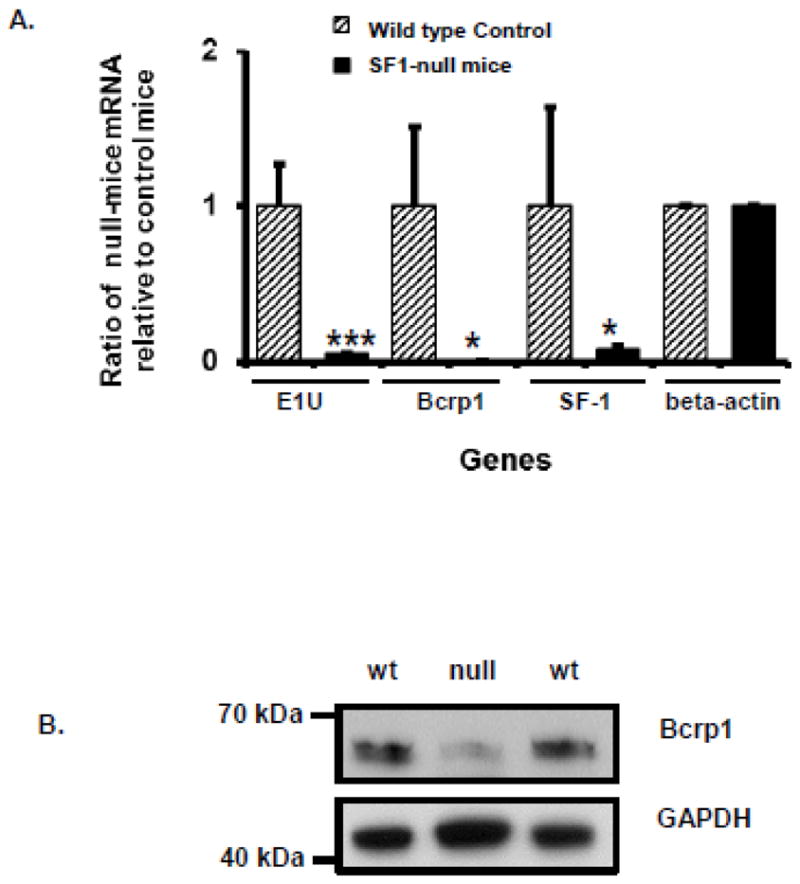
A. Expression of Bcrp1 E1U mRNA, total Bcrp1 mRNA, SF-1 mRNA, and β-actin mRNA in the testes of Sertoli cell-specific SF-1 knockout mice (AMH-Cre+/−, SF-1 Lox+/+), relative to the expression in wild-type mice (AMH-Cre+/−, SF-1 Lox+/−). For the wild-type mice, the mRNA expression relative to β-actin was (mean ± SD) 14.5±4.58 for Bcrp1 E1U mRNA, 10.55±6.34 for total Bcrp1 mRNA, and 16.81±12.05 for SF-1 mRNA. Using the t-test, significant (P<0.05) differences in mRNA expression are denoted by *; significant (P<0.001) differences in mRNA expression are denoted by ***. Data points represent the mean and standard deviation of determinations from 2 mice; each PCR assay was run in duplicate. B. Western blot of Bcrp1 protein expression in whole testes from Sertoli cell-specific SF-1 null mice (AMH-Cre+/−, SF-1 Lox+/+), and their wild-type (wt) littermates.
Similar to Bcrp1 mRNA, Bcrp1 protein expression in the knockout animals was much lower than in the wild-type siblings (Figure 9B). Interestingly, the molecular size of Bcrp1 protein in these testes is lower than the 72 kDa size expected for fully glycosylated Bcrp1, as expressed in TM4 cells. This finding is consistent with the molecular mass of Bcrp1 observed in a previous report of Bcrp1 expression in mouse spermatozoa, in which Bcrp1 was found to have functional efflux activity [37].
3.9. SF-1 binds directly to the SF-1 binding site in the Bcrp1 E1u promoter
Chromatin immunoprecipitation assays were performed for SF-1 using sperm-depleted extracts of mouse testis. Compared to isotype control, the anti-SF-1 antibody co-precipitated DNA that corresponded to the SF-1 response element in the Bcrp1 E1u promoter and, as a positive control, in the follicle-stimulating hormone receptor (FSHR) promoter, using PCR primers specific for these response elements (Figure 10).
FIGURE 10.
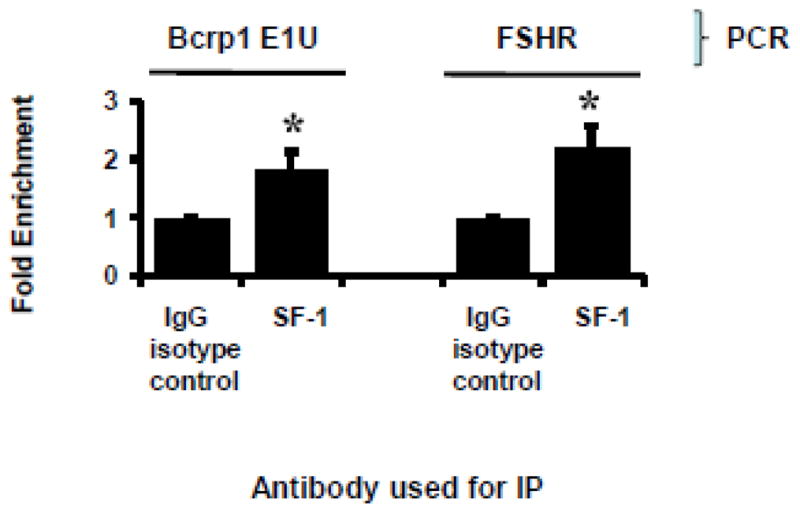
ChIP Assay for E1U and FSHR promoter SF-1 response elements in TM4/SF-1 cells. The results are expressed as fold-enrichment of immunoprecipitated (IP) SF-1-DNA relative to immunoprecipitated (IP) isotype control IgG-DNA after normalization for total DNA input. Shown is the mean and standard deviation of three independent experiments, done on different days. Each individual assay was run in duplicate. The * denotes P< 0.05 compared to IgG isotype control group, using the t-test.
4. Discussion
The present work expands understanding of the complex mechanisms that govern Bcrp1 transcription in the mouse, which involve tissue-specific, alternative promoter usage. It builds on the findings of our previous investigation which revealed that the alternative promoter regulating Bcrp1 expression in murine intestine, E1B, contained a functional cAMP response element unique to that promoter [13]. The present work identifies a novel upstream alternative Bcrp1 promoter, E1U, which is the predominant alternative promoter controlling Bcrp1 mRNA expression in murine testis. The E1U promoter contains a functional SF-1 response element that is not predicted to be present in any other Bcrp1 alternative promoter. We demonstrate that SF-1 binds to the predicted SF-1 response element in the E1U promoter using ChIP methodology; furthermore, we show that by increasing intracellular levels of SF-1 in TM4 cultured murine Sertoli cells using a variety of means, the level of Bcrp1 protein and the transcription of Bcrp1 E1U and total mRNA increases. Furthermore, in Sertoli cell-specific SF-1 knockout mice, testicular expression of total and E1U Bcrp1 mRNA and Bcrp1 protein is dramatically decreased, compared to wild-type animals. The E1U promoter also contains a putative STAT1 binding site, the significance and functionality of which remain to be established.
Our findings for total Bcrp1 mRNA expression in FVB/NCr and C57BL6/J mice are in agreement with those reported previously for 7 week old male C57BL6/J mice, which found the highest expression in kidney, and lesser but significant levels in testis, intestine, and liver [38]. Our findings for the size and tissue distribution of E1A, B, and C are in agreement with those previously reported by Zong et. al. [11]; however, our report of the E1U mRNA isoform is novel. The observations for 6-week old male FVB/NCr murine kidney, where the E1B and E1C mRNA isoforms were significantly expressed (Figure 3A), and for 6-week old male C57BL6/J mouse kidney where E1B was the predominant isoform expressed (supplemental Figure S2A) are concordant with that previously reported for 6-week old C57BL6/J female mice [11].
Because the translational start site of Bcrp1 is in exon 2, the leader exon variants reported here are entirely untranslated. Hence, the protein product of Bcrp1 mRNA transcribed from these alternative promoters is identical, since previous studies reveal that the exon 1 variants are part of a full-length Bcrp1 mRNA transcript [11, 13]. In this work, we report that the E1U Bcrp1 mRNA isoform is a full-length mRNA transcript.
When interpreting patterns of expression of the Bcrp1 mRNA isoforms in extracts from whole tissues, one must realize that the overall pattern may represent the mRNA isoforms of a variety of cell types that express Bcrp1 within that tissue. For example, mature Ter119+ murine erythroid cells were found to express predominantly the E1B Bcrp1 transcript [11]; hence, the presence of excessive amounts of blood in a tissue sample could possibly increase the proportion of E1B containing transcripts observed. With this in mind, it is important to note that our observations for alternative Bcrp1 mRNA expression (Figure 3, supplemental Figure S3) in the various murine organs and tissues examined represent the average Bcrp1 expression for all cell types within that tissue. Nevertheless, E1U was the predominant mRNA isoform expressed in FVB/NCr testis (Figure 3), and almost the only isoform expressed in C57BL6/J testis (supplemental Figure S3), suggesting that E1U is the major promoter governing Bcrp1 transcription among cell types within the testis. It is of note that the expression of the E1B Bcrp1 mRNA isoform was low in testis from each murine strain tested, suggesting there is minimal – if any – artifact in the mRNA isoform observations caused by red blood cells in the testis. Furthermore, the qRT-PCR findings for E1U and E1C Bcrp1 mRNA isoform expression in FVB/NCr mouse testis were validated by the frequency of recovery of these isoforms using 5′-RACE PCR (Figure 4).
Some differences in mRNA isoform expression were noted between mouse strains in this work. One cannot omit the possibility that the broad differences in genetic background as well as the acquired spontaneous mutations present in C57BL6/J mice and in the FVB/NCr mice might account for the strain-dependent differences observed in Bcrp1 mRNA isoform expression in the kidney and in the testis of the two strains of mice. Of note, the Ahr receptor, shown to regulate Bcrp1 E1B alternative promoter activity [39], is a truncated higher affinity receptor in C57BL6/J mice [40, 41] but a full-length lower affinity receptor in FVB/NCr mice, which in itself could account for the differences in E1B Bcrp1 isoform expression observed in the kidney of the two strains of mice. Hence, it is plausible to conclude that the differences in Bcrp1 mRNA isoform expression observed in the testis of the two strains of mice could be the result of hitherto undetermined mutations in transcription factors regulating BCRP expression in the testis.
In normal human testis, BCRP may serve to protect germinal cells from damage by potentially toxic xenobiotics since higher tissue/plasma ratios of Bcrp1 xenobiotic substrates were found in Bcrp1−/− mice compared to wild-type mice [9, 42]. This function is likely mediated at least in part by the blood-testes barrier, which is comprised mainly of Sertoli cells, along with myoid and endothelial cells, and a variety of efflux transporters expressed by these cells which include P-glycoprotein (MDR1, ABCB1) and the multidrug resistance-associated protein 1 (MRP1, ABCC1) [43]. Immunohistochemical analysis of testes with a monoclonal antibody to BCRP (BXP21) found BCRP expression in the myoid cell layer and in endothelium as well as in seminiferous tubules, but not in Sertoli or Leydig cells in humans [43]. A recent review suggests that Bcrp1 is not a part of the blood-testes barrier in rat testes, but rather is expressed in the apical portion of the Sertoli cell in the germ cell junction [44]. Another study found no expression of BCRP in cultured human Sertoli cells, but did find Bcrp1 expression and function in TM4 murine Sertoli cells [33]. The findings we report here using Sertoli cell-specific SF-1 knockout mice indicate that disruption of SF-1 signaling in murine Sertoli cells markedly reduces transcription of total and Bcrp1 E1U mRNA and Bcrp1 protein in whole testes (Figure 9A, B), supporting the notion that Bcrp1 is expressed in Sertoli cells under the control of SF-1.
SF-1 protein is acetylated in the C-terminal lysine motifs by co-activators with HAT activity such as GCN5 [14] or p300/CBP [36], resulting in stabilization of SF-1, enhanced transactivation properties, and an increase in SF-1 protein levels following exposure to the HDAC inhibitor trichostatin A [14]. We now report in TM4 murine cells that another HDAC inhibitor, vorinostat, can increase levels of SF-1 protein.
In a previous report, we showed that the murine Bcrp1 E1B promoter contains a functional cAMP response element (CRE) that binds to phospho-CREB, causing transactivation of Bcrp1 [13]. Although we could not predict a CRE in any of the other Bcrp1 promoters including E1U, it is possible that cAMP can enhance Bcrp1 expression in murine testis because cAMP can increase levels of p300, activate SF-1 and enhance its transcriptional activity by the cAMP-dependent protein kinase (PKA) signaling pathway [36, 45].
BCRP can also transport sterols and certain steroid hormones (e.g., dehydroepiandrosterone sulfate, estradiol-17β glucuronide, estrone 3-sulfate), thereby potentially playing a role in hormonal flux in the testis; BCRP expression was noted in side population (SP) stem cells isolated from testis [46], as is usually the case in SP cells isolated from other organs; BCRP and Bcrp1 expression was also found in spermatogonia, in later stages of spermatogenesis, and in mature spermatozoa of humans and mice, where it may function in removal of cholesterol [37].
TM4 cells were originally isolated from the testis of immature BALB/c mice [47]; they were characterized as Sertoli cells based on their growth response and increase in cAMP following treatment with follicle stimulating hormone, but not with luteinizing hormone [47], and by expression of GATA-4 [33]. Unlike intact testis, cultured TM4 cells express relatively low levels of SF-1 (Figure 6C). Furthermore, compared to E1U, TM4 cells express relatively greater amounts of the E1A and E1B Bcrp1 mRNA isoforms than do whole testis from C57BL6/J or FVB/NCr mice. This could reflect differences in alternative Bcrp1 promoter usage in whole testis compared to isolated Sertoli cells, to differences in Bcrp1 alternative promoter usage in the testis among mouse strains (C57BL6/J vs. FVB/NCr vs. BALB/c), or to alterations in promoter usage due to adaptation of the cells to culture in-vitro. Despite this, TM4 cells do possess measurable levels of Bcrp1 E1U mRNA, as well as demonstrable E1U promoter activity using a luciferase reporter assay (Figure 6A, B), which is in distinct contrast to other murine tissues we tested, and to cultured mouse small intestinal epithelial cells (MSIE, [13]). Upregulation of SF-1 protein expression in TM4 cells by transfection or by exposure to vorinostat resulted in an increase in Bcrp1 E1U mRNA expression, total Bcrp1 mRNA and Bcrp1 protein expression, and E1U promoter activity in the reporter assay (Figures 7 and 8). Knockout of SF-1 in Sertoli cells of mice resulted in marked diminution of total and E1U Bcrp1 mRNA expression (Figure 9A) and Bcrp1 protein expression (Figure 9B) in the testes. Mutation of the SF-1 binding site in the Bcrp1 E1U promoter abolished promoter activity (Figures 7B, 8C). Finally, binding of SF-1 to the putative binding site was demonstrated by ChIP assay (Figure 10). Collectively, these data strongly suggest that the SF-1 binding site identified in the E1U promoter is a functional SF-1 response element, and that Bcrp1 mRNA expression in murine testicular cells is predominantly via the E1U promoter, under the control of SF-1.
The present report adds Bcrp1 to the list of SF-1 responsive genes, but only Bcrp1 expressed in tissues such as the testis, driven by the novel E1U promoter. To date, we have identified Bcrp1 E1U mRNA expression mostly in the murine testis, with some expression in brain; however, the expression of the E1U isoform in other endocrine-relevant and steroid hormone-producing organs is completely unknown – this area is wide-open for exploration. High expression of BCRP/Bcrp1 in the placenta is well known in both humans [48] and mice [49]. BCRP/Bcrp1 expression is present in human and murine breast tissue [50]. It has been hypothesized that BCRP/Bcrp1 may play a role in steroid hormone regulation: a recent evaluation of the expression of Bcrp1 in endocrine organs of mice revealed, in addition to testis, high expression of mRNA in ovary, pancreas, epididymal and abdominal fat, and in the pituitary and adrenal (cortex) glands [51]. Future work should be directed towards examining the expression of the E1u/E1U mRNA isoform and the influence of SF-1 on BCRP/Bcrp1 expression in these organs and tissues (and cell types within these), and on how BCRP/Bcrp1 functions in these tissues.
The present work furthers our understanding of the mechanisms governing regulation of Bcrp1 (Abcg2) in different tissues of the mouse. We describe a novel promoter unique to testis (E1U), which is under the control of SF-1. Whether E1U drives Bcrp1 expression in other steroidogenic tissues such as ovary, placenta (organs in humans with relatively high BCRP mRNA expression [48]), VMNH, or adrenal gland awaits further investigation.
Supplementary Material
HIGHLIGHTS.
We report a novel murine Bcrp1 alternative promoter – E1U
E1U is the major alternative promoter governing Bcrp1 transcription in the testis
E1U contains a response element that binds to steroidogenic factor-1 (SF-1)
SF-1 upregulation increases E1U Bcrp1 mRNA expression and E1U promoter activity
Bcrp1 expression is decreased in Sertoli cell-specific SF-1−/− mouse testis
Abbreviations
- 5′UTR
5′ untranslated region
- TSS
transcriptional start site
- SF-1
steroidogenic factor 1
Footnotes
Publisher's Disclaimer: This is a PDF file of an unedited manuscript that has been accepted for publication. As a service to our customers we are providing this early version of the manuscript. The manuscript will undergo copyediting, typesetting, and review of the resulting proof before it is published in its final citable form. Please note that during the production process errors may be discovered which could affect the content, and all legal disclaimers that apply to the journal pertain.
References
- 1.Maliepaard M, Scheffer GL, Faneyte IF, van Gastelen MA, Pijnenborg AC, Schinkel AH, van De Vijver MJ, Scheper RJ, Schellens JH. Subcellular localization and distribution of the breast cancer resistance protein transporter in normal human tissues. Cancer Res. 2001;61:3458–3464. [PubMed] [Google Scholar]
- 2.Fetsch PA, Abati A, Litman T, Morisaki K, Honjo Y, Mittal K, Bates SE. Localization of the ABCG2 mitoxantrone resistance-associated protein in normal tissues. Cancer Lett. 2006;235:84–92. doi: 10.1016/j.canlet.2005.04.024. [DOI] [PubMed] [Google Scholar]
- 3.Cooray HC, Blackmore CG, Maskell L, Barrand MA. Localisation of breast cancer resistance protein in microvessel endothelium of human brain. Neuroreport. 2002;13:2059–2063. doi: 10.1097/00001756-200211150-00014. [DOI] [PubMed] [Google Scholar]
- 4.Kolwankar D, Glover DD, Ware JA, Tracy TS. Expression and function of ABCB1 and ABCG2 in human placental tissue. Drug Metab Dispos. 2005;33:524–529. doi: 10.1124/dmd.104.002261. [DOI] [PubMed] [Google Scholar]
- 5.Xiong H, Callaghan D, Jones A, Bai J, Rasquinha I, Smith C, Pei K, Walker D, Lue LF, Stanimirovic D, Zhang W. ABCG2 is upregulated in Alzheimer’s brain with cerebral amyloid angiopathy and may act as a gatekeeper at the blood-brain barrier for Abeta(1–40) peptides. J Neurosci. 2009;29:5463–5475. doi: 10.1523/JNEUROSCI.5103-08.2009. [DOI] [PMC free article] [PubMed] [Google Scholar]
- 6.Woodward OM, Köttgen A, Coresh J, Boerwinkle E, Guggino WB, Köttgen M. Identification of a urate transporter, ABCG2, with a common functional polymorphism causing gout. Proc Natl Acad Sci U S A. 2009;106:10338–10342. doi: 10.1073/pnas.0901249106. [DOI] [PMC free article] [PubMed] [Google Scholar]
- 7.Huls M, Brown CD, Windass AS, Sayer R, van den Heuvel JJ, Heemskerk S, Russel FG, Masereeuw R. The breast cancer resistance protein transporter ABCG2 is expressed in the human kidney proximal tubule apical membrane. Kidney Int. 2008;73:220–225. doi: 10.1038/sj.ki.5002645. [DOI] [PubMed] [Google Scholar]
- 8.Natarajan K, Xie Y, Baer MR, Ross DD. Role of breast cancer resistance protein (BCRP/ABCG2) in cancer drug resistance. Biochem Pharmacol. 2012;83:1084–1103. doi: 10.1016/j.bcp.2012.01.002. [DOI] [PMC free article] [PubMed] [Google Scholar]
- 9.Enokizono J, Kusuhara H, Ose A, Schinkel AH, Sugiyama Y. Quantitative investigation of the role of breast cancer resistance protein (Bcrp/Abcg2) in limiting brain and testis penetration of xenobiotic compounds. Drug Metab Dispos. 2008;36:995–1002. doi: 10.1124/dmd.107.019257. [DOI] [PubMed] [Google Scholar]
- 10.Nakanishi T, Bailey-Dell KJ, Hassel BA, Shiozawa K, Sullivan DM, Turner J, Ross DD. Novel 5′ untranslated region variants of BCRP mRNA are differentially expressed in drug-selected cancer cells and in normal human tissues: implications for drug resistance, tissue-specific expression, and alternative promoter usage. Cancer Res. 2006;66:5007–5011. doi: 10.1158/0008-5472.CAN-05-4572. [DOI] [PubMed] [Google Scholar]
- 11.Zong Y, Zhou S, Fatima S, Sorrentino BP. Expression of mouse Abcg2 mRNA during hematopoiesis is regulated by alternative use of multiple leader exons and promoters. J Biol Chem. 2006;281:29625–29632. doi: 10.1074/jbc.M606314200. [DOI] [PubMed] [Google Scholar]
- 12.Campbell PK, Zong Y, Yang S, Zhou S, Rubnitz JE, Sorrentino BP. Identification of a novel, tissue-specific ABCG2 promoter expressed in pediatric acute megakaryoblastic leukemia. Leuk Res. 2011;35:1321–1329. doi: 10.1016/j.leukres.2011.05.004. [DOI] [PMC free article] [PubMed] [Google Scholar]
- 13.Natarajan K, Xie Y, Nakanishi T, Beck WT, Bauer KS, Ross DD. Identification and characterization of the major alternative promoter regulating Bcrp1/Abcg2 expression in the mouse intestine. Biochim Biophys Acta. 2011;1809:295–305. doi: 10.1016/j.bbagrm.2011.06.004. [DOI] [PMC free article] [PubMed] [Google Scholar]
- 14.Jacob AL, Lund J, Martinez P, Hedin L. Acetylation of steroidogenic factor 1 protein regulates its transcriptional activity and recruits the coactivator GCN5. J Biol Chem. 2001;276:37659–37664. doi: 10.1074/jbc.M104427200. [DOI] [PubMed] [Google Scholar]
- 15.Ferraz-de-Souza B, Lin L, Achermann JC. Steroidogenic factor-1 (SF-1, NR5A1) and human disease. Molecular and cellular endocrinology. 2011;336:198–205. doi: 10.1016/j.mce.2010.11.006. [DOI] [PMC free article] [PubMed] [Google Scholar]
- 16.Lalli E, Doghman M, Latre de Late P, Wakil AE, Mus-Veteau I. Beyond steroidogenesis: Novel target genes for SF-1 discovered by genomics. Molecular and cellular endocrinology. 2013;371:145–149. doi: 10.1016/j.mce.2012.11.005. [DOI] [PubMed] [Google Scholar]
- 17.Heckert LL, Griswold MD. The expression of the follicle-stimulating hormone receptor in spermatogenesis. Recent progress in hormone research. 2002;57:129–148. doi: 10.1210/rp.57.1.129. [DOI] [PMC free article] [PubMed] [Google Scholar]
- 18.Zhao L, Bakke M, Krimkevich Y, Cushman LJ, Parlow AF, Camper SA, Parker KL. Steroidogenic factor 1 (SF1) is essential for pituitary gonadotrope function. Development. 2001;128:147–154. doi: 10.1242/dev.128.2.147. [DOI] [PubMed] [Google Scholar]
- 19.Jeyasuria P, Ikeda Y, Jamin SP, Zhao L, De Rooij DG, Themmen AP, Behringer RR, Parker KL. Cell-specific knockout of steroidogenic factor 1 reveals its essential roles in gonadal function. Molecular endocrinology. 2004;18:1610–1619. doi: 10.1210/me.2003-0404. [DOI] [PubMed] [Google Scholar]
- 20.Lecureuil C, Fontaine I, Crepieux P, Guillou F. Sertoli and granulosa cell-specific Cre recombinase activity in transgenic mice. Genesis. 2002;33:114–118. doi: 10.1002/gene.10100. [DOI] [PubMed] [Google Scholar]
- 21.Halees AS, Leyfer D, Weng Z. PromoSer: A large-scale mammalian promoter and transcription start site identification service. Nucleic Acids Res. 2003;31:3554–3559. doi: 10.1093/nar/gkg549. [DOI] [PMC free article] [PubMed] [Google Scholar]
- 22.Bajic VB, Seah SH, Chong A, Zhang G, Koh JL, Brusic V. Dragon Promoter Finder: recognition of vertebrate RNA polymerase II promoters. Bioinformatics. 2002;18:198–199. doi: 10.1093/bioinformatics/18.1.198. [DOI] [PubMed] [Google Scholar]
- 23.Bajic VB, Brusic V. Computational detection of vertebrate RNA polymerase II promoters. Methods Enzymol. 2003;370:237–250. doi: 10.1016/S0076-6879(03)70021-4. [DOI] [PubMed] [Google Scholar]
- 24.Bajic VB, Seah SH, Chong A, Krishnan SP, Koh JL, Brusic V. Computer model for recognition of functional transcription start sites in RNA polymerase II promoters of vertebrates. J Mol Graph Model. 2003;21:323–332. doi: 10.1016/s1093-3263(02)00179-1. [DOI] [PubMed] [Google Scholar]
- 25.Solovyev VV, Shahmuradov IA. PromH: Promoters identification using orthologous genomic sequences. Nucleic Acids Res. 2003;31:3540–3545. doi: 10.1093/nar/gkg525. [DOI] [PMC free article] [PubMed] [Google Scholar]
- 26.Prestridge DS. Predicting Pol II promoter sequences using transcription factor binding sites. J Mol Biol. 1995;249:923–932. doi: 10.1006/jmbi.1995.0349. [DOI] [PubMed] [Google Scholar]
- 27.Kamalakaran S, Radhakrishnan SK, Beck WT. Identification of estrogen-responsive genes using a genome-wide analysis of promoter elements for transcription factor binding sites. J Biol Chem. 2005;280:21491–21497. doi: 10.1074/jbc.M409176200. [DOI] [PubMed] [Google Scholar]
- 28.Levitski VG, Ignat’eva EV, Anan’ko EA, Merkulova TI, Kolchanov NA, Hodgman TC. Method SiteGA for the recognition of transcription factor binding sites. Biofizika. 2006;51:633–639. [PubMed] [Google Scholar]
- 29.Kolchanov NA, Ignatieva EV, Ananko EA, Podkolodnaya OA, Stepanenko IL, Merkulova TI, Pozdnyakov MA, Podkolodny NL, Naumochkin AN, Romashchenko AG. Transcription Regulatory Regions Database (TRRD): its status in 2002. Nucleic Acids Res. 2002;30:312–317. doi: 10.1093/nar/30.1.312. [DOI] [PMC free article] [PubMed] [Google Scholar]
- 30.(Version: NM_011920.2 GI:66932957, Build 35, Nucleotide database, National Center for Biotechnology Information (NCBI), National Library of Medicine)
- 31.(NT_039350.4, GI: 63544454, build 34 version 1, NCBIs genome annotation)
- 32.Levallet J, Koskimies P, Rahman N, Huhtaniemi I. The promoter of murine follicle-stimulating hormone receptor: functional characterization and regulation by transcription factor steroidogenic factor 1. Molecular endocrinology. 2001;15:80–92. doi: 10.1210/mend.15.1.0583. [DOI] [PubMed] [Google Scholar]
- 33.Robillard KR, Hoque T, Bendayan R. Expression of ATP-binding cassette membrane transporters in rodent and human sertoli cells: relevance to the permeability of antiretroviral therapy at the blood-testis barrier. J Pharmacol Exp Ther. 2012;340:96–108. doi: 10.1124/jpet.111.186916. [DOI] [PubMed] [Google Scholar]
- 34.Beverdam A, Wilhelm D, Koopman P. Molecular characterization of three gonad cell lines. Cytogenetic and genome research. 2003;101:242–249. doi: 10.1159/000074344. [DOI] [PubMed] [Google Scholar]
- 35.Pezzi V, Sirianni R, Chimento A, Maggiolini M, Bourguiba S, Delalande C, Carreau S, Andò S, Simpson ER, Clyne CD. Differential expression of steroidogenic factor-1/adrenal 4 binding protein and liver receptor homolog-1 (LRH-1)/fetoprotein transcription factor in the rat testis: LRH-1 as a potential regulator of testicular aromatase expression. Endocrinology. 2004;145:2186–2196. doi: 10.1210/en.2003-1366. [DOI] [PubMed] [Google Scholar]
- 36.Chen WY, Juan LJ, Chung BC. SF-1 (nuclear receptor 5A1) activity is activated by cyclic AMP via p300-mediated recruitment to active foci, acetylation, and increased DNA binding. Mol Cell Biol. 2005;25:10442–10453. doi: 10.1128/MCB.25.23.10442-10453.2005. [DOI] [PMC free article] [PubMed] [Google Scholar]
- 37.Scharenberg C, Mannowetz N, Robey RW, Brendel C, Repges P, Sahrhage T, Jahn T, Wennemuth G. ABCG2 is expressed in late spermatogenesis and is associated with the acrosome. Biochem Biophys Res Commun. 2009;378:302–307. doi: 10.1016/j.bbrc.2008.11.058. [DOI] [PubMed] [Google Scholar]
- 38.Tanaka Y, Slitt AL, Leazer TM, Maher JM, Klaassen CD. Tissue distribution and hormonal regulation of the breast cancer resistance protein (Bcrp/Abcg2) in rats and mice. Biochem Biophys Res Commun. 2005;326:181–187. doi: 10.1016/j.bbrc.2004.11.012. [DOI] [PubMed] [Google Scholar]
- 39.Tan KP, Wang B, Yang M, Boutros PC, Macaulay J, Xu H, Chuang AI, Kosuge K, Yamamoto M, Takahashi S, Wu AM, Ross DD, Harper PA, Ito S. Aryl hydrocarbon receptor is a transcriptional activator of the human breast cancer resistance protein (BCRP/ABCG2) Mol Pharmacol. 2010;78:175–185. doi: 10.1124/mol.110.065078. [DOI] [PubMed] [Google Scholar]
- 40.Holdt LM, Thiery J, Breslow JL, Teupser D. Increased ADAM17 mRNA expression and activity is associated with atherosclerosis resistance in LDL-receptor deficient mice. Arteriosclerosis, thrombosis, and vascular biology. 2008;28:1097–1103. doi: 10.1161/ATVBAHA.108.165654. [DOI] [PMC free article] [PubMed] [Google Scholar]
- 41.Shiao T, Tran P, Siegel D, Lee J, Vasiliou V. Four amino acid changes are associated with the Aldh3a1 locus polymorphism in mice which may be responsible for corneal sensitivity to ultraviolet light. Pharmacogenetics. 1999;9:145–153. [PubMed] [Google Scholar]
- 42.Kodaira H, Kusuhara H, Ushiki J, Fuse E, Sugiyama Y. Kinetic analysis of the cooperation of P-glycoprotein (P-gp/Abcb1) and breast cancer resistance protein (Bcrp/Abcg2) in limiting the brain and testis penetration of erlotinib, flavopiridol, and mitoxantrone. J Pharmacol Exp Ther. 2010;333:788–796. doi: 10.1124/jpet.109.162321. [DOI] [PubMed] [Google Scholar]
- 43.Bart J, Hollema H, Groen HJ, de Vries EG, Hendrikse NH, Sleijfer DT, Wegman TD, Vaalburg W, van der Graaf WT. The distribution of drug-efflux pumps, P-gp, BCRP, MRP1 and MRP2, in the normal blood-testis barrier and in primary testicular tumours. Eur J Cancer. 2004;40:2064–2070. doi: 10.1016/j.ejca.2004.05.010. [DOI] [PubMed] [Google Scholar]
- 44.Qian X, Cheng YH, Mruk DD, Cheng CY. Breast cancer resistance protein (Bcrp) and the testis-an unexpected turn of events. Asian Journal of Andrology. 2013:1–6. doi: 10.1038/aja.2013.24. [DOI] [PMC free article] [PubMed] [Google Scholar]
- 45.Jacob AL, Lund J. Mutations in the activation function-2 core domain of steroidogenic factor-1 dominantly suppresses PKA-dependent transactivation of the bovine CYP17 gene. J Biol Chem. 1998;273:13391–13394. doi: 10.1074/jbc.273.22.13391. [DOI] [PubMed] [Google Scholar]
- 46.Lassalle B, Bastos H, Louis JP, Riou L, Testart J, Dutrillaux B, Fouchet P, Allemand I. ‘Side Population’ cells in adult mouse testis express Bcrp1 gene and are enriched in spermatogonia and germinal stem cells. Development. 2004;131:479–487. doi: 10.1242/dev.00918. [DOI] [PubMed] [Google Scholar]
- 47.Mather JP. Establishment and characterization of two distinct mouse testicular epithelial cell lines. Biol Reprod. 1980;23:243–252. doi: 10.1095/biolreprod23.1.243. [DOI] [PubMed] [Google Scholar]
- 48.Doyle LA, Yang W, Abruzzo LV, Krogmann T, Gao Y, Rishi AK, Ross DD. A multidrug resistance transporter from human MCF-7 breast cancer cells. Proc Natl Acad Sci U S A. 1998;95:15665–15670. doi: 10.1073/pnas.95.26.15665. [DOI] [PMC free article] [PubMed] [Google Scholar]
- 49.Jonker JW, Smit JW, Brinkhuis RF, Maliepaard M, Beijnen JH, Schellens JH, Schinkel AH. Role of breast cancer resistance protein in the bioavailability and fetal penetration of topotecan. J Natl Cancer Inst. 2000;92:1651–1656. doi: 10.1093/jnci/92.20.1651. [DOI] [PubMed] [Google Scholar]
- 50.Jonker JW, Merino G, Musters S, van Herwaarden AE, Bolscher E, Wagenaar E, Mesman E, Dale TC, Schinkel AH. The breast cancer resistance protein BCRP (ABCG2) concentrates drugs and carcinogenic xenotoxins into milk. Nat Med. 2005;11:127–129. doi: 10.1038/nm1186. [DOI] [PubMed] [Google Scholar]
- 51.Dankers AC, Sweep FC, Pertijs JC, Verweij V, van den Heuvel JJ, Koenderink JB, Russel FG, Masereeuw R. Localization of breast cancer resistance protein (Bcrp) in endocrine organs and inhibition of its transport activity by steroid hormones. Cell and tissue research. 2012;349:551–563. doi: 10.1007/s00441-012-1417-5. [DOI] [PMC free article] [PubMed] [Google Scholar]
Associated Data
This section collects any data citations, data availability statements, or supplementary materials included in this article.


