

Abstract
Purpose
the Frailty Index (FI) is a popular operationalization of frailty. FI cut-off points have been proposed to define, regardless of age, frailty categories with increasing risk. Here, an alternative method is described that takes age into account.
Subjects and methods
29,905 participants aged ≥ 50 from the first wave of the Survey of Health, Ageing and Retirement in Europe. The mean follow-up for mortality was 2.4 years. Curve estimation procedures were carried out between age and a FI, and 50% Confidence Intervals (CI) for the regression mean were derived. As opposed to the usual method (FI ≤ 0.08: non-frail; FI ≥ 0.25: frail; rest: pre-frail), the alternative method defines as ‘fit for their age’ those with a FI below the lower 50% CI; ‘frail for their age’ those with a FI above the upper 50% CI; the rest as ‘average for their age’. Using both methods, the prevalence of the frailty categories and their associated mortality rates were compared for each age group.
Results
The best fit between age the FI was by cubic regression (R2 = 0.174, P < 0.001). Among those in their 50s, 5% were frail by the usual method (mortality: 5%) and 14% by the alternative (mortality: 2%). Among those in their 90s, 64% were frail by the usual method (mortality: 43%) and 41% by the alternative (mortality: 48%).
Conclusion
the alternative method may be more sensitive in younger ages and more specific in older ages. This may have implications for population screening.
Keywords: Frail Elderly, Severity of Illness Index, Longitudinal Study, Mortality, Validation studies
Introduction
Frailty in older adults is a state of vulnerability to poor resolution of homoeostasis after a stressor event and is a consequence of cumulative decline in many physiological systems during a lifetime (1). Although there is no international consensus on a definition of frailty (2, 3), two popular operationalizations are the Frailty Index (FI) and the frailty phenotype (4, 5).
According to the phenotypic approach, frailty is defined as a clinical syndrome consisting of unintentional weight loss, self-reported exhaustion, weakness, slow walking speed, and low physical activity (6, 7). Fried et al. operationalized these criteria in the Cardiovascular Health Study and defined three frailty categories: frail (i.e. three or more criteria present), pre-frail (i.e. one or two criteria present) and non-frail (i.e. none of the criteria present) (6).
The Frailty Index (FI) sees frailty in relation to the accumulation of health deficits. The FI is measured by comparing the ratio of health deficits present within an individual to possible health deficits, using a pre-specified list of 30 or more deficits (4). A deficit can be any symptom, sign, disease, disability, or laboratory abnormality that is associated with age and adverse outcomes, present in at least 1% of the population, covers several organ systems and has no more than 5% missing data (8). Age is not included as a deficit, but the FI increases exponentially with age (9).
While the construct validity of the FI is examined through its relationship to chronological age, its criterion validity is examined in its ability to predict adverse outcomes, including mortality (10). The latter has been the focus of many epidemiological studies (11–13).
Rockwood et al. have proposed FI cut-off points to define phenotypical population subgroups with increasing levels of frailty. For example, in one of their studies they proposed FI ≤ 0.08 as ‘non-frail’, FI ≥ 0.25 as ‘frail’, and the rest as ‘pre-frail’ (14). In another of their studies, they proposed FI ≤ 0.03 as ‘relatively fit’, 0.03 < FI ≤ 0.10 as ‘less fit’, 0.10 < FI ≤ 0.21 as ‘least fit’, 0.21 < FI ≤ 0.45 as ‘frail’, and FI ≥ 0.45 as ‘most frail’ (15). These cut-offs were proposed regardless of age; thus, for example, a 50 year-old and an 80 year-old with a FI = 0.4 would be, according to their scheme, equally frail. This is illustrated in Figure 2, Panel A.
Figure 2.

Visual representation of the usual (Panel A) and alternative (Panel B) FI cut-off methods. According to the usual method, those with FI ≤ 0.08 are non-frail, those with FI ≥ 0.25 are frail, and the rest are pre-frail. The alternative method defines as ‘fit for their age’ those with a FI below the lower 50% CI for the cubic regression, ‘frail for their age’ those with a FI above the upper 50% CI, and the rest as ‘average for their age’.
A potential problem with the usual FI cut-off method is that it does not take age into account, especially given the fact that the FI increases exponentially with age (9). In real clinical life, practitioners often operate within a framework of ‘fit for his/her age’ or ‘frail for his/her age’. For example, a FI of 0.1 measured in a 50 year-old could be, at that young age, regarded as unusually high and trigger aggressive interventions to delay the onset of adverse outcomes in that vulnerable young person. On the other hand, a nonagenarian with a FI of 0.1 could be regarded as fitter and more resilient than the majority of his/her peers at that age. Therefore, a FI of 0.1 may not mean the same to people of different ages.
The aim of the present paper was to explore the properties of an alternative method for FI cut-off points that takes into account age and the exponential association between age and the FI. This is a theoretical paper exemplified with real data from the Survey of Health, Ageing and Retirement in Europe (SHARE), a large longitudinal population-based survey.
Methods
Setting
The present study is based on the Survey of Health, Ageing and Retirement in Europe (SHARE, http://www.share-project.org/). SHARE is a multidisciplinary and cross-national panel database of micro data on health, socio-economic status and social and family networks. Based on probability samples in all participating countries, SHARE represents the non-institutionalised population aged 50 and older. Spouses were also interviewed if they were younger than 50 but here they were excluded from the analyses. The first wave data collection was carried out between 2004 and 2005.
FI
This study uses a previously validated 40-item FI based on the first wave of SHARE (16). Each of the 40 deficit variables was scored such that 0 = deficit absent and 1 = deficit present. The scores were added and divided by the total number of deficits evaluated (i.e. 40), to produce a FI between 0.0 (no deficits present) and 1.0 (all deficits present). For the full information on the FI deficit variables and cut-off points, please see the original validation study (16).
Mortality data (i.e. dead, alive or missing) was collected during the second wave of the study (2005 – 2006). The mean follow up period between wave 1 and wave 2 was 2.4 years.
Statistical analyses were conducted with IBM SPSS 20.0. Automatic curve estimation procedures were used to assess the relative fit of non-linear (i.e. quadratic, cubic) regression models. For the best fitting regression model, predicted values and 50% prediction intervals (upper and lower bounds) were saved.
The alternative cut-off method defines as ‘fit for their age’ those with a FI below the lower 50% CI for the regression. ‘Frail for their age’ are those with FI above the upper 50% CI. The rest are ‘average for their age’. To compare the usual (≤ 0.08 as ‘non-frail’, FI ≥ 0.25 as ‘frail’, and the rest as ‘pre-frail’) and the alternative method, the sample was divided into age categories (i.e. 50s, 60s, 70s, 80s and 90+) and for each age category, the prevalence and the associated mortality rate of the frailty categories were compared.
Results
The first wave of SHARE included 29,905 participants aged 50+ from 12 countries (Austria, Germany, Sweden, Netherlands, Spain, Italy, France, Denmark, Greece, Switzerland, Belgium, and Israel). Overall, the mean (standard deviation: SD) age was 64.6 (10.1) years, and 54.2% were females.
The results of the curve estimation procedure are shown in Figure 1. The best fit between age and the FI was shown by the cubic model (R2 = 0.174, P < 0.001). As per cubic regression, the mean FI (50% CI) was 0.08 (0.01 – 0.16) for those aged 50; 0.10 (0.03 – 0.17) for those aged 60; 0.14 (0.07 – 0.22) for those aged 70; 0.21 (0.13 – 0.28) for those aged 80; 0.30 (0.23 – 0.38) for those aged 90; and 0.43 (0.36 – 0.51) for those aged 100. The Appendix 1 shows the predicted FI values (with 50% CIs) for all ages. Figure 2 (Panel B) visually shows the alternative cut-off approach. Those with a FI below the lower 50% CI for the cubic regression are ‘fit for their age’. Those with a FI above the upper 50% CI are ‘frail for their age’. The rest are ‘average for their age’.
Figure 1.
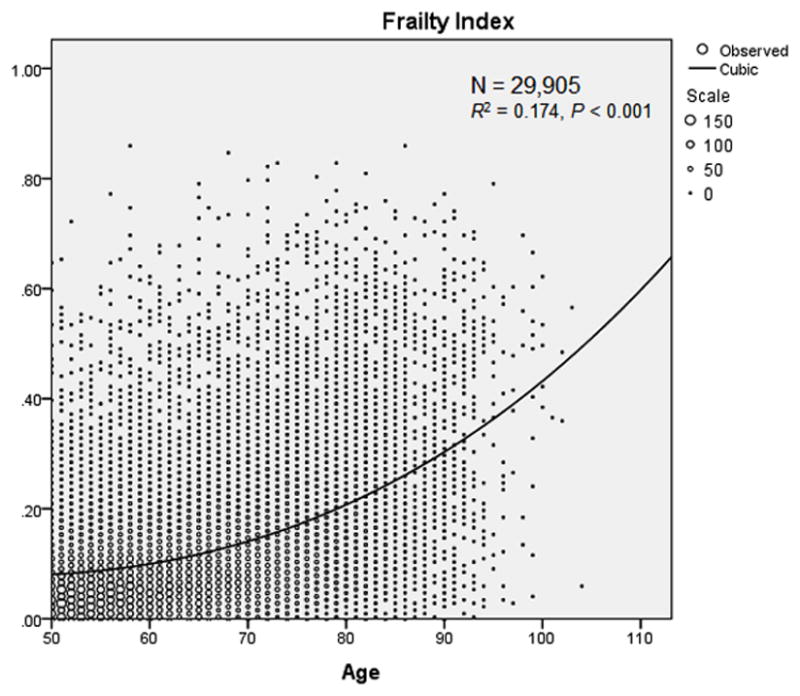
Cubic regression between age and the FI.
- A = 6.102*10−7
- B = 0
- C = −0.004
- D = 0.187
Appendix 1.
Predicted FI values (with 50% CIs) according to the cubic model (all ages).
| Age | Predicted FI value | Lower 50% CI | Upper 50% CI |
|---|---|---|---|
| 50 | 0.08 | 0.01 | 0.16 |
| 51 | 0.08 | 0.01 | 0.16 |
| 52 | 0.08 | 0.01 | 0.16 |
| 53 | 0.08 | 0.01 | 0.16 |
| 54 | 0.09 | 0.01 | 0.16 |
| 55 | 0.09 | 0.01 | 0.16 |
| 56 | 0.09 | 0.02 | 0.16 |
| 57 | 0.09 | 0.02 | 0.17 |
| 58 | 0.09 | 0.02 | 0.17 |
| 59 | 0.10 | 0.02 | 0.17 |
| 60 | 0.10 | 0.03 | 0.17 |
| 61 | 0.10 | 0.03 | 0.18 |
| 62 | 0.11 | 0.03 | 0.18 |
| 63 | 0.11 | 0.04 | 0.18 |
| 64 | 0.11 | 0.04 | 0.19 |
| 65 | 0.12 | 0.04 | 0.19 |
| 66 | 0.12 | 0.05 | 0.20 |
| 67 | 0.13 | 0.05 | 0.20 |
| 68 | 0.13 | 0.06 | 0.20 |
| 69 | 0.14 | 0.06 | 0.21 |
| 70 | 0.14 | 0.07 | 0.22 |
| 71 | 0.15 | 0.07 | 0.22 |
| 72 | 0.15 | 0.08 | 0.23 |
| 73 | 0.16 | 0.08 | 0.23 |
| 74 | 0.16 | 0.09 | 0.24 |
| 75 | 0.17 | 0.10 | 0.24 |
| 76 | 0.18 | 0.10 | 0.25 |
| 77 | 0.18 | 0.11 | 0.26 |
| 78 | 0.19 | 0.12 | 0.27 |
| 79 | 0.20 | 0.12 | 0.27 |
| 80 | 0.21 | 0.13 | 0.28 |
| 81 | 0.22 | 0.14 | 0.29 |
| 82 | 0.22 | 0.15 | 0.30 |
| 83 | 0.23 | 0.16 | 0.31 |
| 84 | 0.24 | 0.17 | 0.32 |
| 85 | 0.25 | 0.18 | 0.33 |
| 86 | 0.26 | 0.19 | 0.34 |
| 87 | 0.27 | 0.20 | 0.35 |
| 88 | 0.28 | 0.21 | 0.36 |
| 89 | 0.29 | 0.22 | 0.37 |
| 90 | 0.30 | 0.23 | 0.38 |
| 91 | 0.31 | 0.24 | 0.39 |
| 92 | 0.33 | 0.25 | 0.40 |
| 93 | 0.34 | 0.26 | 0.41 |
| 94 | 0.35 | 0.28 | 0.43 |
| 95 | 0.36 | 0.29 | 0.44 |
| 96 | 0.38 | 0.30 | 0.45 |
| 97 | 0.39 | 0.32 | 0.46 |
| 98 | 0.40 | 0.33 | 0.48 |
| 99 | 0.42 | 0.34 | 0.49 |
| 100 | 0.43 | 0.36 | 0.51 |
Table 1 shows the sizes and mortality rates of the sample subgroups. Among those in their 50s, 5% were frail by the usual method (mortality: 5%) and 14% by the alternative (mortality: 2%). Among those in their 60s, 8% were frail by the usual method (mortality: 5%) and 15% by the alternative (mortality: 5%). Among those in their 70s, 19% were frail by the usual method (mortality: 12%) and 19% by the alternative (mortality: 11%). Among those in their 80s, 37% were frail by the usual method (mortality: 19%) and 26% by the alternative (mortality: 21%). Among those in their 90s, 64% were frail by the usual method (mortality: 43%) and 41% by the alternative (mortality: 48%).
Table 1.
Comparison between the usual and the alternative cut-off methods: prevalence and associated mortality rate of the frailty categories.
| Age group | Usual cut-off | N | N% | N dead | Dead % | Alternative cut-off | N | N% | N dead | Dead % |
|---|---|---|---|---|---|---|---|---|---|---|
| 50–59 | Non-frail | 4177 | 57 | 18 | 0.4 | below 50% CI | 903 | 12 | 1 | 0.1 |
| Pre-frail | 2814 | 38 | 24 | 0.9 | within 50% CI | 5445 | 74 | 33 | 0.6 | |
| Frail | 359 | 5 | 16 | 4.5 | above 50% CI | 1002 | 14 | 24 | 2.4 | |
| 60–69 | Non-frail | 2873 | 45 | 26 | 0.9 | below 50% CI | 1402 | 22 | 10 | 0.7 |
| Pre-frail | 3015 | 47 | 68 | 2.3 | within 50% CI | 4037 | 63 | 66 | 1.6 | |
| Frail | 527 | 8 | 28 | 5.3 | above 50% CI | 976 | 15 | 46 | 4.7 | |
| 70–79 | Non-frail | 1261 | 30 | 19 | 1.5 | below 50% CI | 1475 | 35 | 25 | 1.7 |
| Pre-frail | 2212 | 52 | 87 | 3.9 | within 50% CI | 1978 | 46 | 82 | 4.1 | |
| Frail | 798 | 19 | 94 | 11.8 | above 50% CI | 818 | 19 | 93 | 11.4 | |
| 80–89 | Non-frail | 240 | 16 | 10 | 4.2 | below 50% CI | 621 | 40 | 37 | 6.0 |
| Pre-frail | 730 | 47 | 59 | 8.1 | within 50% CI | 525 | 34 | 61 | 11.6 | |
| Frail | 575 | 37 | 111 | 19.3 | above 50% CI | 399 | 26 | 82 | 20.6 | |
| 90+ | Non-frail | 19 | 9 | 1 | 5.3 | below 50% CI | 76 | 37 | 10 | 13.2 |
| Pre-frail | 56 | 27 | 10 | 17.9 | within 50% CI | 46 | 22 | 17 | 37.0 | |
| Frail | 133 | 64 | 57 | 42.9 | above 50% CI | 86 | 41 | 41 | 47.7 |
Discussion
The aim of the present study was to explore the properties of an alternative method for FI cutoff points that takes into account age and the known exponential association between age and the FI. According to the usual method, those with FI ≤ 0.08 were ‘non-frail’, those with FI ≥ 0.25 ‘frail’, and the rest ‘pre-frail’. The alternative method defined as ‘fit for their age’ those with a FI below the lower 50% CI for the cubic regression, ‘frail for their age’ those with a FI above the upper 50% CI, and the rest as ‘average for their age’. Naturally, the scheme chosen here to illustrate the usual (i.e. age-independent) cut-off method is one of the many proposed (14, 15). On the other hand, the 50% choice for the regression CI was arbitrary, although visually it seems reasonable vis-à-vis the usual method (Figure 2). The results of the exercise suggest that, for the purpose of frailty screening, the alternative (i.e. age-specific) method may have higher sensitivity in younger groups and higher specificity in older groups.
Age-specific cut-off points have been previously proposed for population screening purposes. For example, the serum prostate-specific antigen (PSA, a marker of prostate cancer in men) is directly associated with age, so rather than rely on a single reference range for men of all age groups, age-specific reference ranges have been proposed which have the potential to make the test a more discriminating marker for detecting clinically significant disease in the old (i.e. increasing specificity) and to find more potentially curable disease in the young (i.e. increasing sensitivity) (17). In that light, the use of age-specific PSA reference ranges has been widely welcome (18–22). However, some have argued that the use of age-specific PSA ranges runs the risk of missing clinically significant cancers in older men and augmenting the rate of unnecessary invasive procedures (and potential complications) in younger men (23). In frailty screening, similar risks could apply.
Population screening does not exist without dilemmas and the trade-off between benefit and harm is crucial in health screening recommendations (24), in which a delicate balance exists between the benefit for the population and the benefit for the individual (25). Furthermore, in addition to the ethical precepts of autonomy, nonmaleficence, and equity (26), population screening in areas of geriatric relevance must avoid age discrimination (27). Indeed, although the association between age and the FI is statistically significant, the variance explained by age is small, owing to the fact that at a population level the association between chronological age and health status is extremely variable (28). The FI addresses the cumulative deficits in health leading to adverse outcomes, regardless of age. Age was not included as a deficit in the FI presented in this manuscript, but it is known that the FI increases exponentially with age (9). Therefore, given the known association between age and the FI, the question is whether cutting off the FI into ‘phenotypical’ categories should take age into account or not.
Based on SHARE, the frailty phenotype has been previously operationalized using modified Fried’s criteria (29). The operationalization of frailty by modified Fried’s criteria in SHARE did not establish age-specific cut-offs for the definition of frailty, so the alternative cut-off system exemplified here using the FI can also be applied to Fried’s approach. Indeed, the modified Fried phenotypes in SHARE were also associated with age (29).
Potentially, an age-specific screening approach may facilitate the prevention of frailty in the longer term. This is so because when frailty is identified via screening in an individual, the next step should be the provision of a Comprehensive Geriatric Assessment (CGA) to the individual to establish the causes and potential interventions to avoid or delay the onset of adverse outcomes. It has been said that because of greater risk of death than for the non-frail state and greater likelihood of regression than for the frail state, the pre-frail state may be an optimal target for intervention (30). Therefore, it is possible that lowering the threshold for CGA at younger ages (i.e. considering a greater number of younger people as pre-frail) may offer more opportunities for long-term prevention (i.e. and in turn reduce the prevalence of frailty in older ages). However, the value of doing this is not yet proven.
At present, it is not clear whether the use of age-specific reference ranges for the phenotypic diagnosis of frailty could be more appropriate than the usual cut-off approach for population screening purposes. This theoretical paper will stimulate debate and further research in the area.
Acknowledgments
This paper uses data from SHARE release 2.3.0, as of November 13th 2009. The SHARE data collection has been primarily funded by the European Commission through the 5th framework programme (project QLK6-CT-2001- 00360 in the thematic programme Quality of Life), through the 6th framework programme (projects SHARE-I3, RII-CT- 2006-062193, COMPARE, CIT5-CT-2005-028857, and SHARELIFE, CIT4-CT-2006-028812) and through the 7th framework programme (SHARE-PREP, 211909 and SHARE-LEAP, 227822). Additional funding from the U.S. National Institute on Aging (U01 AG09740-13S2, P01 AG005842, P01 AG08291, P30 AG12815, Y1-AG-4553-01 and OGHA 04-064, IAG BSR06-11, R21 AG025169) as well as from various national sources is gratefully acknowledged (see www.share-project.org for a full list of funding institutions).
Footnotes
Disclosure
The author has no conflict of interest.
References
- 1.Clegg A, Young J, Iliffe S, Rikkert MO, Rockwood K. Frailty in elderly people. Lancet. 2013 Mar 2;381(9868):752–62. doi: 10.1016/S0140-6736(12)62167-9. [DOI] [PMC free article] [PubMed] [Google Scholar]
- 2.Rodriguez-Manas L, Feart C, Mann G, Vina J, Chatterji S, Chodzko-Zajko W, et al. Searching for an operational definition of frailty: a Delphi method based consensus statement: the frailty operative definition-consensus conference project. The journals of gerontology Series A, Biological sciences and medical sciences. 2013 Jan;68(1):62–7. doi: 10.1093/gerona/gls119. [DOI] [PMC free article] [PubMed] [Google Scholar]
- 3.Conroy S. Defining frailty--the Holy Grail of geriatric medicine. J Nutr Health Aging. 2009 Apr;13(4):389. doi: 10.1007/s12603-009-0050-9. Epub 2009/03/21. eng. [DOI] [PubMed] [Google Scholar]
- 4.Moorhouse P, Rockwood K. Frailty and its quantitative clinical evaluation. The journal of the Royal College of Physicians of Edinburgh. 2012;42(4):333–40. doi: 10.4997/JRCPE.2012.412. [DOI] [PubMed] [Google Scholar]
- 5.Abellan van Kan G, Rolland Y, Houles M, Gillette-Guyonnet S, Soto M, Vellas B. The assessment of frailty in older adults. Clinics in geriatric medicine. 2010 May;26(2):275–86. doi: 10.1016/j.cger.2010.02.002. [DOI] [PubMed] [Google Scholar]
- 6.Fried LP, Tangen CM, Walston J, Newman AB, Hirsch C, Gottdiener J, et al. Frailty in older adults: evidence for a phenotype. The journals of gerontology Series A, Biological sciences and medical sciences. 2001 Mar;56(3):M146–56. doi: 10.1093/gerona/56.3.m146. [DOI] [PubMed] [Google Scholar]
- 7.Xue QL. The frailty syndrome: definition and natural history. Clin Geriatr Med. 2011 Feb;27(1):1–15. doi: 10.1016/j.cger.2010.08.009. [DOI] [PMC free article] [PubMed] [Google Scholar]
- 8.Theou O, Brothers TD, Rockwood MR, Haardt D, Mitnitski A, Rockwood K. Exploring the relationship between national economic indicators and relative fitness and frailty in middle-aged and older Europeans. Age and ageing. 2013 Feb 25; doi: 10.1093/ageing/aft010. [DOI] [PMC free article] [PubMed] [Google Scholar]
- 9.Rockwood K, Mogilner A, Mitnitski A. Changes with age in the distribution of a frailty index. Mechanisms of ageing and development. 2004 Jul;125(7):517–9. doi: 10.1016/j.mad.2004.05.003. [DOI] [PubMed] [Google Scholar]
- 10.Mitnitski AB, Graham JE, Mogilner AJ, Rockwood K. Frailty, fitness and late-life mortality in relation to chronological and biological age. BMC geriatrics. 2002 Feb 27;2:1. doi: 10.1186/1471-2318-2-1. [DOI] [PMC free article] [PubMed] [Google Scholar]
- 11.Fang X, Shi J, Song X, Mitnitski A, Tang Z, Wang C, et al. Frailty in relation to the risk of falls, fractures, and mortality in older Chinese adults: results from the Beijing Longitudinal Study of Aging. The journal of nutrition, health & aging. 2012 Oct;16(10):903–7. doi: 10.1007/s12603-012-0368-6. [DOI] [PubMed] [Google Scholar]
- 12.Garcia-Gonzalez JJ, Garcia-Pena C, Franco-Marina F, Gutierrez-Robledo LM. A frailty index to predict the mortality risk in a population of senior Mexican adults. BMC geriatrics. 2009;9:47. doi: 10.1186/1471-2318-9-47. [DOI] [PMC free article] [PubMed] [Google Scholar]
- 13.Mitnitski A, Song X, Skoog I, Broe GA, Cox JL, Grunfeld E, et al. Relative fitness and frailty of elderly men and women in developed countries and their relationship with mortality. Journal of the American Geriatrics Society. 2005 Dec;53(12):2184–9. doi: 10.1111/j.1532-5415.2005.00506.x. [DOI] [PubMed] [Google Scholar]
- 14.Song X, Mitnitski A, Rockwood K. Prevalence and 10-year outcomes of frailty in older adults in relation to deficit accumulation. J Am Geriatr Soc. Apr;58(4):681–7. doi: 10.1111/j.1532-5415.2010.02764.x. Epub 2010/03/30. eng. [DOI] [PubMed] [Google Scholar]
- 15.Rockwood K, Song X, Mitnitski A. Changes in relative fitness and frailty across the adult lifespan: evidence from the Canadian National Population Health Survey. CMAJ. May 17;183(8):E487–94. doi: 10.1503/cmaj.101271. Epub 2011/05/05.eng. [DOI] [PMC free article] [PubMed] [Google Scholar]
- 16.Romero-Ortuno R, Kenny RA. The frailty index in Europeans: association with age and mortality. Age and ageing. 2012 Sep;41(5):684–9. doi: 10.1093/ageing/afs051. [DOI] [PMC free article] [PubMed] [Google Scholar]
- 17.Oesterling JE, Jacobsen SJ, Chute CG, Guess HA, Girman CJ, Panser LA, et al. Serum prostate-specific antigen in a community-based population of healthy men. Establishment of age-specific reference ranges. JAMA. 1993 Aug 18;270(7):860–4. [PubMed] [Google Scholar]
- 18.Lankford SP, Peters KL, Elser RC. Potential effects of age-specific reference ranges for serum prostate-specific antigen. Eur Urol. 1995;27(3):182–6. doi: 10.1159/000475157. [DOI] [PubMed] [Google Scholar]
- 19.Oesterling JE, Jacobsen SJ, Cooner WH. The use of age-specific reference ranges for serum prostate specific antigen in men 60 years old or older. J Urol. 1995 Apr;153(4):1160–3. [PubMed] [Google Scholar]
- 20.Richardson TD, Oesterling JE. Age-specific reference ranges for serum prostate-specific antigen. Urol Clin North Am. 1997 May;24(2):339–51. doi: 10.1016/s0094-0143(05)70381-5. [DOI] [PubMed] [Google Scholar]
- 21.Kalish LA, McKinlay JB. Serum prostate-specific antigen levels (PSA) in men without clinical evidence of prostate cancer: age-specific reference ranges for total PSA, free PSA, and percent free PSA. Urology. 1999 Dec;54(6):1022–7. doi: 10.1016/s0090-4295(99)00349-0. [DOI] [PubMed] [Google Scholar]
- 22.Oesterling JE. Age-specific reference ranges for serum PSA. N Engl J Med. 1996 Aug 1;335(5):345–6. doi: 10.1056/NEJM199608013350511. [DOI] [PubMed] [Google Scholar]
- 23.Luboldt HJ, Schindler JF, Rubben H. Age-Specific Reference Ranges for Prostate-Specific Antigen as a Marker for Prostate Cancer. EAU-EBU update series. 2007:38–48. Available online: http://eu-acmeorg/europeanurology/upload_articles/Agepdf.
- 24.Dans LF, Silvestre MA, Dans AL. Trade-off between benefit and harm is crucial in health screening recommendations. Part I: general principles. J Clin Epidemiol. 2011 Mar;64(3):231–9. doi: 10.1016/j.jclinepi.2010.09.009. [DOI] [PubMed] [Google Scholar]
- 25.Hense HW. The trade-off between population and individual benefit of screening. Z Arztl Fortbild Qualitatssich. 2006;100(7):505–13. [PubMed] [Google Scholar]
- 26.Silvestre MA, Dans LF, Dans AL. Trade-off between benefit and harm is crucial in health screening recommendations. Part II: evidence summaries. J Clin Epidemiol. 2011 Mar;64(3):240–9. doi: 10.1016/j.jclinepi.2010.09.008. [DOI] [PubMed] [Google Scholar]
- 27.Romero-Ortuno R, O’Shea D. Fitness and frailty: opposite ends of a challenging continuum! Will the end of age discrimination make frailty assessments an imperative? Age and ageing. 2013 Jan 24; doi: 10.1093/ageing/afs189. [DOI] [PubMed] [Google Scholar]
- 28.Lloyd-Sherlock P, McKee M, Ebrahim S, Gorman M, Greengross S, Prince M, et al. Population ageing and health. Lancet. 2012 Apr 7;379(9823):1295–6. doi: 10.1016/S0140-6736(12)60519-4. [DOI] [PubMed] [Google Scholar]
- 29.Romero-Ortuno R, Walsh CD, Lawlor BA, Kenny RA. A frailty instrument for primary care: findings from the Survey of Health, Ageing and Retirement in Europe (SHARE) BMC geriatrics. 2010;10:57. doi: 10.1186/1471-2318-10-57. [DOI] [PMC free article] [PubMed] [Google Scholar]
- 30.Espinoza SE, Jung I, Hazuda H. Frailty transitions in the San Antonio Longitudinal Study of Aging. Journal of the American Geriatrics Society. 2012 Apr;60(4):652–60. doi: 10.1111/j.1532-5415.2011.03882.x. [DOI] [PMC free article] [PubMed] [Google Scholar]