Abstract
Little is known about CD8 T cells in human visceral leishmaniasis (VL) and it is unclear if these cells have a protective, pathological and/or suppressive function. In experimental VL CD8 T cells have been shown to contribute to parasite control and play an important role in vaccine-generated immunity. To better understand the role of CD8 T cells in human VL, we examined molecules associated with anergy and cytotoxic T lymphocytes (CTL) in peripheral blood mononuclear cells (PBMC) and splenic aspirates (SA), and in CD8 cells derived from these tissues. Gene and surface marker expression suggest that splenic CD8 cell predominantly display an anergic phenotype, whereas CD8-PBMC have features of both anergic cells and CTLs. CD8 cells contribute to the baseline IFNγ levels in whole blood (WB) and SA cultures, but not to the Leishmania induced IFNγ release that is revealed using WB cultures. Blockade of CTLA-4 or PD1 had no effect on IFNγ production or parasite survival in SA cultures. Following cure, CD8 T cells contribute to the Leishmania induced IFNγ production observed in Leishmania stimulated cell cultures. We suggest CD8 T cells are driven to anergy/exhaustion in human VL, which affect their ability to contribute to protective immune responses.
Keywords: Visceral leishmaniasis, CD8 T cell, IL-10, PD1, CTLA-4, spleen, PBMC
Visceral leishmaniasis (VL) is a chronic infectious parasitic disease, which if left untreated is almost always fatal. The disease is caused by Leishmania donovani in India and Sudan and by Leishmania infantum in South America and the Mediterranean basin. The role of CD8 T cells and how they are affected in human VL is poorly understood. In experimental VL, CD8 cells are thought to contribute to resistance and parasite control through their ability to produce cytokines and act as CTLs [1–5].
In human leishmaniasis, most data on CD8 cells has been obtained from studies of cutaneous leishmaniasis (CL), where CD8 cells, are suggested to have protective as well as pathological roles. Production of IFNγ by CD8 T cells is primarily linked to protection [6, 7], while cytotoxicity, has been implicated in both control of parasites and disease pathology [7–9]. In addition, CD8 T cells producing IL-10 have been identified in post kala-azar dermal leishmaniasis (PKDL) and patients infected with Leishmania guanyensis [10, 11].
Many persistent infections cause dysfunctional CD8 T cell response, which has implications for pathogen survival and replication. Regulatory CD8 T cells, producing IL-10, have been associated with reduced tissue damage, concomitantly with viral persistence in patients with chronic hepatitis C infection (HCV) [12]. In chronic murine L. donovani infection the parasite drives generation of defective and anergic CD8 T cells, which with time die from exhaustion [13]. Cytotoxic T lymphocytes antigen 4 (CTLA-4) and programmed death protein 1 (PD1) are negative regulators of T cell activation [14] and characteristic markers of anergic/exhausted T cells during chronic infections [15, 16]. Blockade of their receptors B7 and B7-H1, respectively, have been suggested as a mean to enhance T cell responses and control L. donovani infection [13, 17, 18]. Suggestive of dying cells in human VL, Clarencio et al found that T cells from VL patients stained more positive for Fas and AnnexinV pre - compared to post-treatment or healthy controls [19]. However, a lower frequency of T cells expressing CTLA-4 pre- compared to post-treatments or controls was reported [19], which is in contrast to observations of lesional tissue from PKDL patients where CTLA-4 mRNA expression was higher pre- compared to post-treatment or controls [20].
The aim of this study was to better understand the role of CD8 T cells in human VL. Selected molecules associated with anergy or CTL function were assessed in cells from VL patients pre- and post-treatment and compared with cells from healthy individuals.
MATERIALS AND METHODS
Study Subjects
All patient presented with VL symptoms at the Kala-azar Research Center (KMRC), Muzaffarpur, India, and were confirmed to be VL positive by detection of amastigotes in SA and/or by a positive K39-test. In total, 196 patients pre- and/or 30 days post-treatment and nine six-months follow-up (clinically cured) cases were included in this study. All patients included were HIV-negative and over six years of age. SA examination is the most sensitive procedure for diagnosis of VL and SA were collected for diagnostic purpose before and 3–4 weeks after initiation of anti-leishmanial therapy to evaluate parasitologic status, with the exemption of patients with platelet counts <40 000/µL, prothrombin time <5 seconds or low hemoglobin. No serious complications or deaths occurred in the patients included in this study. Aggregate clinical data for VL patients are listed in Table 1. Spleen cells isolated from Swedish organ donors (HOD) (n = 9), obtained as described elsewhere [21], served as reference material. Venous blood was collected from patients and endemic controls (EC). All EC were healthy household members of patients (n = 59). Blood and SA samples were transported, at 15–18°C and 4–8°C respectively, to BHU, Varanasi, where they were processed within 24 hours of collection. The study was conducted year 2008–2012.
Table 1.
Aggregate Clinical Data of VL Patient at the Point of Diagnosis
| VL (n = 196) | EC (n = 59) | |
|---|---|---|
| Age in years | 30 (7–62)a | 35 (19–56) |
| Sex % (M/F) | 60/40 | 44/56 |
| WBC (per mm3) | 4550 (1300–15 800) | ND |
| Splenic scoreb | 2 (1–5) | NA |
| Spleen enlargement (cm) | 4 (0–20) | NA |
| Days of fever | 30 (4–365) | NA |
Abbreviations: ND, not done; NA, not applicable.
a Median values are shown, range given within parenthesis.
b Scoring of parasite load is on a logarithmic scale from 1 to 6, were 0 is no parasites per 1000 microscopic fields (1000×), 1 is 1–10 parasites per 1000 fields, and 6 is >100 parasites per field.
The use of human subjects followed recommendations outlined in the Helsinki declaration. Informed consent was obtained from all participants or their legal guardian. Ethical approval was obtained from the ethical review board of Banaras Hindu University, Varanasi, India and the regional ethical committee at Karolinska Institutet (KI Nord), Stockholm, Sweden.
Isolation of Cell Subsets From Blood and Splenic Aspirate Biopsies
CD8 T cells were positively selected from SA or Ficoll-paque (GE Healthcare) isolated PBMCs using MACS beads (Miltenyi) following manufacturer's instructions. For collection of multiple cell subsets, cells were sequentially enriched as described elsewhere [21, 22]. Positively selected cells were collected in RNAlater and stored at −80°C until used. MACS selected cells were ≥95% CD3+CD8+ as determined by FACS.
Real Time PCR
Total RNA was isolated using the RNeasy minikit (Qiagen), according to manufacturer's instruction, with adjustment of volumes according to sample volume as previously described [21]. cDNA synthesis was performed in 20 µL reactions on 0.5–1.0 µg RNA using High-Capacity cDNA Archive kit with random primers and Mutliscribe-MuLV reverse transcriptase. Primers were annealed to mRNA for 10 minutes at 25°C, followed by 2 hours extension at 37°C. Real-time PCR was performed using ABI-Prism 7500 (Applied Biosystems). cDNA specific FAM-MGB-labeled primer/probe for mRNAs of interest (IL-10, IFNγ, CTLA-4, PD1, granzyme A, perforin, granulysin, Fas, Fas-ligand, TRAIL, CD3e) and VIC-MGB-labelled 18S mRNA (primer limited) was used to determine the relative amount of mRNA in each sample (all reagents from Applied Biosystems). The relative expression was calculated as the number of cycles over the endogenous 18S mRNA required to detect the target mRNA.
Assessment of mRNAs was done over a period of several years. Due to use of different primes-probe batches, different equipment and in-between calibrations of equipment the actual cycle numbers for targets genes differed over time. Thus, while trends between groups were consistent over time, the data presented in different graphs cannot be compared. All results shown are relative to each other within one batch of experiments.
Flow Cytometry (FACS) Assessment of Cell Surface Markers and Intracellular Proteins
Isolated PBMC or SA were lysed of red blood cells and stained for FACS analysis ex-vivo or following stimulation, using the combinations of antibodies listed in Supplementary Table 1. For intra cellular staining (ICS) GolgiStop was added to the cell cultures for the last 6–14 hours and SEB (10 µg/mL) was used as positive control.
All samples were acquired on FACSort (BD Biosciences) and analyzed using CellQuest Pro (BD) or FlowJo (Treestar) software. Analysis was done on cells gated as lymphocytes based on their forward–side scatter. AnnexinV and 7AAD staining (BD) of a limited number of samples confirmed that the gated lymphocytes were >95% viable and not significantly different between VL and EC.
Whole Blood, PBMC and Splenic Aspirate Cultures
PBMC and splenic cells from VL patients and controls were cultured at 0.5–1 × 10⁶ cells/mL for 24 hours to 3 days in RPMI (Sigma) supplemented with 10% fetal calf serum (FCS), 200 mM Streptomycin and 100 U/mL penicillin (complete, C-RPMI). Cell cultures were stimulated with soluble Leishmania antigen (SLA), PHA or SEB as positive control or left untreated as previously described [21–24]. Whole blood stimulation assay (WBA), was performed as previously described [22]. To remove background plasma cytokines, plasma was replaced with FCS in all samples from active VL cases. Plasma was not replaced in samples from cured cases.
To determine the contribution of CD8 T cells to cytokine production, whole PBMC/WB and SA were depleted of CD8 cells using MACS beads and LS or whole blood columns (Miltenyi Biotech) or treated with blocking anti-HLA-A,B,C (clone W6/32, BioLegend) at 20 µg/mL, using mIgG2aκ (clone MOPC-173) as control. CTLA-4 and PD1/PD1L was blocked using anti-CTLA-4 (clone L3D10, eBiosciences), anti-PD1 and anti-CD274 (clones J116 and MIH5, eBiosciences) all at 10 µg/mL. mIgG1κ (clones MOPC-21 and P3.6.2.8.1, Biolegend) were used as controls. IFNγ and IL-10 were assessed in culture supernatants using ELISA kits (Biolegend) or by ICS and FACS as described above. Degranulation was addressed by measuring CD107a/LAMP-1 expression as previously described [25] using SEB stimulation as positive control.
Assessment of Parasite Load in Splenic Aspirate Cultures
The effect of cell depletion and blocking antibodies on parasite growth was measured in SA cultures following 72 hours of cultures, as described previously [20]. Briefly, 50–100 µL SA collected in 900 µL of C-RPMI was, following removal of 150 µL (used in diagnostic cultures), divided into equal parts, treated with blocking antibodies or depleted of CD8 cells using MACS beads and LS columns, and cultured for three days. SA culture supernatants were collected and used for cytokine detection by ELISA, while the SA cell pellets were transferred to blood-agar microtitre plates for estimation of parasite load [23].
Statistical Analysis
Statistical analysis was performed using PRISM 5 (GraphPad). Groups were compared using student's t-test or, if the samples failed to pass D'Agostino and Pearson normality test, Mann-Whitney test. When applicable, paired t-test or Wilcoxon matched paired tests were used.
RESULTS
mRNAs Associated With Anergy/Exhaustion are Upregulated in VL
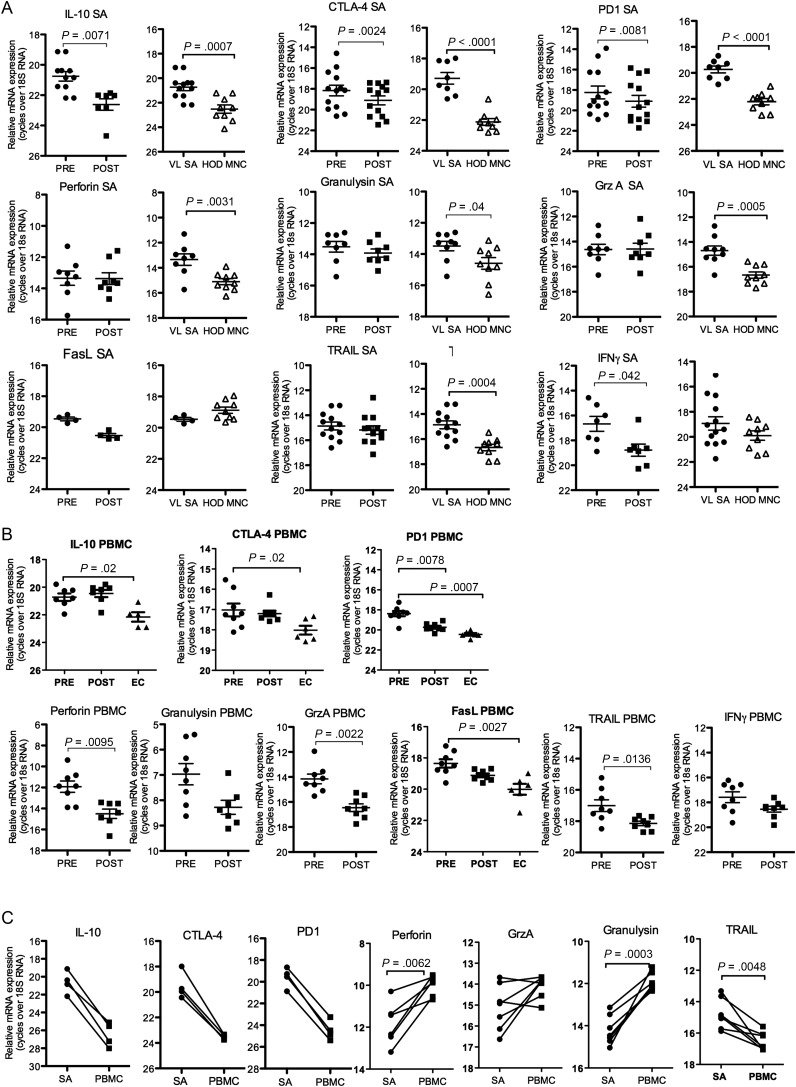
Experimental models of chronic VL have shown that the disease/parasite causes dysfunctional and anergic/exhausted T cells [13, 26]. To address this in human VL we compared mRNA expression of genes associated with anergy and CTL function in SA and PBMC from EC and patients with VL before and after therapy. Expressions of IL-10, PD1 and CTLA-4 mRNAs were found to be upregulated in SA and PBMC from patients with VL pre- compared to post-treatment and/or controls (Figure 1A and 1B). PBMC, but not SA from VL patients displayed higher expression of genes associated with CTL function (granzyme A, perforin and TNF-related apoptosis inducing ligand, TRAIL), pre- compared to post-treatment. Comparison of paired SA and PBMC showed higher expressions of IL-10, CTLA-4 and PD-1 in SA as compared to PBMC (Figure 1C). Expressions of the CTL associated genes granulysin and perforin were higher in PBMC compared to SA pre-treatment, granzyme A expression was similar in PBMC and SA, while TRAIL was higher in SA compared to PBMC (Figure 1C). Nevertheless, VL-SA expressed 2–4-fold more CTL mRNAs compared to HOD (Figure 1A), which may suggest that CTLs, while unchanged during the course of therapy, are elevated in the VL spleen.
Figure 1.
SA and PBMC express mRNAs differently. Relative mRNA expression of anergy and CTL associated genes in tissue samples from controls and VL patients pre- and 3 weeks post-treatment (A) whole SA and Splenic MNC (HOD) and (B) VL and EC PBMC. EC were not analyzed for perforin, granzyme A (GrzA) or TRAIL mRNA. C, Comparison of mRNA expression in splenic aspirates and PBMC pre-treatment. The relative amounts of RNA shown are not comparable between different graphs. Pre- and post-treatment samples were from the same donors and compared using students' paired t-test. EC/HOD and VL groups were compared using students' t-test. Non-parametric tests (Mann–Whitney U test or Wilcoxon matched pair test) were used when normality test failed. Significance differences between groups where n ≥ 6, are indicated with P-values. Each symbol represents one sample. Different donors/samples may be presented in different graphs.
mRNA Expression in VL CD8 Cells is Consistent With Anergy/Exhaustion
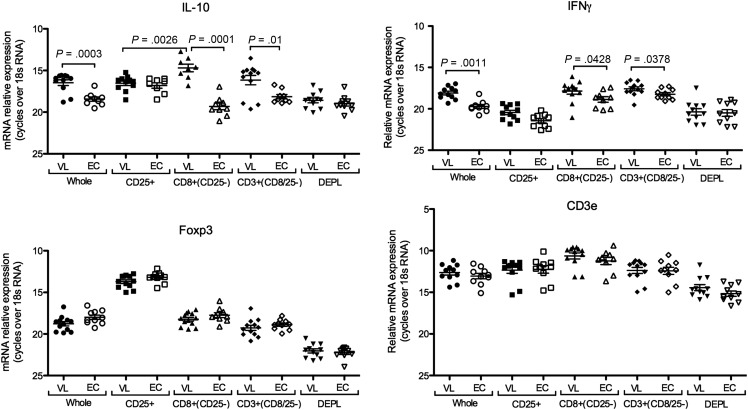
Our previous studies found the CD3+CD25− population as the main source of IL-10 mRNA in patients with VL [21]. To determine if CD8 cells were an important source of IL-10 and/or IFNγ mRNA in VL patients we assessed mRNA in sequentially isolated PBMC subsets from patients and EC. The highest expression levels of both IL-10 and IFNγ mRNA were in the positively selected CD8+ and CD3+(CD8 depleted) cell populations, which of note did not express the highest levels of Foxp3 mRNA (Figure 2). This proposes CD8 T cells as important sources of IL-10 and IFNγ during on-going disease.
Figure 2.
VL CD8 cells express high levels of both IL-10 and IFNγ mRNA. mRNA expression in VL and EC PBMC subsets isolated sequentially by MACS beads as indicated. Significant differences are indicated by P-values for IL-10 and IFNγ. Foxp3 expression was significantly higher in CD25+ cells compared to all other subsets (P = .001). CD3 ε expression was significantly higher in all positively selected cell subsets (CD25, CD8 and CD3) compared to whole PBMC and depleted cells (P < .05). Each symbol represents one donor. Comparison between VL and EC were done using t-test and between cell populations originating from the same donors using a paired t-test. Non-parametric tests (Mann–Whitney U test or Wilcoxon matched pair test) were used when normality test failed.
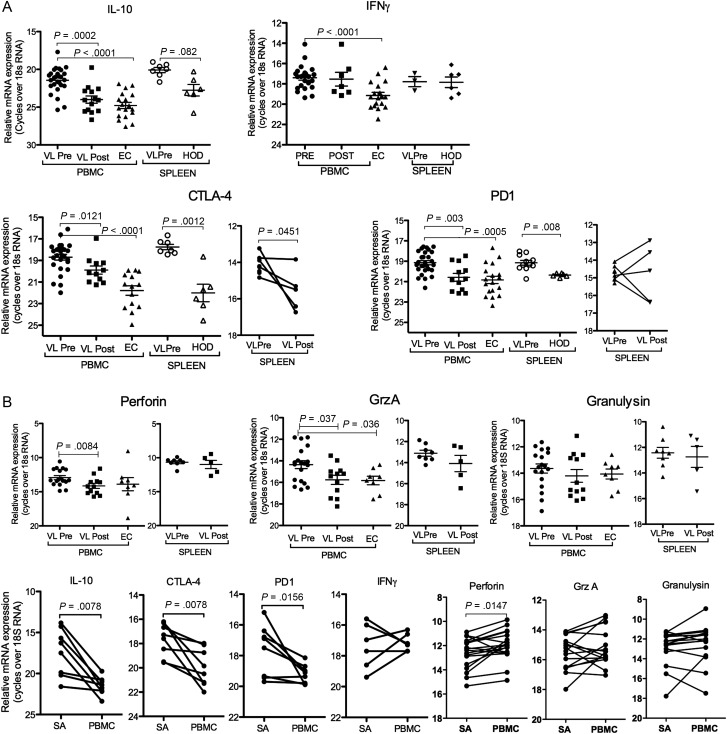
We further carried out analysis on isolated CD8 cells from SA and PBMC to determine if the observed differences in gene expressions associated with anergy and CTL were reflected at the CD8 subset level, and in comparison to post-treatment samples. Consistent with the sequential depletion data discussed above, the isolated CD8 cells from either PBMC or SA showed elevated levels of both IL-10 and IFNγ mRNA pre-treatment in comparison to cells from the respective healthy tissue (Figure 3A). However, whereas IL-10 mRNA returned to baseline post-treatment, IFNγ mRNA remained elevated, reflecting the immune status of clinically cured individuals. In line with observation made using whole tissue, we found that isolated CD8 cells from both SA and PBMC also expressed elevated levels of CTLA-4 and PD1 mRNA, while only PBMC-CD8 cells showed upregulation of granzyme A and perforin mRNA pre- compared to post-treatment (Figure 3A). Comparison between isolated CD8 cells from paired pre-treatment VL SA and PBMC showed that splenic CD8 cells expressed higher levels of IL-10, CTLA-4, and PD1 compared to blood CD8 cells, while IFNγ and Fas expression levels were similar (Figure 3B, Supplementary Figure 1). Assessment of the CTL associated mRNAs showed that PBMC-CD8 cells expressed more perforin, while granzyme A and granulysin expressions were not significantly different between CD8 cells from SA or PBMC (Figure 3B). Genes associated with CTL function were expressed at 4–8-fold higher levels in the CD8 population compared to corresponding CD4 population or cells depleted of CD8 cells (not shown).
Figure 3.
Gene expression in SA and PBMC CD8 cells is suggestive of anergic/exhausted cells. A, Relative gene expression, as indicated in figure, in MACS purified CD8 cells from PBMC and spleen of patient and controls. B, Comparison of relative gene expression in paired pre-treatment SA and PBMC CD8 cells. Samples analyzed for different transcripts are not necessarily from the same donors, thus only samples within the same graph can be compared. Significance differences between groups where n ≥ 6, are indicated with P-values. Each symbol represents one sample. Paired samples are indicated with a solid line. All groups were compared using Mann–Whitney U test. The pre-post treatment groups contain both paired and unpaired samples. P-values in graphs show test for unpaired samples. Wilcoxon match paired test was used for comparison of paired PBMC and SA CD8 cells.
Elevated Cell Surface Expression of CTLA-4 and PD1 on VL CD8 Cells
To validate findings on the gene expression level we assessed surface marker expression of molecules associated with anergy/exhaustion and/or CTL function on PBMC CD8 T cell. Due to a highly restricted number of cells obtained from SA and variation between assays, surface marker expression on splenic CD8 cells was only obtained for PD1, CTLA-4 and granulysin.
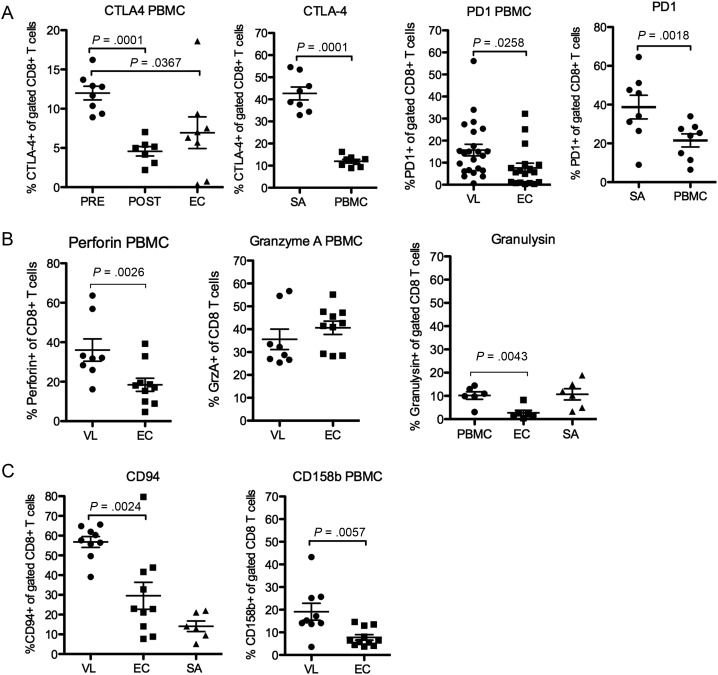
The FACS analysis confirmed elevated expression of CTLA-4 and PD1 on VL compared to EC PBMC (Figure 4A), and that SA-CD8 cells express more of these molecules compared to PBMC-CD8. Both granulysin and perforin were higher in VL compared to EC CD8 cells, however, in contrast to the mRNA expression data, no difference in granzyme A surface expression was observed (Figure 4B). TRAIL, which is rapidly cleaved, was not detected. In addition to the molecules addressed by mRNA expression, we stained PBMC for the inhibitory Natural Killer cell receptors (iNKR), CD94, CD158b and CD158a. Acquisition of iNKR by CD8 T cell has been suggested to confer inhibitory signals to the cell. The CD94/NKG2 receptor is primarily associated with restrained CTL function [27] while the CD158b has been associated with loss of proliferative and IFNγ producing capacity [28]. We found that VL CD8 T cells had upregulated expression of the subunit CD94 and the killer Ig-like receptor (KIR) members CD158b (Figure 4C) and CD158a, (expressed on 3.4 ± 2.6% of VL compared to 1.9 ± 3.4% of EC CD8 T cells, n = 6/group, P = .04).
Figure 4.
VL CD8T cells have elevated surface expression of anergy associated proteins. Surface expressions of (A) CTLA-4 and PD1 (B) Perforin, Granzyme A and Granulysin and (C) iNKRs. Significant differences between groups are indicated with P-values in graphs. Different donors/samples may be presented in different graphs. Comparison was made using student's t-test. Pre- and post-treatment samples were not paired.
Neutralizing Antibodies Against CTLA-4 and PD1 Does not Affect IFNγ Production or Parasite Load
Blockade of CTLA-4 or PD1/PD1L in experimental VL have been found to favor protective CD8 T cells responses [13, 17]. In our experiments, however, blockade of CTLA-4 or PD1/PD1L had no effect on baseline or SLA induced IFNγ production in stimulated blood cultures (Supplementary Figure 2). Nor could we observe an effect on parasite survival in SA cultures when CTLA-4 blocking antibodies were added ex-vivo (Supplementary Figure 2).
CD8 T Cell Effector Responses are Lacking in VL Patients
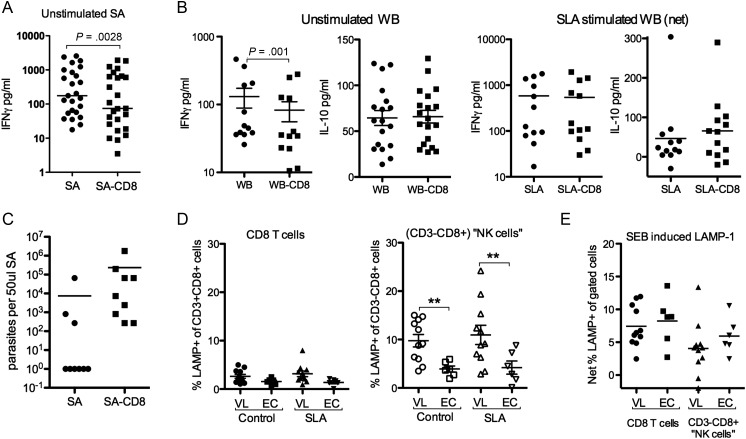
VL PBMCs typically fail to mount antigen specific responses, but are not generally immunosupressed as PBMCs from most patients can mount responses to both PPD and polyclonal stimulation [21, 29]. The unresponsiveness to SLA stimulation does not exclude the possibility that CD8 cells contribute to the elevated levels of IFNγ seen in VL patients [21] or play a role in the Leishmania antigen specific IFNγ response recently discovered in VL patients using the WBA [24]. Removal of CD8 cells from blood and SA cultures indicated, in line with the mRNA expression data, that CD8 cells contribute to the elevated baseline IFNγ levels found in VL patients (Figure 5A and 5B); mean and median (within parenthesis) were as follows; SA:665 ± 791 pg/mL (297 pg), SA-CD8:473 ± 591 pg/mL (145 pg); WBA:131 ± 147 pg/mL (46.8 pg/mL), WBA-CD8:82.7 ± 93.7 pg/mL (35 pg/mL). Further, while not statistically significant, (P = .0584) our data suggest that depletion of CD8 from SA enhance parasite growth (Figure 5C). However, CD8 cells do not contribute to the SLA induced IFNγ or IL-10 detected in WBA (Figure 5B).
Figure 5.
CD8 effector responses are lacking in active VL. A, Background levels of IFNγ in 3-day cultures of whole splenic aspirate (SA) or SA depleted of CD8 cells (SA-CD8) (B) Background or SLA induced levels of IFNγ and IL-10 in 24 hours whole blood (WB) cultures depleted or not of CD8 cells (WB-CD8). SLA values shown are net responses with background values subtracted. C, Parasite growth following CD8 depletion. D, Expression of LAMP1 in different cell populations as indicated on x-axis in unstimulated (left) and SLA (center) or SEB (right) stimulated cultures. Statistical comparison was done using 1-way ANOVA followed by comparison between VL and EC groups using Mann–Whitney U test and Wilcoxon matched pair test for comparison between stimulations (P values indicated).
VL CD8+CD3+PBMC do not respond with degranulation, measured as LAMP1 surface expression, when stimulated with SLA, while degranulation responses to SEB remain intact (Figure 5D). Noteworthy is that CD8+CD3− cells from VL patients regardless of stimulation expressed significantly more LAMP-1 as compared to controls (Figure 5D), indicating that NK cell are activated in VL patients.
CD8 T Cells Contribute to SLA Induced IFNγ Following Clinical Cure
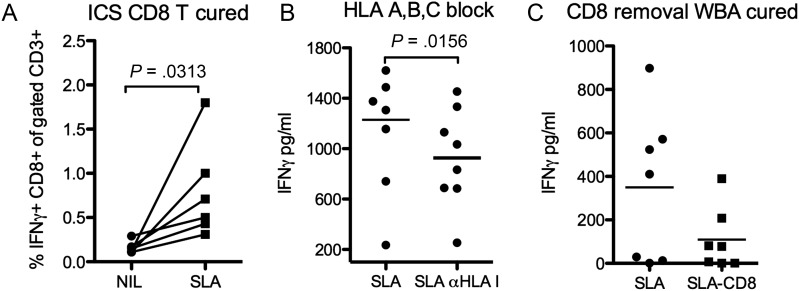
In contrast to the Leishmania-specific unresponsiveness observed in PBMC from active VL cases, six months post-treatment IFNγ producing CD8 T cells were clearly detectable in SLA stimulated PBMC cultures (Figure 6A), In line with these observations, pan-HLA I blockade significantly reduced the IFNγ levels detected in SLA stimulated WB culture supernatants (Figure 6B). The same trend, albeit not significant, was observed following depletion of CD8 cells from WB cultures (Figure 6C). These results suggest that CD8 T cells contribute to protective immune responses and parasite control in patients cured of VL and presumably resistant against subsequent disease.
Figure 6.
CD8 cells contribute to antigen specific IFNγ production following clinical cure (6 months post-treatment). A, Frequency of IFNγ CD8T cells out of total (CD3+) T cell population following 24 hours stimulation with or without SLA as determined by intra cellular staining and FACS analysis. BFA was added to the cultures for the last 8 hours. B, Effect of pan-HLA-I blockade on IFNγ detection in supernatants from SLA stimulated whole blood following 24 hours of culture, comparison was done with isotype control stimulated samples (C) Effect of CD8 depletion on IFNγ detection in supernatants from SLA stimulated WBA. Net values (IFNγ in stimulated minus IFNγ in unstimulated samples) are shown in figure B & C. Statistical significances using student's paired t-test are indicated by P-values in figures.
DISCUSSION
The contribution of CD8 cells in control of L. donovani infection has been shown experimentally. Being protective and potentially parasitocidal, CD8 cell are targets for microbial modification. Experimentally, L. donovani infection has been shown to also impair CD8 function in a way that facilitates parasite survival [13]. Studies addressing CD8 T cells during human VL have been few and limited in both size and scope.
The analysis of CD8 cell in patients with VL presented here show, in line with experimental findings, that CD8 T cells have features of anergic/exhausted cells, seen as elevated expression of CTLA-4 and PD1 mRNAs, accompanied with high IL-10 mRNA expression. We also found that VL CD8 T cells have upregulated expression of CD94, CD158a and CD158b, supporting the notion that the CD8 T cells have lost functional capacity in VL patients. Elevated iNKR expression on CD8 T cells has been linked with various infectious and non-infections chronic inflammatory conditions [30] and has been suggested to suppress CD8 cell responses allowing uncontrolled viral replication in HIV-infected children [31, 32].
There was a discrepancy between splenic and PBMC derived CD8 cells in that mRNAs associated with anergy/exhaustion were significantly higher in SA compared to PBMC CD8 cells; approximately 16–fold higher for IL-10 and four-fold higher for CTLA-4 and PD1. Further, splenic VL CD8 cells also expressed more IL-10, CTLA-4 and PD1 mRNAs than splenic CD8 cells from HOD. Together, this signifies that CD8 cells with anergic/exhausted properties accumulate in the VL spleen.
The elevated CTL gene expression observed in whole PBMC compared to whole SA could be a consequence of increased CTL gene expression in the CD8 population, but may also be explained by the higher frequency of T cells in PBMC compared to SA, which appear to be the explanation for the higher expression of granzyme A and granulysin in PBMC compared to SA. Perforin expression, which was significantly higher in the PBMC-CD8 cells compared to SA-CD8, implicate that differences also exist at the cell subset level.
Presence of activated NK cells in PBMC is suggested by the higher LAMP-1 levels found in CD8+CD3− PBMC of VL patients. NK cells could potentially be selected by CD8-MACS beads, as human NK cells are CD8dim [33]. We know from previous assessments that NK cells only make up 2%–4% of VL PBMC or SA lymphocytes and that the frequency of NK cells is lower in VL patients compared to EC [21]. Thus, the contribution of NK cells to the gene expression in positively selected cells CD8 cells is likely limited.
The tendency to more parasites in CD8 depleted cultures suggest that splenic CD8 cells may contribute to some degree of parasite control in the VL spleen. Experimentally, blockade of the CTLA-4 or the PD1/PD1L pathways have been shown to break CD8 anergy and enhance control of infection [13, 17]. Thus we were surprised to find that blockade of these molecules had no effect on IFNγ production or parasite killing in our cultures. Studies of HCV patients suggest that release of antigen specific CD8 cells from their unresponsive state require combined CTLA-4 and PD1/PD1L blockade [34]. This combination was not tested in our assays. Removal of CD8 cells slightly reduced baseline IFNγ levels in our cultures, but no effect of CD8 blockade or CD8 depletion was observed on responses to SLA in WBA. This implies that during active disease VL patients either fail to generate antigen specific CD8 cells or that short-term blockade of a single inhibitory molecule on T cells is not sufficient to rescue antigen specific responses. The cytokine milieu in experimental VL has been shown to drive bystander activation of CD8 T cells [35]. Bystander activated CD8 T cells may contribute to the elevated IFNγ observed in VL patients. CD8 activation is suggested by the elevated IFNγ mRNA expression in CD8 cells and the reduction of baseline IFNγ following CD8 depletion. However, bystander activation may lead to incomplete activation and subsequent cells death, which could explain the mixed upregulation of mRNAs associated with anergy/exhaustion and CTL in VL PBMC.
In conclusion CD8 cells in VL can be described as anergic/exhausted cells with a limited ability to produce IFNγ. Once clinically cured (6 months post-treatment), and presumably resistant to reinfection, CD8 cells responded with IFNγ to SLA stimulation, suggesting functional regeneration of antigen specific CD8 cells. In line with findings in murine VL models, the data are consistent with CD8 T cells having a protective role against the parasite, however, due to the inability to completely eliminate the pathogen, with time CD8 T cell are driven to anergy/exhaustion, and a more severe immunological imbalance in favor of the parasite ensues.
Supplementary Data
Supplementary materials are available at The Journal of Infectious Diseases online (http://jid.oxfordjournals.org/). Supplementary materials consist of data provided by the author that are published to benefit the reader. The posted materials are not copyedited. The contents of all supplementary data are the sole responsibility of the authors. Questions or messages regarding errors should be addressed to the author.
Notes
Acknowledgments. We thank the KMRC staff for their assistance in the collection of patient samples. The care of the patients was supported by the Sitaram Memorial Trust, Muzaffarpur, India.
Financial support This work was supported by the Extramural Research Program of the National Institute of Allergy (NIAID), National Institutes of Health (NIH) Tropical Medicine Research Centers [P50 AI074321]; the Indian Council of Medical Research; the Swedish Society of Medicine [SLS98351] and NIAID/NIH Intramural Research Program.
Potential conflicts of interest. All authors: No reported conflicts.
All authors have submitted the ICMJE Form for Disclosure of Potential Conflicts of Interest. Conflicts that the editors consider relevant to the content of the manuscript have been disclosed.
References
- 1.Kaye PM, Cooke A, Lund T, Wattie M, Blackwell JM. Altered course of visceral leishmaniasis in mice expressing transgenic I-E molecules. Eur J Immunol. 1992;22:357–64. doi: 10.1002/eji.1830220211. [DOI] [PubMed] [Google Scholar]
- 2.Stager S, Smith DF, Kaye PM. Immunization with a recombinant stage-regulated surface protein from Leishmania donovani induces protection against visceral leishmaniasis. J Immunol. 2000;165:7064–71. doi: 10.4049/jimmunol.165.12.7064. [DOI] [PubMed] [Google Scholar]
- 3.Stern JJ, Oca MJ, Rubin BY, Anderson SL, Murray HW. Role of L3T4+ and LyT-2+ cells in experimental visceral leishmaniasis. J Immunol. 1988;140:3971–7. [PubMed] [Google Scholar]
- 4.Tsagozis P, Karagouni E, Dotsika E. CD8(+) T cells with parasite-specific cytotoxic activity and a Tc1 profile of cytokine and chemokine secretion develop in experimental visceral leishmaniasis. Parasite Immunol. 2003;25:569–79. doi: 10.1111/j.0141-9838.2004.00672.x. [DOI] [PubMed] [Google Scholar]
- 5.Tsagozis P, Karagouni E, Dotsika E. Function of CD8+ T lymphocytes in a self-curing mouse model of visceral leishmaniasis. Parasitol Int. 2005;54:139–46. doi: 10.1016/j.parint.2005.02.005. [DOI] [PubMed] [Google Scholar]
- 6.Nateghi Rostami M, Keshavarz Valian H, Eskandari SE, et al. Differential in vitro CD4+/CD8+ T-cell response to live vs. killed Leishmania major. Parasite Immunol. 2010;32:101–10. doi: 10.1111/j.1365-3024.2009.01164.x. [DOI] [PubMed] [Google Scholar]
- 7.Santos CD, Boaventura V, Ribeiro Cardoso C, et al. CD8(+) granzyme B(+)-mediated tissue injury vs. CD4(+)IFNgamma(+)-mediated parasite killing in human cutaneous leishmaniasis. J Invest Dermatol. 2013;133:1533–40. doi: 10.1038/jid.2013.4. [DOI] [PMC free article] [PubMed] [Google Scholar]
- 8.Bousoffara T, Louzir H, Ben Salah A, Dellagi K. Analysis of granzyme B activity as a surrogate marker of Leishmania-specific cell-mediated cytotoxicity in zoonotic cutaneous leishmaniasis. J Infect Dis. 2004;189:1265–73. doi: 10.1086/382031. [DOI] [PubMed] [Google Scholar]
- 9.Brodskyn CI, Barral A, Boaventura V, Carvalho E, Barral-Netto M. Parasite-driven in vitro human lymphocyte cytotoxicity against autologous infected macrophages from mucosal leishmaniasis. J Immunol. 1997;159:4467–73. [PubMed] [Google Scholar]
- 10.Bourreau E, Ronet C, Couppie P, Sainte-Marie D, Tacchini-Cottier F, Launois P. IL-10 producing CD8+ T cells in human infection with Leishmania guyanensis. Microbes Infect. 2007;9:1034–41. doi: 10.1016/j.micinf.2007.04.009. [DOI] [PubMed] [Google Scholar]
- 11.Saha S, Mondal S, Ravindran R, et al. IL-10- and TGF-beta-mediated susceptibility in kala-azar and post-kala-azar dermal leishmaniasis: the significance of amphotericin B in the control of Leishmania donovani infection in India. J Immunol. 2007;179:5592–603. doi: 10.4049/jimmunol.179.8.5592. [DOI] [PubMed] [Google Scholar]
- 12.Abel M, Sene D, Pol S, et al. Intrahepatic virus-specific IL-10-producing CD8T cells prevent liver damage during chronic hepatitis C virus infection. Hepatology. 2006;44:1607–16. doi: 10.1002/hep.21438. [DOI] [PubMed] [Google Scholar]
- 13.Joshi T, Rodriguez S, Perovic V, Cockburn IA, Stager S. B7-H1 blockade increases survival of dysfunctional CD8(+) T cells and confers protection against Leishmania donovani infections. PLoS Pathog. 2009;5:e1000431. doi: 10.1371/journal.ppat.1000431. [DOI] [PMC free article] [PubMed] [Google Scholar]
- 14.Chen L. Co-inhibitory molecules of the B7-CD28 family in the control of T-cell immunity. Nat Rev Immunol. 2004;4:336–47. doi: 10.1038/nri1349. [DOI] [PubMed] [Google Scholar]
- 15.Day CL, Kaufmann DE, Kiepiela P, et al. PD-1 expression on HIV-specific T cells is associated with T-cell exhaustion and disease progression. Nature. 2006;443:350–4. doi: 10.1038/nature05115. [DOI] [PubMed] [Google Scholar]
- 16.Kaufmann DE, Kavanagh DG, Pereyra F, et al. Upregulation of CTLA-4 by HIV-specific CD4+ T cells correlates with disease progression and defines a reversible immune dysfunction. Nat Immunol. 2007;8:1246–54. doi: 10.1038/ni1515. [DOI] [PubMed] [Google Scholar]
- 17.Murphy ML, Cotterell SE, Gorak PM, Engwerda CR, Kaye PM. Blockade of CTLA-4 enhances host resistance to the intracellular pathogen, Leishmania donovani. J Immunol. 1998;161:4153–60. [PubMed] [Google Scholar]
- 18.Zubairi S, Sanos SL, Hill S, Kaye PM. Immunotherapy with OX40L-Fc or anti-CTLA-4 enhances local tissue responses and killing of Leishmania donovani. Eur J Immunol. 2004;34:1433–40. doi: 10.1002/eji.200324021. [DOI] [PubMed] [Google Scholar]
- 19.Clarencio J, de Oliveira CI, Favali C, et al. Could the lower frequency of CD8+CD18+CD45RO+ lymphocytes be biomarkers of human VL? Int Immunol. 2009;21:137–44. doi: 10.1093/intimm/dxn131. [DOI] [PubMed] [Google Scholar]
- 20.Katara GK, Ansari NA, Verma S, Ramesh V, Salotra P. Foxp3 and IL-10 expression correlates with parasite burden in lesional tissues of post kala azar dermal leishmaniasis (PKDL) patients. PLoS Negl Trop Dis. 2011;5:e1171. doi: 10.1371/journal.pntd.0001171. [DOI] [PMC free article] [PubMed] [Google Scholar]
- 21.Nylen S, Maurya R, Eidsmo L, Manandhar KD, Sundar S, Sacks D. Splenic accumulation of IL-10 mRNA in T cells distinct from CD4+CD25+ (Foxp3) regulatory T cells in human visceral leishmaniasis. J Exp Med. 2007;204:805–17. doi: 10.1084/jem.20061141. [DOI] [PMC free article] [PubMed] [Google Scholar]
- 22.Ansari NA, Kumar R, Gautam S, et al. IL-27 and IL-21 are associated with T cell IL-10 responses in human visceral leishmaniasis. J Immunol. 2011;186:3977–85. doi: 10.4049/jimmunol.1003588. [DOI] [PMC free article] [PubMed] [Google Scholar]
- 23.Gautam S, Kumar R, Maurya R, et al. IL-10 neutralization promotes parasite clearance in splenic aspirate cells from patients with visceral leishmaniasis. J Infect Dis. 2011;204:1134–7. doi: 10.1093/infdis/jir461. [DOI] [PMC free article] [PubMed] [Google Scholar]
- 24.Gidwani K, Jones S, Kumar R, Boelaert M, Sundar S. Interferon-gamma release assay (modified QuantiFERON) as a potential marker of infection for Leishmania donovani, a proof of concept study. PLoS Negl Trop Dis. 2011;5:e1042. doi: 10.1371/journal.pntd.0001042. [DOI] [PMC free article] [PubMed] [Google Scholar]
- 25.Smith C, Beagley L, Khanna R. Acquisition of polyfunctionality by Epstein-Barr virus-specific CD8+ T cells correlates with increased resistance to galectin-1-mediated suppression. J Virol. 2009;83:6192–8. doi: 10.1128/JVI.00239-09. [DOI] [PMC free article] [PubMed] [Google Scholar]
- 26.Gomes NA, Barreto-de-Souza V, Wilson ME, DosReis GA. Unresponsive CD4+ T lymphocytes from Leishmania chagasi-infected mice increase cytokine production and mediate parasite killing after blockade of B7–1/CTLA-4 molecular pathway. J Infect Dis. 1998;178:1847–51. doi: 10.1086/314520. [DOI] [PubMed] [Google Scholar]
- 27.Mingari MC, Ponte M, Bertone S, et al. HLA class I-specific inhibitory receptors in human T lymphocytes: interleukin 15-induced expression of CD94/NKG2A in superantigen- or alloantigen-activated CD8+ T cells. Proc Natl Acad Sci U S A. 1998;95:1172–7. doi: 10.1073/pnas.95.3.1172. [DOI] [PMC free article] [PubMed] [Google Scholar]
- 28.Anfossi N, Doisne JM, Peyrat MA, et al. Coordinated expression of Ig-like inhibitory MHC class I receptors and acquisition of cytotoxic function in human CD8+ T cells. J Immunol. 2004;173:7223–9. doi: 10.4049/jimmunol.173.12.7223. [DOI] [PubMed] [Google Scholar]
- 29.Sacks DL, Lal SL, Shrivastava SN, Blackwell J, Neva FA. An analysis of T cell responsiveness in Indian kala-azar. J Immunol. 1987;138:908–13. [PubMed] [Google Scholar]
- 30.Mingari MC, Pietra G, Moretta L. Human cytolytic T lymphocytes expressing HLA class-I-specific inhibitory receptors. Curr Opin Immunol. 2005;17:312–9. doi: 10.1016/j.coi.2005.03.006. [DOI] [PubMed] [Google Scholar]
- 31.Costa P, Rusconi S, Fogli M, et al. Low expression of inhibitory natural killer receptors in CD8 cytotoxic T lymphocytes in long-term non-progressor HIV-1-infected patients. AIDS. 2003;17:257–60. doi: 10.1097/00002030-200301240-00017. [DOI] [PubMed] [Google Scholar]
- 32.Costa P, Rusconi S, Mavilio D, et al. Differential disappearance of inhibitory natural killer cell receptors during HAART and possible impairment of HIV-1-specific CD8 cytotoxic T lymphocytes. AIDS. 2001;15:965–74. doi: 10.1097/00002030-200105250-00004. [DOI] [PubMed] [Google Scholar]
- 33.Nylen S, Maasho K, Soderstrom K, Ilg T, Akuffo H. Live Leishmania promastigotes can directly activate primary human natural killer cells to produce interferon-gamma. Clin Exp Immunol. 2003;131:457–67. doi: 10.1046/j.1365-2249.2003.02096.x. [DOI] [PMC free article] [PubMed] [Google Scholar]
- 34.Nakamoto N, Cho H, Shaked A, et al. Synergistic reversal of intrahepatic HCV-specific CD8T cell exhaustion by combined PD-1/CTLA-4 blockade. PLoS Pathog. 2009;5:e1000313. doi: 10.1371/journal.ppat.1000313. [DOI] [PMC free article] [PubMed] [Google Scholar]
- 35.Polley R, Sanos SL, Prickett S, Haque A, Kaye PM. Chronic Leishmania donovani infection promotes bystander CD8+-T-cell expansion and heterologous immunity. Infect Immun. 2005;73:7996–8001. doi: 10.1128/IAI.73.12.7996-8001.2005. [DOI] [PMC free article] [PubMed] [Google Scholar]
Associated Data
This section collects any data citations, data availability statements, or supplementary materials included in this article.


