

Abstract
Spatial and temporal control of intracellular calcium signaling is essential for neuronal development and function. The termination of local Ca2+ signaling and the maintenance of basal Ca2+ levels require specific extrusion systems in the plasma membrane. In rat hippocampal neurons developing in vitro, transcripts for all isoforms of the plasma membrane Ca2+ pump (PMCA) and the Na/Ca2+ exchanger (NCX), and the major non-photoreceptor Na+/Ca2+,K+ exchangers (NCKX) were strongly upregulated during the second week in culture. Upregulation of PMCA1, 3, and 4 mRNA coincided with a splice shift from the ubiquitous b-type to the neuron-specific a-type with altered calmodulin regulation. Expression of all PMCA isoforms increased over five-fold during the first two weeks. PMCA immunoreactivity was initially concentrated in the soma and growth cones of developing hippocampal neurons. As the cells matured, PMCAs concentrated in the dendritic membrane and often co-localized with actin-rich dendritic spines in mature neurons. In the developing rat hippocampal CA1 region, immunohistochemistry confirmed the upregulation of all PMCAs and showed that by the end of the second postnatal week, PMCAs 1, 2 and 3 were concentrated in the neuropil, with less intense staining of cell bodies in the pyramidal layer. PMCA4 staining was restricted to a few cells showing intense labeling of the cell periphery and neurites. These results establish that all major Ca2+ extrusion systems are strongly upregulated in hippocampal neurons during the first two weeks of postnatal development. The overall increase in Ca2+ extrusion systems is accompanied by changes in the expression and cellular localization of different isoforms of the Ca2+ pumps and exchangers. The accumulation of PMCAs in dendrites and dendritic spines coincides with the functional maturation in these neurons, suggesting the importance of the proper spatial organization of Ca2+ extrusion systems for synaptic function and development.
Keywords: Hippocampus, neuronal development, plasma membrane calcium pump, PMCA, sodium-calcium exchange
Introduction
The precise regulation of free intracellular calcium [Ca2+]i is of paramount importance for cell function. Processes as diverse as fertilization of the egg or the triggering of nerve activation depend on carefully timed Ca2+ signals of appropriate amplitude and duration (Berridge et al., 2003). Among the many components participating in Ca2+ signaling, the plasma membrane calcium ATPases (PMCAs) play an important role in the termination phase of the signal. Together with the plasmalemmal Na+/Ca2+ exchangers (NCXs), they are responsible for removing Ca2+ from the cytosol to the extracellular milieu (Carafoli et al., 2001). The spatial distribution and relative abundance, as well as the regulation of these plasmalemmal calcium extrusion systems should therefore fundamentally influence local Ca2+ regulation. This is particularly relevant in neurons where spatially confined calcium signaling underlies the specificity and selectivity of synaptic function (Augustine et al., 2003). However, virtually no information is currently available on the developmental expression and cellular localization of the plasma membrane Ca2+ extrusion systems in major regions of the brain, including the hippocampus. This information may be needed to better understand the pathophysiology of neurodegenerative disorders such as Alzheimer’s Disease, epilepsy and stroke. Aberrant Ca2+ regulation is thought to underlie the neurodegenerative processes in these diseases (Choi, 1995; Mattson and Barger, 1993; Mattson et al., 1993; Sattler and Tymianski, 2000), and alterations in the expression or localization of the Ca2+ extrusion systems are thus likely to contribute to their pathology.
In mammals, the PMCAs are encoded by four genes, which give rise to the four major pump isoforms PMCA1-4. Alternative splicing of the primary transcripts increases the number of theoretically possible PMCA variants to over 30 although only a limited number of these appear to be expressed at significant levels in the tissues analyzed thus far (Strehler and Zacharias, 2001). All four PMCA isoforms are expressed in the mammalian brain, with the adult brain expressing the largest variety of different splice variants (Brandt et al., 1992; Stauffer et al., 1995; Zacharias et al., 1995). Several studies have documented the differential expression of PMCA isoforms and splice variants in different regions of the brain (Stahl et al., 1992; Stauffer et al., 1997; Zacharias et al., 1995); and immunocytochemical work has revealed patterns of differential PMCA isoform distribution even at the cellular level (Burette et al., 2003; Dumont et al., 2001; Furuta et al., 1998; Krizaj et al., 2002). A detailed study using in situ hybridization to analyze the different PMCA transcripts in the developing cochlea indicated that dramatic changes occur in the expression of PMCA isoforms during the differentiation and maturation of specific neuronal cell types (Furuta et al., 1998). However, except for the cochlea, very little is known about the time course of PMCA isoform expression during neuronal development.
The Na+/Ca2+ exchangers are also encoded by a multigene family. Three separate genes specify NCX isoforms 1–3 (Blaustein and Lederer, 1999; Quednau et al., 1997). In addition, a separate family of at least six genes codes for NCKX isoforms, which co-transport K+ along with Na+ in exchange for Ca2+, resulting in very different transport characteristics and optimal cation concentrations for their activation (Blaustein and Lederer, 1999; Cai and Lytton, 2004; Lytton et al., 2002). Although Na+/Ca2+,K+ exchange was originally thought to be unique to photoreceptors, recent work has shown that several members of the NCKX family are expressed in non-retinal and even non-neuronal tissues (Lytton et al., 2002). Few data exist, however, on the developmental expression of the NCKX isoforms in neurons.
Here we first determined the developmental expression of all PMCA and NCX isoforms, and of the major non-photoreceptor NCKX isoforms 2–4 at the transcript level, using reverse-transcriptase PCR on mRNA isolated from rat hippocampal neurons during the first three weeks of in vitro development. The developmental distribution of the PMCA isoforms was studied at the tissue and cellular levels by immunohistochemistry and immunofluorescence microscopy. The data show a dramatic increase in the calcium extrusion systems in developing neurons between 7 and 14 days in culture, and reveal a specific splice shift from a “ubiquitous” (b-type) to a “neuron-specific” (a-type) splice variant for PMCAs 1 and 3, and to a lesser extent for PMCA4. The increased PMCA expression we demonstrate in the cultured neurons and developing hippocampus of newborn rats occurs during the period of greatest synaptic development and stabilization. This result, combined with an observed rapid increase in the punctuate appearance of PMCAs in dendrites, suggests their specific concentration in areas of synaptic development.
Materials and Methods
Materials
All cell culture media and reagents (trypsin-EDTA, Neurobasal medium, Dulbecco’s Modified Eagle’s Medium (DMEM), fetal bovine serum (FBS), L-glutamine, sodium pyruvate and antibiotics/antimycotics) were from Invitrogen (Carlsbad, CA). RT-PCR reagents, enzymes and protease inhibitor cocktail tablets (Complete mini EDTA-free) were purchased from Roche-Boehringer Mannheim (Indianapolis, IN). DAPI (4′,6′-diamidino-2-phenylindole dihydrochloride) was present in the Prolong coverslip mounting medium, available from Molecular Probes, Eugene, OR. All other chemicals were from Sigma (St. Louis, MO). Monoclonal (5F10, JA9) and polyclonal antibodies (NR-1, NR-2, NR-3) against the PMCAs were a generous gift from Dr. John T. Penniston and Adelaida G. Filoteo (Mayo Clinic, Rochester). These antibodies have been extensively characterized previously (Caride et al., 1996; Filoteo et al., 1997). Primary antibody against β-actin, and rhodamine-phalloidin were from Sigma. The mouse monoclonal antibody against NeuN was from Abcam (Cambridge, East Anglia, UK). X-ray films were from Eastman Kodak (Rochester, NY).
Cell cultures
Primary cultures of rat embryonic (E18) hippocampal neurons (HNs) were prepared according to published protocols (Fitzsimonds et al., 1997) and were depleted of glia by a differential plating procedure. Briefly, freshly isolated and dissociated cells were placed for 1.5–2 h in a regular untreated tissue culture dish to allow glia and other non-neuronal cells to adhere. The medium was then removed and the non-adherent cells still in suspension were counted to allow for proper plating densities. Neurons were maintained in Neurobasal medium supplemented with 1 x B27, 0.5 mM L-glutamine, 15 U/ml penicillin and 15 U/ml streptomycin at 37°C in a humidified atmosphere containing 5% CO2. These culture conditions have been shown to result in little proliferation of glia without the need for mitotic inhibitors, while supporting the differentiated growth of neurons (Brewer, 1995). One half of the medium was changed twice per week. Cells were plated on plastic dishes coated with 1 mg/ml poly-L-lysine (Sigma) for subsequent RNA and protein extraction, or on poly-L-lysine-coated glass cover slips for immunolocalization. HNs were cultured for different time points (1, 4, 7, 14 and 21 days in vitro (DIV)) prior to analysis. Rat glia-enriched cultures were obtained by the same differential plating procedure mentioned above by maintaining the cells adhering to non-coated culture dishes in DMEM containing 10% FBS and penicillin/streptomycin. Glial cells were harvested when they were confluent.
RT-PCR
Total RNA was isolated from rat brain, HNs and glial cells utilizing the TriZol reagent (Invitrogen) as specified by the manufacturer and previously published (Kip and Strehler, 2003). Reverse transcription was carried out as described (Kip and Strehler, 2003), using 5 μg RNA in a final reaction volume of 50 μl. Five μl of the reverse transcription reaction was used to perform PCR in a final volume of 50 μl that contained 1x PCR buffer, 200 μM dNTPs, 10 pmol each of the primers (Table 1), and 2.5 U Taq Polymerase. The following amplification profiles were used: 5 min initial denaturation at 94°C followed by 40 cycles of 1 min denaturation at 94°C, 1 min of annealing at 54°C, 55°C, 53°C, or 54°C for PMCA1, 2, 3, or 4, respectively, and 1 min of extension at 72°C, followed by a 10 min final extension at 72°C and soak at 4°C. The same RT-PCR profiles were used for NCX and NCKX, except that primer annealing was performed at 55°C and 57°C, respectively. Negative (exclusion of cDNA) and positive controls (inclusion of total brain cDNA) were included in all experiments. In addition, PCR of a house-keeping transcript (GAPDH) was performed as an internal control for the equal loading of template in each lane, yielding a ~250 bp fragment. The amplification protocol was the same as above except that the annealing temperature was 63°C and the cycle number was 35. Following RT-PCR, 10% of the amplicons were electrophoresed on a 1.8% agarose gel along with a molecular weight marker (100 bp ladder, Bio-Rad). The PMCA bands of expected size were excised from the gel, purified using the Qiaquick Gel Extraction Kit (Qiagen, Valencia, CA) and subjected to sequencing in the Mayo Molecular Biology Core Facility to check the specificity of the amplified bands.
Table 1.
Primers for RT-PCR
| Primer name | Primer sequence | Expected product size |
|---|---|---|
| rPMCA1-3382: | 5′-caa tgg ctg tgg tcc ata ttc-3′ | 547 bp (PMCA1a) |
| rPMCA1-3928c: | 5′-gtc atc ttc agc atc agt gtc-3′ | 393 bp (PMCA1b) |
| rPMCA2-3663: | 5′-cac cat ccc tac cag cag gc-3′ | 552 bp (PMCA2a) |
| rPMCA2-3987c: | 5′-cag gtc ggt gtc atc gat g-3′ | 325 bp (PMCA2b) |
| rPMCA3-3686: | 5′-ggg cac ctt tgg aat tca gat-3′ | 562 bp (PMCA3a) |
| rPMCA3-4247c: | 5′-aac tcg ggt gtt gcc atg aag-3′ | 408 bp (PMCA3b) |
| rPMCA4-3295: | 5′-gcc agg tca tct ctg caa tac-3′ | 527 bp (PMCA4a) |
| rPMCA4-3821c: | 5′-atc cgc gac tta gaa gcc aac-3′ | 352 bp (PMCA4b) |
|
| ||
| rNCX1-For: | 5′-taa aac cat tga agg cac agc-3′ | ~400 bp (alt. splice forms) |
| rNXC1-Rev: | 5′-act tcc agc ttg gtg tgt tc-3′ | |
| rNCX2-For: | 5′-tcc ttc cag gac cgc ctg c-3′ | ~350 bp |
| rNCX2-Rev: | 5′-ggc ctc ctc ctc ctc tgc-3′ | |
| rNCX3-For: | 5′-act ttt gaa tgt gat acc att cat-3′ | ~350 bp (alt. splice forms) |
| rNCX3-Rev: | 5′-ttg gcc tcc tct tcc tcc at-3′ | |
|
| ||
| rNCKX2-For: | 5′-gaa gag ccg acg tta ccg aa-3′ | ~440/390 bp (alt. splice forms) |
| rNCKX2-Rev: | 5′-atc atc ttc ctc ggc ggt ct-3′ | |
| rNCKX3-For: | 5′-ctg tct gtg gtc gca ctc att-3′ | ~770 bp |
| rNCKX3-Rev: | 5′-acc ata aac cac ttc tcc cag-3′ | |
| rNCKX4-For: | 5′-gac tct gtg tac tac acg ctc-3′ | ~700 bp |
| rNCKX4-Rev: | 5′-gtg atg aag gtg acc atg aag a-3′ | |
Real-time PCR
The cDNA templates prepared by reverse transcription as described above were used to quantify the PMCA1-4 transcripts by real-time-PCR (Light Cycler, Roche Diagnostic Corporation, Indianapolis, IN) (Higuchi et al., 1993) using a Taq DNA polymerase (Invitrogen) and the PMCA-specific primers listed in Table 2. Universal 18S primers (Ambion, Inc., Austin, TX) were used as a positive control for RNA integrity and as a house-keeping gene for equal loading. To distinguish specific products from non-specific ones as well as from primer dimers, melting curves for PCR amplicons were employed (Higuchi et al., 2002; Ririe et al., 1997). All PCR products were verified on 2% agarose gels, stained with ethidium bromide and photographed using ultraviolet illumination (data not shown).
Table 2.
Primers for real-time PCR
| Primer name | Primer sequence | Product size |
|---|---|---|
| rPMCA1-3842: | 5′-cac aac ttt atg aca cac ccc gag-3′ | 360 bp |
| rPMCA1-4201c: | 5′-tgt gtc ttc tgt tga agt ccg gag-3′ | |
| rPMCA2-6139: | 5′-gga aaa gag cca tag tcc gct g-3′ | 790 bp |
| rPMCA2-6928c: | 5′-ggg gtg aac tgc caa acg tat c-3′ | |
| rPMCA3-4260: | 5′-cta cac cca caa tat tcc gct ca-3′ | 754 bp |
| rPMCA3-5013c: | 5′-gta tag caa agc tcc aaa tag gct c-3′ | |
| rPMCA4-71: | 5′-gtg gga aga acg aag aag ag-3′ | 369 bp |
| rPMCA4-439c: | 5′-tgg gct ttt tcg gag gta tc-3′ |
Quantification of gene expression by real-time PCR was performed using SYBR green as a fluorophore (Molecular Probes Inc.). Following electrophoresis of the PCR product of the expected size and gel-excision of the band of interest, DNA extraction was performed according to the instructions of the DNA elution kit (Qiagen, Valencia, CA). The purified PCR amplicons were quantified using a spectrophotometer (Beckman DU 7400, Beckman Instruments Inc., Fullerton, CA) and readings obtained at 260 nm were used to generate a standard curve to calculate the copy number per ml in the experimental samples. The result was expressed as a ratio of PMCA copies to 18S copies obtained from the same RNA and corresponding cDNA. The data were from two separate experiments, and were pooled from three samples for 7, 14, and 21 DIV cultures and from two samples for 1 DIV cultures.
Preparation of total cell lysates
Plates containing HN and glia cultures at various timepoints were rinsed twice with cold 1x PBS containing no calcium and magnesium but 1x protease inhibitors (aprotinin, leupeptin, pefabloc, and pepstatin). Cells were scraped, pelleted and stored at −80°C until further use. Cell extracts were prepared as previously described (Kip and Strehler, 2003), with minor modifications. Briefly, the thawed cell pellets were resuspended in PBS containing 1% SDS and protease inhibitors, and lysed by pipetting up and down on ice. The samples were subjected to boiling at 100°C for 5 min and centrifuged at 4°C for 15 min at 13,000 g to obtain the supernatant.
Immunoblotting
Protein concentrations were measured spectrophotometrically using the BCA assay (Pierce, Rockwood, IL). Approximately 8 μg of total cell lysate proteins were mixed with Nu-PAGE electrophoresis buffer in the presence of reducing agents and anti-oxidants and heated to 70°C for 15 min before separation in denaturing 4–12% Nu-PAGE gradient gels at 200 V for 50 min. After transfer onto nitrocellulose membranes (1 h, 30 V at RT), immunoblotting was performed using standard Western blotting techniques (Ausubel et al., 1998). Briefly, the membranes were blocked for 1 h at room temperature in 50 mM Tris-HCl, pH 7.4, 150 mM NaCl, 0.05% Tween-20 plus 10% milk prior to exposure to primary antibodies for 1 h at RT. The following primary antibodies were used: 5F10 (1:2,000) and JA9 (1:400) to detect all PMCAs and PMCA4, respectively (Caride et al., 1996), NR-1 (1:200), NR-2 (1:9,000) and NR-3 (1:500) to detect PMCA1, PMCA2 and PMCA3, respectively (Filoteo et al., 1997). In addition, the blots were re-probed with an anti-β-actin antibody (1:1,000) as a house-keeping protein marker to standardize each lane and ensure equal protein loading. Following exposure to primary antibodies, the blots were washed and incubated in peroxidase-conjugated anti-mouse or anti-rabbit IgG (1:5,000, Sigma) as described (Kip and Strehler, 2003). The Renaissance™ chemiluminescence detection system (PerkinElmer Life Sciences) was used to visualize the immunoreactive bands.
Immunofluorescence confocal microscopy
HNs grown on glass coverslips for different time points were washed with PBS minus Ca2+ and Mg2+ (PBS−CM) and fixed for 15 min at RT in PBS−CM containing 4% paraformaldehyde (Tousimis, Rockville, MD) and 4% sucrose. Following three washes of 2 minutes each with PBS−CM, cells were further fixed and permeabilized in ice cold methanol for 15 min at −20°C. After extensive washing with PBS−CM, the cells were blocked for 1 hr at RT in PBS−CM containing 5% normal goat serum and 1% bovine serum albumin and were then incubated for 1 hr at RT with monoclonal pan-anti-PMCA antibody 5F10 diluted 1:6,000 in 10% blocking buffer (in PBS−CM). After washing three times for 5 min in PBS+CM, cells were incubated for 1 hr at RT in darkness with secondary anti-mouse Alexa 488 antibodies (Molecular Probes, Eugene, OR) and rhodamine-phalloidin diluted 1:1,000 in PBS−CM containing 2% bovine serum albumin. Following incubation, cells were washed three times for 5 min with PBS+CM and coverslips were mounted onto slides using Prolong mounting media (Molecular Probes). Confocal micrographs were taken on a Zeiss LSM 510 using an Apochromat 63x oil immersion objective, and captured using Zeiss LSM 510 software. Images were prepared using Adobe Photoshop.
To determine the level of contamination of mature HN cultures by non-neuronal cells, 21 DIV HN cultures were co-stained with a mouse monoclonal antibody against the neuronal marker protein NeuN (1:1,000; Abcam, Cambridge, East Anglia, UK) and with DAPI to visualize all cell nuclei. Anti-mouse Alexa 488 antibodies (1:1,000; Molecular Probes, Eugene, OR) were used as secondary antibodies to detect NeuN-positive cells. Random fields were chosen under the microscope and images were taken of both DAPI and NeuN staining at low (20x) magnification (see Figure 1). NeuN- and DAPI-positive cells were counted in 5 images each from three separate coverslips, and the ratio of NeuN- plus DAPI-positive nuclei to the total number of DAPI-positive nuclei was calculated. 72.5% of DAPI-positive nuclei were also NeuN-positive, indicating a 25–30% contamination of 21 DIV HN cultures by non-neuronal (glial) cells.
Figure 1.

A majority of cells in mature dissociated hippocampal cultures are neurons. 21 DIV cultures were stained with DAPI to visualize all nuclei and with an antibody to NeuN to identify neuronal cells. Most of the nuclei are also NeuN-positive, indicating that these cultures contain only moderate amounts of non-neuronal cells. Scale bar, 10 μm.
Immunohistochemistry
All procedures related to the care and treatment of animals were in accordance with institutional and NIH guidelines. Male Sprague-Dawley rats (postnatal day (PND) 1, 14 and 30; Charles River) were deeply anesthetized with sodium pentobarbital (60 mg/kg, i.p.). Rats were then perfused through the heart with saline (0.9% NaCl), followed after 1 min by 4% freshly-depolymerized paraformaldehyde in phosphate buffer (PB; 0.1 M, pH 7.4) at room temperature. Brains were removed and postfixed for 2 h in the same fixative at 4°C. Transverse sections were cut on a Vibratome at 40–60 μm, collected in PB, and stored at 4°C. Free-floating sections were permeabilized with 50% ethanol for 30 min, then treated for 30 min with 3% H2O2 in phosphate-buffered saline (PBS, 0.1 M, pH 7.4) to quench endogenous peroxidase activity. After preincubation in 10% normal donkey serum (to block secondary antibody binding sites), sections were incubated in primary antibody (NR-1 at 1:100, NR-2 at 1:200, NR-3 at 1:100 and JA9 at 1:1,000) overnight on a shaker at room temperature. Sections were then incubated for 3 hours in biotinylated secondary antibody (1:200; Jackson ImmunoResearch, West Grove, PA) and for 1 hour in ExtrAvidin-peroxidase complex (1:5,000; Sigma, St. Louis, MO); peroxidase was histochemically visualized with diaminobenzidine. Processed sections were mounted on gelatin-coated slides, air dried, cleared with xylene, and coverslipped with D.P.X. mountant (BDH Chemicals, Poole, England).
Control sections were processed through the same immunohistochemical sequence, except that primary or secondary antibodies were omitted, or replaced by irrelevant antisera. These resulted in the lack of labeling, confirming the specificity of the immunohistochemical methods.
Sections were examined with a Leitz DMR microscope under bright field and Nomarski illumination. Images were acquired with a 12-bit cooled charge-coupled device camera (Retiga EX, QImaging, Canada) coupled to a Macintosh computer. Openlab (Improvision Lexington, MA) was used for image acquisition and initial processing. We used Corel Draw v.11 (Corel, Ontario, Canada) to sharpen images, adjust brightness and contrast level, and compose final plates.
Results
Time-dependent upregulation of PMCA transcripts in primary rat hippocampal neuron cultures
To determine which PMCA isoforms are present in developing rat hippocampal neurons and how the expression of the different PMCAs changes during the maturation of these neurons in vitro, we first analyzed the pattern of PMCA transcripts using RT-PCR in cells cultured for 1, 4, 7, 14, and 21 days in vitro (DIV). As shown in Fig. 2, transcripts from all four PMCA genes were detected at the earliest time point. The total transcript levels for each PMCA isoform increased with culture age; in addition, there were remarkable differences in splice variant expression (see below). The increase in the PMCA transcripts in HN cultures reached a maximum by the end of the second week and leveled off by the third week in vitro. This indicates that the neurons had essentially reached a mature state by 14 DIV (Fig. 2), in agreement with the time frame previously demonstrated by others (Craig et al., 1993; Dotti et al., 1988; Rao et al., 1998). Although the HN cultures also contain some non-neuronal (glial) cells (25–30% by 21 DIV, see Fig. 1), glia are not responsible for the strong PMCA upregulation in the developing HNs, as they express only small amounts of PMCA transcripts, mainly for PMCA1 (Fig. 2).
Figure 2.
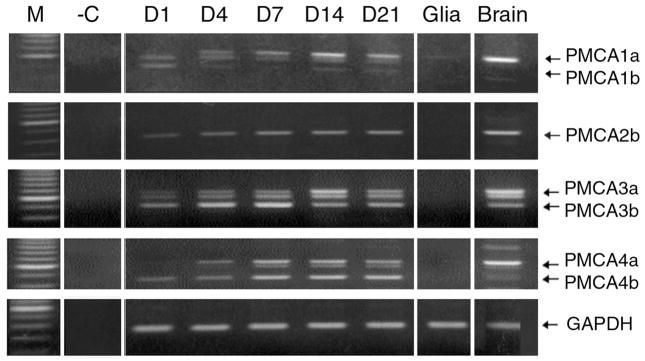
Expression of PMCA transcripts during maturation of hippocampal neurons in vitro. RNA was collected from hippocampal neurons cultured for 1, 4, 7, 14, and 21 days as indicated on top of the lanes, as well as from a confluent glia-enriched culture and total rat brain as positive control. RT-PCR was performed using PMCA isoform-specific primers (see Table 1) flanking the alternative splice site C as described in Materials and Methods. The products were run on 2% agarose gels stained with ethidium bromide. M, 100 bp ladder marker lane; -C, negative control lane omitting template DNA. The positions of the major splice forms “a” and “b” of each PMCA isoform are indicated on the right. The intermediate bands between the “a” and “b” splice forms seen mainly with PMCA3 and PMCA4 are due to a/b heteroduplex formation (Zacharias et al., 1994). GAPDH internal loading controls are shown in the bottom panel.
The PMCA “b” splice variants were abundant in the early stages of development when compared to the “a” variants. PMCA1b was only present in the earliest stages of development, but then showed a marked decrease over time and was almost completely replaced by the PMCA1a variant after one week (Fig 2, top panel). By contrast, PMCA2b transcripts gradually increased with culture age, while PMCA2a remained virtually undetectable even in the fully mature neurons (Fig. 2, second panel from top). PMCA3b and 4b showed a gradual increase by the end of the first week of maturation, and then either declined (PMCA3b) or reached a steady-state (PMCA4b). While the “b” splice variants were differentially regulated with culture age, all of the “a” variants (except PMCA2a) displayed a gradual increase to become the predominant splice variant in mature HNs.
Upregulation of NCX and NCKX transcripts during maturation of hippocampal neurons in vitro
Using primers specific for the transcripts of the three Na+/Ca2+ exchanger (NCX) genes (Table 1), we next determined the expression pattern of NCX1-3 in developing HN cultures. As shown in Fig. 3A, all three NCX genes were abundantly expressed in total brain. As for the PMCAs, all NCX isoforms were expressed in HN cultures, and the transcript levels increased with culture age, peaking at the end of the second week (Fig. 3A). Remarkably, NCX1 and NCX2 were virtually undetectable in the earliest (day 1) cultures, but then increased sharply by 7 DIV. By contrast, NCX3 was already expressed at 1 DIV, and its transcripts showed a more moderate increase with culture age (Fig. 3A). NCX1 and NCX3 transcripts are subject to alternative splicing in the region amplified by the primers chosen for PCR; the splices result in the optional insertion or exclusion of short cassette exons coding for 5–23 amino acids (Quednau et al., 1997). Multiple NCX1 splice forms were expressed in the developing HNs, but the adult brain-specific faster migrating band became the most prominent by 14 DIV (Fig. 3A, top panel). Glia-enriched cultures mainly expressed transcripts for NCX1, and only minor amounts of NCX2 and NCX3 transcripts. Because glia contribute up to 30% of the cells in our mature HN cultures, glia could in part be responsible for the observed NCX1 upregulation in these cultures. However, we determined that the major, faster migrating band in the mature HN cultures corresponds to a different splice variant (NCX1.5, 384 bp PCR product) from the more slowly migrating band prominently present in glia (NCX1.1/11; 423 bp PCR product). Thus, although some of the observed increase in NCX1 expression (particularly of the more slowly migrating 423 bp band) is undoubtedly due to increased glial contamination, there still remains a specific upregulation of NCX1 transcripts during maturation of hippocampal neurons.
Figure 3.

Expression of NC(K)X transcripts during maturation of hippocampal neurons in vitro. A: RT-PCR with NCX-specific primers (Table 1) using RNA from hippocampal neurons cultured for 1, 4, 7, 14, and 21 days, as well as from a confluent glia-enriched culture and total rat brain as positive control. B: RT-PCR with NCKX-specific primers (Table 1) using RNA from hippocampal neurons cultured for 1, 4, 7, 14, and 21 days, as well as from a confluent glia-enriched culture and total rat brain as positive control. The products were run on 2% agarose gels stained with ethidium bromide. M, 100 bp ladder marker lane; -C, negative control lane omitting template DNA. The position of the expected band for each NC(K)X isoform is indicated on the right. Note the presence of multiple alternative splice forms for NCX1 and NCKX2. GAPDH internal loading controls are shown in the bottom panel.
With the exception of the photoreceptor-specific NCKX1, the brain also expresses all known Na+/Ca2+,K+ exchangers (Cai and Lytton, 2004; Kraev et al., 2001; Li et al., 2002; Tsoi et al., 1998). We analyzed the developmental expression of NCKX2-4 transcripts in HNs by RT-PCR (Fig. 3B). NCKX2 (with two major splice forms) was prominently found in adult brain, followed by NCKX3 and, barely detectable, NCKX4. Both splice forms of NCKX2 were readily seen in the earliest (day 1) cultures, and their levels increased steadily until they reached nearly adult levels by the end of the second week (Fig. 3B, top panel), and then appeared to decrease during the third week. NCKX3 transcripts were faintly visible on day 1 and then rapidly increased to reach adult levels by the end of the second week (Fig. 3B, second panel from top). NCKX4 transcripts were virtually undetectable until day 7, when they reached a low-level plateau (Fig. 3B, third panel from top). It should be kept in mind, however, that quantitative comparisons among different isoforms are not permitted based on these RT-PCR results. Glia expressed NCKX2 transcripts, whereas NCKX3 and NCKX4 remained below the detection levels. As noted for NCX1, a proportion of the NCKX2 upregulation in developing HN cultures may be due to glial contamination. However, the contribution by glia cannot explain the robust upregulation of most NCKX transcripts during maturation of the HNs.
Quantitation of the time-dependent PMCA mRNA upregulation by real-time PCR
To obtain a quantitative estimate of PMCA upregulation in HNs over a three-week period of maturation in vitro, we measured the change in PMCA isoform mRNAs by real-time PCR using primers (Table 2) in the flanking regions present in both the “a” and “b” splice variants of each PMCA. In good correlation with the RT-PCR (Fig. 2) and immunoblotting data (see below, Fig. 5), all PMCA messages, expressed as a ratio of PMCA to 18S RNA transcripts, showed an increase as the HNs matured in culture (Fig. 4). Except for PMCA1, which showed maximal increase in transcripts only during the third week in culture, the transcripts for all other PMCA isoforms showed the most accelerated upregulation between the first and second week in culture, although some further increase was still apparent during week 3 for PMCA 2 and 3.
Figure 5.

Expression of PMCA isoform proteins during maturation of hippocampal neurons in vitro. Total cell lysates were prepared from hippocampal neurons cultured for 4, 7, 14, and 21 days, as well as from total rat brain and 21-day glial cultures as indicated on top of each lane. Equal amounts of protein were run on 4–12% Nu-Page gradient gels and processed for Western blotting as described in Materials and Methods. The pan-PMCA antibody 5F10 was used to detect all PMCAs (top panel), and antibodies NR-1, NR-2, NR-3, and JA9 were used to detect PMCA isoforms 1, 2, 3, and 4 as indicated on the right of each panel. Anti-actin antibody was used to probe for β-actin as an internal control for protein loading (bottom panel).
Figure 4.

Real-time PCR quantification of the changes in PMCA transcript levels during development of hippocampal neurons in vitro. Real-time PCR was performed on a Light Cycler using PMCA isoform-specific primers (Table 2) and cDNA templates prepared from hippocampal neurons harvested after 1, 7, 14, and 21 days in vitro (DIV). Primers for 18S RNA were used as internal standard and control. Quantification of PMCA transcript levels relative to 18S RNA transcripts was performed as described in Materials and Methods, and the data are displayed as the mean +/− S.E. of the ratios of specific PMCA transcripts to 18S RNA transcripts. Results are pooled from two separate experiments and from 3 samples for 7, 14, and 21 DIV cultures and from 2 samples for 1 DIV cultures.
Time-dependent upregulation of PMCA protein in primary rat hippocampal neurons in vitro
To determine if the upregulation of PMCA transcripts correlated with a concomitant increase in the expression of the corresponding protein products, Western blots were performed using total cell lysates from HNs kept in culture for up to three weeks. When probed with an antibody recognizing all PMCAs (5F10), a band of the expected size of about 140 kDa was readily observed in brain and glia control samples, and in HNs cultured for 4 to 21 days (Fig. 5, top panel). Although comparable data for day 1 HNs could not be obtained due to the small amount of protein obtained from these very early cultures, a gradual increase in the total PMCA protein content was readily observed over time. Maximum levels of expression were reached by the end of the second week and had changed little by the end of third week (Fig. 5). Similar to the trend observed for all PMCAs, a time-dependent upregulation was noted for the PMCA1, 2, 3, and 4 proteins using isoform-specific antibodies. PMCA 1 and 2 were first detected at an earlier time point (day 4) compared to PMCA 3 and 4, which only became evident by the end of the first week on the immunoblots. However, because of the different affinity and avidity of the isoform-specific antibodies, a direct comparison between isoforms is not permitted. When standardized to β-actin by densitometry, PMCA2 showed the most pronounced upregulation (>10-fold) during the first two weeks in culture, whereas the other isoforms increased by 4–6 fold over the same time period.
Localization of PMCAs during development of hippocampal neurons in vitro
We followed the distribution of the PMCAs in developing hippocampal cultures by confocal immunofluorescence microscopy using an antibody (5F10) against all PMCA isoforms. We also co-stained the neurons with rhodamine-phalloidin to label filamentous actin. This signal allowed us to visualize structures that are hallmarks of neuronal development, such as growth cones and dendritic spines. As shown in Figure 6, PMCA showed a differential distribution pattern in different stages of neuronal development. During early stages (4 DIV), PMCAs are diffusely localized to the cell body and the developing dendrites, and even traffic into actin-rich dendritic growth cones (arrows in Fig. 6A and B). Considerable immunoreactivity is observed in intracellular compartments at this stage. By the middle of the second week, the PMCAs displayed a more distinctive pattern of localization, with most of the staining in the plasma membrane of the soma and dendrites, and some immunoreactivity extending into the developing spines (arrows in Fig. 6C and D). However, some intracellular staining was still observed even at 11 DIV. By 18 DIV, most of the PMCA staining was concentrated in the soma and dendritic membranes, and distinct punctuate staining was observed in actin-rich dendritic spines, characteristic of mature hippocampal neurons (arrows in inset, Fig. 6E and F). Some overlap of the actin signal and PMCA staining was observed at the interface of the dendritic shafts (strongly stained red for actin) and the bulbous head of the dendritic spine (punctuate green signal from PMCA; see inset, Fig. 6E and F). Thus, not only are the PMCA isoforms upregulated during neuronal development, but they are also specifically trafficked to synaptic structures as they develop.
Figure 6.

Immunofluorescence localization of PMCAs in developing hippocampal neurons. Hippocampal neurons were cultured for 4 (A and B), 11 (C and D), or 18 days (E and F), and were then fixed, permeabilized and stained with an antibody (5F10) against all PMCAs and with rhodamine-phalloidin. Secondary antibodies were used to visualize PMCA (green). Panels A, C, and E show PMCA staining only (green channel) whereas panels B, D, and F show dual staining for PMCA and actin. Note the diffuse and largely intracellular localization of the PMCA in cell bodies and early neurites, including dendritic growth cones (arrows in A and B) of immature neurons, the increase in peripheral and clustered PMCA staining in the membrane of developing neurites, and young dendritic spines (arrows in C and D) at day 11, and the appearance of numerous PMCA-positive clusters on dendritic spines co-localizing with actin (yellow puncta, arrows in inset, E and F) in the dendrites of mature neurons. Scale bar = 10 μm.
Cellular localization of PMCA isoforms in the developing rat hippocampus
Finally, we analyzed the developmental expression pattern of the four PMCA isoforms in the developing hippocampus in vivo, using isoform-specific antibodies for immunohistochemistry. In agreement with the transcript and protein data, only weak staining for PMCA1 and PMCA2 and virtually no staining for PMCA3 was seen in sections from 1-day old rats (Fig. 7 and Fig. 8, left panels). PMCA4 staining was associated with poorly-defined structures visible only in early postnatal development. By the end of the second postnatal week, PMCA1 staining in CA1 was evident in the neuropil of stratum oriens, with little immunostaining in cell bodies of the pyramidal cell layer (Fig. 8, middle panel). PMCA2 staining in CA1 exhibited a more uniform laminar distribution with numerous puncta in the neuropil and outlining the periphery of somata in the pyramidal cell layer. PMCA3 staining in CA1 was dramatically increased compared to day 1, especially in stratum radiatum, whereas PMCA4 staining was virtually absent (Fig. 8, middle panel). At 30 days of age, the distribution of PMCA isoforms resembled that found in the adult hippocampus (Burette et al., 2003): PMCA1 and PMCA2 showed intense punctuate staining, uniformly distributed through the neuropil of the hippocampal formation (Fig. 7 and Fig. 8, right panels). PMCA3 staining was strongest in the neuropil of CA3 and dentate gyrus. PMCA4 staining was intense in deep layers of neocortex; within the hippocampal formation, staining was most conspicuous in subiculum; in Ammon’s horn, staining was confined to a few scattered cells that showed prominent labeling of the cell body and dendrites, mainly in stratum pyrimidale of CA3. These data are generally consistent with our findings in cultured hippocampal neurons and demonstrate a characteristic increase in the level of each PMCA isoform as the brain matures.
Figure 7.

Low-magnification views of isoform-specific PMCA staining in the rat hippocampal formation. At postnatal day 1 (PND1), modest staining for PMCA1 and PMCA2 contrasted with very weak staining for PMCA3. PMCA4 stained the granule cell layer of dentate gyrus, but staining was very weak in Ammon’s horn. At PND30, staining was increased for each isoform. Scale bars: 500 μm
Figure 8.

Micrographs showing laminar distribution of isoform-specific PMCA immunostaining in the developing rat hippocampal subfield CA1. Punctuate staining for PMCA1 and 2 was already noticeable by PND1, whereas punctuate staining for PMCA3 was barely detectable until PND 14. PMCA4 stained scattered interneurons late in development. SR, stratum radiatum; PCL, pyramidal cell layer; SO, stratum oriens. Scale bar: 50 μm.
4. Discussion
In vitro cultures of hippocampal neurons are an excellent system for the study of early postnatal neuronal development. These cultures faithfully reproduce many characteristics of developing neurons in vivo, including changes in electrical and excitable properties due to the expression of appropriate voltage-gated and ligand-gated channels and receptors, as well as the formation of mature synapses, as demonstrated both morphologically and functionally (Evans et al., 1998; Goslin and Banker, 1991; Lee and Sheng, 2000). Here, we demonstrate that as hippocampal neurons mature, all major Ca2+ extrusion systems (i.e., the Na+/Ca2+ exchangers and the PMCAs) are strongly upregulated, suggesting that as the calcium load within these cells increases with age, a necessary compensatory reaction occurs, increasing the cell’s capacity to handle and extrude this additional calcium. During neuronal maturation, temporal and spatial control of Ca2+ signaling becomes important for axon pathfinding (Hong et al., 2000; Peterson and Cancela, 2000; Zheng, 2000), neurotransmitter release (Burgoyne and Morgan, 1995), synapse formation, and synaptic signal integration (Sabatini et al., 2001; Zucker, 1999). To counteract the increase in Ca2+ influx systems (i.e., voltage- and ligand-gated Ca2+ channels), differentiating neurons need to increase their Ca2+ removal capacity. This may be achieved by increasing intracellular Ca2+ buffering capacity and/or by upregulating Ca2+ efflux across the plasma membrane.
Detailed studies on the expression of the different Na+/Ca2+ exchanger isoforms during hippocampal development have been lacking thus far. A previous study in rat cortical neurons found that the Na+/Ca2+ exchange activity increased about two-fold between day 3 and 12 in culture (Wang et al., 1997), and this increase was attributed to a corresponding increase in the expression of NCX1. However, in the adult rat hippocampus, all three NCX isoforms were readily detected at the transcript level, with the levels of NCX2 exceeding those of NCX1 by up to an order of magnitude (Li and Lytton, 2002; Yu and Colvin, 1997). More recent studies using isoform-specific antibodies have confirmed the presence of NCX1-3 protein in the adult rat hippocampus (Papa et al., 2003) and in mature (2- to 3-week old) hippocampal neurons in culture (Thurneysen et al., 2002). In agreement with these studies, our data show that the transcripts for all three NCX isoforms are strongly upregulated in hippocampal neurons during the first week in culture.
Most members of the NCKX family of Na+/Ca2+ exchangers have only recently been characterized (Cai and Lytton, 2004; Kraev et al., 2001; Li et al., 2002). Available data suggest that with the exception of the rod photoreceptor-specific NCKX1, all NCKX isoforms are expressed in the brain, with NCKX2 being the major neuronal isoform (Cai and Lytton, 2004; Li and Lytton, 2002; Tsoi et al., 1998). We found that NCKX2 and NCKX3 transcripts were present from the earliest time points (at 1 DIV) and increased steadily over the following 2 weeks in culture, reaching a plateau or even decreasing slightly by the end of week 3. NCKX4 appears to be a minor isoform in developing hippocampal neurons, as its transcripts were essentially undetectable until 7 DIV and remained low throughout neuronal maturation. In overall agreement with these results, Kiedrowski recently found that cultured rat hippocampal CA1 neurons display significant Na+,K+-dependent Ca2+ exchange activity (Kiedrowski, 2004). Taken together, our results show that all isoforms of the NCX and NCKX families of exchangers are upregulated during hippocampal development. However, there are distinct differences in the timing of the appearance of different isoforms, suggesting that they fulfill specialized functions in Ca2+ regulation in the mature neurons. For example, whilst NCX3 and NCKX2 are already present in the youngest, as yet poorly differentiated neurons, NCX2 and NCKX4 appear later in development. It will be interesting to see if these isoforms are targeted to specific subcellular locations such as distal dendrites or axonal membranes. An alternative but not mutually exclusive possibility is that different NC(K)X isoforms are expressed in functionally different neurons in the developing hippocampal cultures. It is known that primary rat hippocampal cultures contain different cell types including excitatory pyramidal neurons, granule cells, as well as inhibitory GABAergic interneurons (Craig et al., 1993; Evans et al., 1998). Isoform-specific antibodies will need to be developed to help answer these questions.
Ca2+ pumps are the second major Ca2+ extrusion system employed by neurons. Like the Na+/Ca2+ exchangers, we found that the PMCAs are substantially upregulated during the maturation of hippocampal neurons. However, in contrast to most NCX and NCKX isoforms, transcripts for all four PMCA isoforms were detected even in the youngest neurons. This may not be surprising for the “housekeeping” PMCA1, but is quite remarkable for the other pump isoforms. PMCA1 is ubiquitously expressed from the earliest developmental stages (Zacharias and Kappen, 1999), and its deletion in “knockout” mice is embryonic lethal (Okunade et al., 2004). All PMCAs are expressed in the adult brain, and transcripts for all isoforms are readily detected in the brain by day 18 of rat and mouse embryonic development (Brandt and Neve, 1992; Zacharias and Kappen, 1999). Thus, because our primary hippocampal neuron cultures were derived from 18 day-old embryos, the detection of transcripts for all PMCAs starting from day 1 could be rationalized. In agreement with a recent study on acutely isolated hippocampi and organotypic hippocampal slice cultures (Jensen et al., 2004), we found that all PMCAs -including the “housekeeping” PMCA1- are strongly upregulated in hippocampal neurons, with peak increases between the first and second week in culture. Data at the protein level are obviously more relevant for the functional implications of PMCA expression. These data show a maximal increase in the expression of PMCA isoforms beginning toward the end of the first week in culture, and reaching steady-state levels by the end of the second week. Overall, this time course coincides well with the peak increase in transcript levels, although differences in protein versus mRNA stability make direct quantitative comparisons unreliable. Two further points deserve attention in discussing the PMCA expression pattern: First, the low level of PMCA expression in glial cultures is intriguing. Our RT-PCR and Western blot data suggest that only PMCA1 and PMCA4 are expressed at detectable levels. This agrees with data on cultured rat cortical astrocytes, which mainly express PMCA1 and 4, and to a lesser degree, PMCA2 (Fresu et al., 1999). Glial cells are important participants in complex neuronal functions such as synaptic transmission and plasticity, and many of these functions are dependent on Ca2+ signaling (Araque et al., 1999; Haydon, 2001). It is tempting to speculate that the difference in abundance of PMCAs in glia versus neurons reflects a fundamental difference in the main Ca2+ signaling pathways in these cell types: Neurons rely heavily on extracellular Ca2+ influx (through voltage- and ligand-gated channels), whereas Ca2+ release from IP3-sensitive intracellular stores appears to be largely responsible for Ca2+ signaling in glia (Haydon, 2001). The second point of interest concerns the shift in PMCA splice variants in developing hippocampal neurons. In the adult hippocampus (and in most adult brain regions), the major splice variant of PMCA1, 3 and 4 corresponds to the “a” type (see also Fig. 2), whereas undifferentiated neurons and most non-excitable cells express almost exclusively the “b” splice forms (Strehler and Zacharias, 2001). The shift from the b- to the a-forms is well reproduced in the hippocampal cultures, supporting the notion that the maturation of these neurons in vitro faithfully reflects the situation in vivo (Jensen et al., 2004). What does this mean for the Ca2+ extrusion properties of mature versus young neurons? PMCA splice variants of the a- and b-type differ in calmodulin activation and other regulatory properties (Strehler and Zacharias, 2001). The b-, but not the a-variants also interact with PDZ domain-containing proteins including the synapse-associated proteins PSD95/SAP90, SAP97, and PSD93/chapsyn-110 (DeMarco and Strehler, 2001; Kim et al., 1998). These interactions may stabilize and retain the PMCAs at the membrane. A shift to the a-form could thus provide a mechanism for the more rapid recycling and redeployment of PMCAs to and from specific membrane domains involved in local Ca2+ signaling. Interestingly PMCA2, which is abundant in mature hippocampal neurons, does not undergo this same shift to a predominant population of a-type forms. It is found in a punctuate pattern in the neuropil of the mature CA1 hippocampus and may thus be a major component of synaptic Ca2+ signaling. The concentration of PMCA immunostaining in dendrites and its partial overlap with actin in spines of mature hippocampal neurons, suggests that some PMCAs, potentially including PMCA2b, are specifically localized in the vicinity of synaptic compartments where they may be involved in the shaping of activity-dependent Ca2+ changes.
The functional specialization in the developing nervous system puts distinct and specific demands on the calcium regulatory “toolkit” that needs to be present in different regions of each neuron. To shape the timing and amplitude of Ca2+ signaling, Ca2+ extrusion systems are equally important to the influx systems, and changes in any of these systems may impact the functional properties of a given neuron. In the presynaptic boutons, local Ca2+ regulation plays a central role in the timing and extent of neurotransmitter release. The Ca2+ pumps and exchangers may be required to “book-end” the pre-synaptic active zone to allow for proper regulation of exocytosis and vesicle endocytosis, which require very different levels of Ca2+ for efficient function (Burgoyne and Morgan, 1995; Cousin and Robinson, 2000). On the postsynaptic dendrites, characteristic morphological and functional changes must occur, such as the stabilization and growth of filopodia into postsynaptic spines accompanied by the development of functionally specialized subcompartments in the spine head, neck and subspinous dendritic area. Postsynaptic Ca2+ signaling is thought to be important in processes such as synapse strengthening or weakening, where the magnitude and duration of individual Ca2+ spikes may be crucial for the final physiological outcome. The relative amount and spatial organization of PMCAs and NC(K)Xs, and the isoform/splice type of each transporter in a cellular compartment are important parameters that govern the overall Ca2+ signaling characteristics within a given neuron. Because different isoforms and/or splice variants of the PMCA (and likely of the NX(K)X as well) are differently regulated by associated proteins and phosphorylation, the complement of Ca2+ extrusion systems expressed in each neuron must be carefully and dynamically controlled. Aberrant expression or a lack of the proper mixture of PMCAs and NC(K)Xs may lead to aberrant neuronal signaling and pathological consequences. As a striking example, defects in PMCA2 expression, function, and subcellular localization in the sensory hair cells of the cochlea and vestibular system lead to deafness and balance problems in mice (Kozel et al., 2002; Kozel et al., 1998; Street et al., 1998; Takahashi and Kitamura, 1999). It will be interesting to determine how the loss or malfunction of specific calcium extrusion systems impacts hippocampal function during development and in the mature brain, and whether the selective impairment of a specific PMCA and/or NC(K)X isoform plays a role in neurological disorders such as schizophrenia, AD and related neurodegenerative and memory-loss disorders.
Acknowledgments
Grant sponsor: National Institutes of Health; Grant number: GM28835 (EES), NS44306 (RJW)
We thank Aida Filoteo and John Penniston for the generous gift of PMCA-specific antibodies, and Jonathan Lytton (University of Calgary, Calgary, Canada) for NCX- and NCKX-specific primers and advice on the identification of NC(K)X isoforms by RT-PCR.
References
- Araque A, Parpura V, Sanzgiri RP, Haydon PG. Tripartite synapses: glia, the unacknowledged partner. Trends Neurosci. 1999;22:208–215. doi: 10.1016/s0166-2236(98)01349-6. [DOI] [PubMed] [Google Scholar]
- Augustine GJ, Santamaria F, Tanaka K. Local calcium signaling in neurons. Neuron. 2003;40:331–346. doi: 10.1016/s0896-6273(03)00639-1. [DOI] [PubMed] [Google Scholar]
- Ausubel FM, Brent R, Kingston RE, Moore DD, Seidman JG, Smith JA, Struhl K. Current Protocols in Molecular Biology. New York, NY: John Wiley and Sons; 1998. [Google Scholar]
- Berridge MJ, Bootman MD, Roderick HL. Calcium signalling: dynamics, homeostasis and remodelling. Nature Rev Mol Cell Biol. 2003;4:517–529. doi: 10.1038/nrm1155. [DOI] [PubMed] [Google Scholar]
- Blaustein MP, Lederer WJ. Sodium/calcium exchange: Its physiological implications. Physiol Rev. 1999;79:763–854. doi: 10.1152/physrev.1999.79.3.763. [DOI] [PubMed] [Google Scholar]
- Brandt P, Neve RL. Expression of plasma membrane calcium-pumping ATPase mRNAs in developing rat brain and adult brain subregions: Evidence for stage-specific expression. J Neurochem. 1992;59:1566–1569. doi: 10.1111/j.1471-4159.1992.tb08476.x. [DOI] [PubMed] [Google Scholar]
- Brandt P, Neve RL, Kammesheidt A, Rhoads RE, Vanaman TC. Analysis of the tissue-specific distribution of mRNAs encoding the plasma membrane calcium-pumping ATPases and characterization of an alternately spliced form of PMCA4 at the cDNA and genomic levels. J Biol Chem. 1992;267:4367–4385. [PubMed] [Google Scholar]
- Brewer GJ. Serum-free B27/neurobasal medium supports differentiated growth of neurons from the striatum, substantia nigra, septum, cerebral cortex, cerebellum, and dentate gyrus. J Neurosci Res. 1995;42:674–683. doi: 10.1002/jnr.490420510. [DOI] [PubMed] [Google Scholar]
- Burette A, Rockwood JM, Strehler EE, Weinberg RJ. Isoform-specific distribution of the plasma membrane Ca2+ ATPase in the rat brain. J Comp Neurol. 2003;467:464–476. doi: 10.1002/cne.10933. [DOI] [PubMed] [Google Scholar]
- Burgoyne RD, Morgan A. Ca2+ and secretory-vesicle dynamics. Trends Neurosci. 1995;18:191–196. doi: 10.1016/0166-2236(95)93900-i. [DOI] [PubMed] [Google Scholar]
- Cai X, Lytton J. Molecular cloning of a sixth member of the K+-dependent Na+/Ca2+ exchanger gene family, NCKX6. J Biol Chem. 2004;279:5867–5876. doi: 10.1074/jbc.M310908200. [DOI] [PubMed] [Google Scholar]
- Carafoli E, Santella L, Branca D, Brini M. Generation, control, and processing of cellular calcium signals. Crit Rev Biochem Mol Biol. 2001;36:107–260. doi: 10.1080/20014091074183. [DOI] [PubMed] [Google Scholar]
- Caride AJ, Filoteo AG, Enyedi A, Verma AK, Penniston JT. Detection of isoform 4 of the plasma membrane calcium pump in human tissues by using isoform-specific monoclonal antibodies. Biochem J. 1996;316:353–359. doi: 10.1042/bj3160353. [DOI] [PMC free article] [PubMed] [Google Scholar]
- Choi DW. Calcium: still center-stage in hypoxic-ischemic neuronal death. Trends Neurosci. 1995;18:58–60. [PubMed] [Google Scholar]
- Cousin MA, Robinson PJ. Ca2+ influx inhibits dynamin and arrests synaptic vesicle endocytosis at the active zone. J Neurosci. 2000;20:949–957. doi: 10.1523/JNEUROSCI.20-03-00949.2000. [DOI] [PMC free article] [PubMed] [Google Scholar]
- Craig AM, Blackstone CD, Huganir RL, Banker GA. The distribution of glutamate receptors in cultured rat hippocampal neurons: postsynaptic clustering of AMPA-selective subunits. Neuron. 1993;10:1055–1068. doi: 10.1016/0896-6273(93)90054-u. [DOI] [PubMed] [Google Scholar]
- DeMarco SJ, Strehler EE. Plasma membrane Ca2+-ATPase isoforms 2b and 4b interact promiscuously and selectively with members of the membrane-associated guanylate kinase family of PDZ (PSD-95/Dlg/ZO-1) domain-containing proteins. J Biol Chem. 2001;276:21594–21600. doi: 10.1074/jbc.M101448200. [DOI] [PubMed] [Google Scholar]
- Dotti CG, Sullivan CA, Banker GA. The establishment of polarity by hippocampal neurons in culture. J Neurosci. 1988;8:1454–1468. doi: 10.1523/JNEUROSCI.08-04-01454.1988. [DOI] [PMC free article] [PubMed] [Google Scholar]
- Dumont RA, Lins U, Filoteo AG, Penniston JT, Kachar B, Gillespie PG. Plasma membrane Ca2+ ATPase isoform 2a is the PMCA of hair bundles. J Neurosci. 2001;21:5066–5078. doi: 10.1523/JNEUROSCI.21-14-05066.2001. [DOI] [PMC free article] [PubMed] [Google Scholar]
- Evans MS, Collings MA, Brewer GJ. Electrophysiology of embryonic, adult and aged rat hippocampal neurons in serum-free culture. J Neurosci Methods. 1998;79:37–46. doi: 10.1016/s0165-0270(97)00159-3. [DOI] [PubMed] [Google Scholar]
- Filoteo AG, Elwess NL, Enyedi A, Caride A, Aung H-H, Penniston JT. Plasma membrane Ca2+ pump in rat brain. Patterns of alternative splices seen by isoform-specific antibodies. J Biol Chem. 1997;272:23741–23747. doi: 10.1074/jbc.272.38.23741. [DOI] [PubMed] [Google Scholar]
- Fitzsimonds RM, Song H-J, Poo M-M. Propagation of activity-dependent synaptic depression in simple neural networks. Nature. 1997;388:439–448. doi: 10.1038/41267. [DOI] [PubMed] [Google Scholar]
- Fresu L, Dehpour A, Genazzani AA, Carafoli E, Guerini D. Plasma membrane calcium ATPase isoforms in astrocytes. Glia. 1999;28:150–155. [PubMed] [Google Scholar]
- Furuta H, Luo L, Hepler K, Ryan AF. Evidence for differential regulation of calcium by outer versus inner hair cells: plasma membrane Ca-ATPase gene expression. Hearing Res. 1998;123:10–26. doi: 10.1016/s0378-5955(98)00091-4. [DOI] [PubMed] [Google Scholar]
- Goslin K, Banker G. Rat hippocampal neurons in low density culture. In: Banker G, Goslin K, editors. Culturing Nerve Cells. Cambridge, MA: MIT Press; 1991. pp. 251–282. [Google Scholar]
- Haydon PG. Glia: listening and talking to the synapse. Nature Rev Neurosci. 2001;2:185–193. doi: 10.1038/35058528. [DOI] [PubMed] [Google Scholar]
- Higuchi H, Bronk SF, Taniai M, Canbay A, Gores GJ. Cholestasis increases tumor necrosis factor-related apoptosis-inducing ligand (TRAIL)-R2/DR5 expression and sensitizes the liver to TRAIL-mediated cytotoxicity. J Pharmacol Exp Therapeutics. 2002;303:461–467. doi: 10.1124/jpet.102.040030. [DOI] [PubMed] [Google Scholar]
- Higuchi R, Fockler C, Dollinger G, Watson R. Kinetic PCR analysis: real-time monitoring of DNA amplification reactions. Bio/Technology. 1993;11:1026–1030. doi: 10.1038/nbt0993-1026. [DOI] [PubMed] [Google Scholar]
- Hong K, Nishiyama M, Henley J, Tessier-Lavigne M, Poo M-M. Calcium signalling in the guidance of nerve growth by netrin-1. Nature. 2000;403:93–98. doi: 10.1038/47507. [DOI] [PubMed] [Google Scholar]
- Jensen TP, Buckby LE, Empson RM. Expression of plasma membrane Ca2+ ATPase family members and associated synaptic proteins in acute and cultured organotypic hippocampal slices from rat. Dev Brain Res. 2004;152:129–136. doi: 10.1016/j.devbrainres.2004.06.004. [DOI] [PubMed] [Google Scholar]
- Kiedrowski L. High activity of K+-dependent plasmalemmal Na+/Ca2+ exchangers in hippocampal CA1 neurons. Neuroreport. 2004;15:2113–2116. doi: 10.1097/00001756-200409150-00023. [DOI] [PubMed] [Google Scholar]
- Kim E, DeMarco SJ, Marfatia SM, Chishti AH, Sheng M, Strehler EE. Plasma membrane Ca2+ ATPase isoform 4b binds to membrane-associated guanylate kinase (MAGUK) proteins via their PDZ (PSD-95/Dlg/ZO-1) domains. J Biol Chem. 1998;273:1591–1595. doi: 10.1074/jbc.273.3.1591. [DOI] [PubMed] [Google Scholar]
- Kip SN, Strehler EE. Characterization of PMCA isoforms and their contribution to transcellular Ca2+ flux in MDCK cells. Am J Physiol. 2003;284:F122–F132. doi: 10.1152/ajprenal.00161.2002. [DOI] [PubMed] [Google Scholar]
- Kozel PJ, Davis RR, Krieg EF, Shull GE, Erway LC. Deficiency in plasma membrane calcium ATPase isoform 2 increases susceptibility to noise-induced hearing loss in mice. Hearing Res. 2002;164:231–239. doi: 10.1016/s0378-5955(01)00420-8. [DOI] [PubMed] [Google Scholar]
- Kozel PJ, Friedman RA, Erway LC, Yamoah EN, Liu LH, Riddle T, Duffy JJ, Doetschman T, Miller ML, Cardell EL, et al. Balance and hearing deficits in mice with a null mutation in the gene encoding plasma membrane Ca2+-ATPase isoform 2. J Biol Chem. 1998;273:18693–18696. doi: 10.1074/jbc.273.30.18693. [DOI] [PubMed] [Google Scholar]
- Kraev A, Quednau BD, Leach S, Li X-F, Dong H, Winkfein R, Perizzolo M, Cai X, Yang RM, Philipson KD, et al. Molecular cloning of a third member of the potassium-dependent sodium-calcium exchanger gene family, NCKX3. J Biol Chem. 2001;276:23161–23172. doi: 10.1074/jbc.M102314200. [DOI] [PubMed] [Google Scholar]
- Krizaj D, DeMarco SJ, Johnson J, Strehler EE, Copenhagen DR. Cell-specific expression of plasma membrane calcium ATPase isoforms in retinal neurons. J Comp Neurol. 2002;451:1–21. doi: 10.1002/cne.10281. [DOI] [PMC free article] [PubMed] [Google Scholar]
- Lee SH, Sheng M. Development of neuron-neuron synapses. Curr Op Neurobiol. 2000;10:125–131. doi: 10.1016/s0959-4388(99)00046-x. [DOI] [PubMed] [Google Scholar]
- Li X-F, Kraev AS, Lytton J. Molecular cloning of a fourth member of the potassium-dependent sodium-calcium exchanger gene family, NCKX4. J Biol Chem. 2002;277:48410–48417. doi: 10.1074/jbc.M210011200. [DOI] [PubMed] [Google Scholar]
- Li X-F, Lytton J. Differential expression of Na/Ca exchanger and Na/Ca+K exchanger transcripts in rat brain. Ann N Y Acad Sci. 2002;976:64–66. doi: 10.1111/j.1749-6632.2002.tb04715.x. [DOI] [PubMed] [Google Scholar]
- Lytton J, Li X-F, Dong H, Kraev A. K+-dependent Na+/Ca2+ exchangers in the brain. Ann N Y Acad Sci. 2002;976:382–393. doi: 10.1111/j.1749-6632.2002.tb04765.x. [DOI] [PubMed] [Google Scholar]
- Mattson MP, Barger SW. Roles for calcium signaling in structural plasticity and pathology in the hippocampal system. Hippocampus. 1993;3:73–87. [PubMed] [Google Scholar]
- Mattson MP, Rydel RE, Lieberburg I, Smith-Swintosky VL. Altered calcium signaling and neuronal injury: stroke and Alzheimer’s disease as examples. Ann N Y Acad Sci. 1993;679:1–21. doi: 10.1111/j.1749-6632.1993.tb18285.x. [DOI] [PubMed] [Google Scholar]
- Okunade GW, Miller ML, Pyne GJ, Sutliff RL, O’Connor KT, Neumann JC, Andringa A, Miller DA, Prasad V, Doetschman T, et al. Targeted ablation of plasma membrane Ca2+-ATPase (PMCA) 1 and 4 indicates a major housekeeping function for PMCA1 and a critical role in hyperactivated sperm motility and male fertility for PMCA4. J Biol Chem. 2004;279:33742–33750. doi: 10.1074/jbc.M404628200. [DOI] [PubMed] [Google Scholar]
- Papa M, Canitano A, Boscia F, Castaldo P, Sellitti S, Porzig H, Taglialatela M, Annunziato L. Differential expression of the Na+-Ca2+ exchanger transcripts and proteins in rat brain regions. J Comp Neurol. 2003;461:31–48. doi: 10.1002/cne.10665. [DOI] [PubMed] [Google Scholar]
- Peterson OH, Cancela JM. Nerve guidance: Attraction or repulsion by local Ca2+ signals. Curr Biol. 2000;10:R311–R314. doi: 10.1016/s0960-9822(00)00438-3. [DOI] [PubMed] [Google Scholar]
- Quednau BD, Nicoll DA, Philipson KD. Tissue specificity and alternative splicing of the Na+/Ca2+ exchanger isoforms NCX1, NCX2, and NCX3 in rat. Am J Physiol. 1997;272:C1250–C1261. doi: 10.1152/ajpcell.1997.272.4.C1250. [DOI] [PubMed] [Google Scholar]
- Rao A, Kim E, Sheng M, Craig AM. Heterogeneity in the molecular composition of excitatory postsynaptic sites during development of hippocampal neurons in culture. J Neurosci. 1998;18:1217–1229. doi: 10.1523/JNEUROSCI.18-04-01217.1998. [DOI] [PMC free article] [PubMed] [Google Scholar]
- Ririe K, Rasmussen RP, Wittwer CT. Product differentiation by analysis of DNA melting curves during the polymerase chain reaction. Anal Biochem. 1997;245:154–160. doi: 10.1006/abio.1996.9916. [DOI] [PubMed] [Google Scholar]
- Sabatini BL, Maravall M, Svoboda K. Ca2+ signaling in dendritic spines. Curr Op Neurobiol. 2001;11:349–356. doi: 10.1016/s0959-4388(00)00218-x. [DOI] [PubMed] [Google Scholar]
- Sattler R, Tymianski M. Molecular mechanisms of calcium-dependent excitotoxicity. J Mol Med. 2000;78:3–13. doi: 10.1007/s001090000077. [DOI] [PubMed] [Google Scholar]
- Stahl WL, Eakin TJ, Owens JWM, Breininger JF, Filuk PE, Anderson WR. Plasma membrane Ca2+-ATPase isoforms: distribution of mRNAs in rat brain by in situ hybridization. Molec Brain Res. 1992;16:223–231. doi: 10.1016/0169-328x(92)90229-5. [DOI] [PubMed] [Google Scholar]
- Stauffer TP, Guerini D, Carafoli E. Tissue distribution of the four gene products of the plasma membrane Ca2+ pump. A study using specific antibodies. J Biol Chem. 1995;270:12184–12190. doi: 10.1074/jbc.270.20.12184. [DOI] [PubMed] [Google Scholar]
- Stauffer TP, Guerini D, Celio MR, Carafoli E. Immunolocalization of the plasma membrane Ca2+ pump isoforms in the rat brain. Brain Res. 1997;748:21–29. doi: 10.1016/s0006-8993(96)01282-6. [DOI] [PubMed] [Google Scholar]
- Street VA, McKee-Johnson JW, Fonseca RC, Tempel BL, Noben-Trauth K. Mutations in a plasma membrane Ca2+-ATPase gene cause deafness in deafwaddler mice. Nature Genetics. 1998;19:390–394. doi: 10.1038/1284. [DOI] [PubMed] [Google Scholar]
- Strehler EE, Zacharias DA. Role of alternative splicing in generating isoform diversity among plasma membrane calcium pumps. Physiol Rev. 2001;81:21–50. doi: 10.1152/physrev.2001.81.1.21. [DOI] [PubMed] [Google Scholar]
- Takahashi K, Kitamura K. A point mutation in a plasma membrane Ca2+-ATPase gene causes deeafness in wriggle mouse Sagami. Biochem Biophys Res Commun. 1999;261:773–778. doi: 10.1006/bbrc.1999.1102. [DOI] [PubMed] [Google Scholar]
- Thurneysen T, Nicoll DA, Philipson KD, Porzig H. Sodium/calcium exchanger subtypes NCX1, NCX2 and NCX3 show cell-specific expression in rat hippocampal cultures. Mol Brain Res. 2002;107:145–156. doi: 10.1016/s0169-328x(02)00461-8. [DOI] [PubMed] [Google Scholar]
- Tsoi M, Rhee K-H, Bungard D, Li X-F, Lee S-L, Auer RN, Lytton J. Molecular cloning of a novel potassium-dependent sodium-calcium exchanger from rat brain. J Biol Chem. 1998;273:4155–4162. doi: 10.1074/jbc.273.7.4155. [DOI] [PubMed] [Google Scholar]
- Wang C, Davis N, Colvin RA. Genistein inhibits Na+/Ca2+ exchange activity in primary rat cortical neuron culture. Biochem Biophys Res Commun. 1997;233:86–90. doi: 10.1006/bbrc.1997.6398. [DOI] [PubMed] [Google Scholar]
- Yu L, Colvin RA. Regional differences in expression of transcripts for Na+/Ca2+ exchanger isoforms in rat brain. Mol Brain Res. 1997;50:285–292. doi: 10.1016/s0169-328x(97)00202-7. [DOI] [PubMed] [Google Scholar]
- Zacharias DA, Dalrymple SJ, Strehler EE. Transcript distribution of plasma membrane Ca2+ pump isoforms and splice variants in the human brain. Molec Brain Res. 1995;28:263–272. doi: 10.1016/0169-328x(94)00215-z. [DOI] [PubMed] [Google Scholar]
- Zacharias DA, Garamszegi N, Strehler EE. Characterization of persistent artifacts resulting from RT-PCR of alternatively spliced mRNAs. BioTechniques. 1994;17:652–655. [PubMed] [Google Scholar]
- Zacharias DA, Kappen C. Developmental expression of the four plasma membrane calcium ATPase (Pmca) genes in the mouse. Biochim Biophys Acta. 1999;1428:397–405. doi: 10.1016/s0304-4165(99)00058-6. [DOI] [PubMed] [Google Scholar]
- Zheng JQ. Turning of nerve growth cones induced by localized increases in intracellular calcium ions. Nature. 2000;403:89–93. doi: 10.1038/47501. [DOI] [PubMed] [Google Scholar]
- Zucker RS. Calcium- and activity-dependent synaptic plasticity. Curr Op Neurobiol. 1999;9:305–313. doi: 10.1016/s0959-4388(99)80045-2. [DOI] [PubMed] [Google Scholar]