

Sphingolipids play crucial roles in the determination of growth and survival of eukaryotic cells. The budding yeast protein kinase Sch9 is not only an effector, but also a regulator of sphingolipid metabolism. This new function provides a crucial link between nutrient and sphingolipid signaling.
Abstract
The Saccharomyces cerevisiae protein kinase Sch9 is an in vitro and in vivo effector of sphingolipid signaling. This study examines the link between Sch9 and sphingolipid metabolism in S. cerevisiae in vivo based on the observation that the sch9Δ mutant displays altered sensitivity to different inhibitors of sphingolipid metabolism, namely myriocin and aureobasidin A. Sphingolipid profiling indicates that sch9Δ cells have increased levels of long-chain bases and long-chain base-1 phosphates, decreased levels of several species of (phyto)ceramides, and altered ratios of complex sphingolipids. We show that the target of rapamycin complex 1–Sch9 signaling pathway functions to repress the expression of the ceramidase genes YDC1 and YPC1, thereby revealing, for the first time in yeast, a nutrient-dependent transcriptional mechanism involved in the regulation of sphingolipid metabolism. In addition, we establish that Sch9 affects the activity of the inositol phosphosphingolipid phospholipase C, Isc1, which is required for ceramide production by hydrolysis of complex sphingolipids. Given that sphingolipid metabolites play a crucial role in the regulation of stress tolerance and longevity of yeast cells, our data provide a model in which Sch9 regulates the latter phenotypes by acting not only as an effector but also as a regulator of sphingolipid metabolism.
INTRODUCTION
Sphingolipids, together with sterols and glycerophospholipids, are essential components of all eukaryotic membranes. Much of the progress in the understanding of sphingolipid metabolism is due to research performed in the budding yeast Saccharomyces cerevisiae, in which most, if not all, of the enzymes involved in sphingolipid metabolism have been identified (Figure 1; Funato et al., 2002; Sims et al., 2004; Dickson et al., 2006). Apart from their structural function, sphingolipids also play important regulatory roles. More specifically, in yeast, sphingolipids are involved in the regulation of cellular processes as diverse as cell growth, endocytosis, actin cytoskeleton organization, protein trafficking, cell wall integrity, nutrient uptake, and longevity (Dickson, 2010). In these processes, signaling functions are ascribed not only to the complex sphingolipid species, but also to the intermediate metabolites, that is, the long-chain bases (LCBs), the long-chain base 1-phosphates (LCBPs), and ceramide species. Accumulating evidence in yeast and mammalian model systems strongly suggests that the dynamic balance between the different sphingolipid metabolites, often referred to as the LCB(P)/ceramide rheostat or sphingolipid rheostat, is an important factor determining their regulatory action (Kobayashi and Nagiec, 2003; Kihara et al., 2007; Dickson, 2008; Matmati and Hannun, 2008; Breslow and Weissman, 2010; Bikman and Summers, 2011; Van Brocklyn and Williams, 2012). As such, proper regulation of this balance is key to cellular survival, and recent reports have shed some light on the molecular mechanisms by which yeast controls this balance. For instance, the yeast Orm1 and Orm2 proteins are crucial regulators of sphingolipid homeostasis by controlling the activity of the serine palmitoyl transferase (SPT) enzyme, which catalyzes the first and rate-limiting step in de novo synthesis of sphingolipids. Orm1/2 are members of the conserved ORMDL family of endoplasmic reticulum (ER) membrane proteins (ORMDL 1/2/3 genes in humans) and physically interact with SPT, inhibiting the activity of the enzyme (Breslow et al., 2010; Han et al., 2010). This inhibitory action is abrogated through Orm1/2 phosphorylation by the protein kinase Ypk1 (Roelants et al., 2011). When sphingolipid levels drop—for example, when cells are treated with the SPT inhibitor myriocin—the target of rapamycin complex 2 (TORC2) kinase activates Ypk1, boosting de novo sphingolipid synthesis to counteract dropping sphingolipid levels. In addition, the increase in LCB accumulation on heat shock is also dependent on Ypk1’s action, downstream of the Pkh1/2 kinases (Sun et al., 2012).
FIGURE 1:

Schematic representation of sphingolipid biosynthesis (adapted from Dickson, 2008). A schematic representation of the de novo biosynthesis pathway for sphingolipids, with the genes encoding for the involved enzymes in italic and both the complex sphingolipids and the different intermediates of sphingolipid biosynthesis in bold. Used inhibitors of sphingolipid biosynthesis are shown. Changes in sphingolipid profile for the sch9Δ strain, compared with the WT strain, are indicated with closed arrows for LCB and ceramide species (see Figure 3 for results) and open arrows for complex sphingolipids (see Figure 7 for results).
Interestingly, as yeast cells approach stationary phase, they accumulate LCBs and LCBPs as well (Lester et al., 2013). This increase may also be mediated in part by an increase in SPT activity, although additional mechanisms, such as a decrease in ceramide synthase activity as cells enter the stationary phase, were also demonstrated. Although phosphorylation of the Orm proteins depends on the rapamycin-sensitive, nutrient-responsive TORC1 kinase, recent evidence shows that these phosphorylation sites are distinct from those regulated by myriocin treatment, indicating that TORC1 and TORC2 have distinct roles in the control of the Orm proteins (Liu et al., 2012; Shimobayashi et al., 2013). Indeed, rapamycin-induced phosphorylation of Orm1/2 did not seem to affect SPT activity. Instead, a stimulation of complex sphingolipid synthesis was observed, through as-yet-unknown mechanisms. Additional evidence for a nutrient-dependent regulation of complex sphingolipid levels comes from a recent lipidomic approach, in which it was shown that relative levels of different complex sphingolipid species change as yeast cells enter the stationary phase (Klose et al., 2012).
To help coordinate cellular responses to changing nutrient levels, yeast depends on Sch9, a protein kinase with a central role in the carbon and nitrogen source–dependent signaling pathway that controls cell growth, longevity, and stress resistance (Toda et al., 1988; Crauwels et al., 1997; Fabrizio et al., 2001; Roosen et al., 2005; Smets et al., 2008, 2010). Sch9 performs this function, in part, by acting as an effector of the TORC1 complex (Urban et al., 2007), although several studies indicated that Sch9 also acts independently of TORC1 (Yorimitsu et al., 2007; Smets et al., 2008). Like Ypk1/2, Sch9 can be phosphorylated by Pkh1 and Pkh2 at its PDK1 site in its activation loop, and this phosphorylation is indispensable for its function (Roelants et al., 2004; Urban et al., 2007; Voordeckers et al., 2011). In line with the suggested activation of Pkh1/2 by the long-chain base phytosphingosine (PHS), the phosphorylation and activation of Sch9 by Pkh1 is enhanced in vitro by the addition of PHS (Liu et al., 2005) and lowered in vivo by pharmacological or genetic reduction of sphingolipid synthesis (Huang et al., 2012; Liu et al., 2013). Hence these results indicate that Sch9 is an effector of sphingolipid signaling.
In this study, we examine the link between Sch9 and sphingolipid metabolism in more detail. Our data demonstrate that Sch9 has a regulatory role in de novo ceramide biosynthesis and ceramide production by hydrolysis of complex sphingolipids. We provide evidence for a transcriptional regulatory mechanism in which Sch9 is required to repress ceramidase activity during growth by acting downstream of the TORC1 kinase. In addition, for hydrolytic ceramide production, Sch9 is essential for the proper translocation of the inositol phosphospingolipid phospholipase C, Isc1, from the ER to mitochondria during the diauxic shift. As such, Sch9 appears to be the gatekeeper of a monitoring system required to balance biosynthetic and hydrolytic ceramide production. We illustrate and discuss some of the phenotypic repercussions associated with this role of Sch9, focusing on mitochondrial activity, oxidative stress, aging, and longevity. Given the function of Sch9 in nutrient signaling and the fact that sphingolipids mediate Pkh-dependent phosphorylation and activation of Sch9, one obvious conclusion is that Sch9 is part of a feedback system balancing the sphingolipid rheostat in response to both internal sphingolipid signals and nutrient availability.
RESULTS
Deletion of SCH9 confers resistance to myriocin and increases sensitivity to aureobasidin A and phytosphingosine
To investigate the potential relationship between Sch9 and sphingolipid mediated signaling, we compared myriocin resistance of wild-type (WT) cells and isogenic sch9Δ mutants. Myriocin is an inhibitor of serine palmitoyl transferase (Figure 1), the primary enzyme in sphingolipid biosynthesis, encoded by LCB1, LCB2, and TSC3 (Miyake et al., 1995; Sun et al., 2000). The analysis was performed in two genetic backgrounds, W303-1A and BY4741, to ensure that the observed effects were not related to the background used. The analysis also compared the use of different selection markers to create the deletion of SCH9 in order to exclude possible marker effects. In all cases we found that cells lacking Sch9 displayed an increased myriocin resistance, as visualized by spot assays (Figure 2A). Overexpression of SCH9 in the sch9Δ mutant restored myriocin sensitivity (Figure 2B), indicating that the presence or absence of a functional Sch9 is the only factor that contributes to the observed differences in myriocin resistance. To evaluate whether increased myriocin resistance reflects increased survival, we performed a propidium iodide (PI) staining on WT cells and sch9Δ cells treated with 0.5 μg/ml myriocin. As shown in Figure 2C, the viability of sch9Δ cells was hardly affected by myriocin treatment (0.7 ± 0.3% dead cells), whereas that of WT cells was markedly decreased (23.8 ± 3.4% dead cells). Next we examined the effect of myriocin on the expression of ribosomal protein genes. Expression of these genes is tightly coupled to growth conditions, as they are induced under favorable conditions but repressed under adverse conditions. As expected, myriocin treatment triggered a significant decrease of ribosomal protein gene expression in WT cells, but had no effect in sch9Δ cells (Figure 2D).
FIGURE 2:

Deletion of SCH9 confers resistance to myriocin and increases sensitivity to phytosphingosine and aureobasidin A. (A) Serial dilutions of exponentially growing wild-type and sch9Δ cells of two different genetic backgrounds (BY4741 and W303-1A) and with different markers were spotted on YPD and on YPD containing 0.5 μg/ml myriocin. (B) Serial dilutions of sch9Δ cells (BY4741 background, JW 01 306), transformed with YEpLac195 (ev) or YEpLac195/SCH9 (SCH9) were spotted on YPD and on YPD containing 0.5 μg/ml myriocin. (C) Exponentially growing wild-type (W303-1A background) and sch9Δ (JW 01 418) cells were treated for 2 h with 0.5 μg/ml myriocin and stained with propidium iodide to visualize dead cells. Results are mean values ± SD of three independent cultures. At least 200 cells were counted for each experiment. (D) Northern blot analysis of the myriocin (0.5 μg/ml)-induced transcriptional response in wild-type (W303-1A) and sch9Δ (JW 00 035) cells of two typical ribosomal protein genes, RPS10a and RPL30. 18S was used as a loading control. Samples were taken at the indicated time points. (E) Growth of wild-type (W303-1A; closed symbols) and sch9Δ (JW 00 035; open symbols) cells was monitored during growth on YPD without or with supplementation of the indicated amounts of PHS. To dissolve PHS, 0.0015% of the detergent Nonidet P-40 was added together with PHS. (F) Sensitivity of wild-type (W303-1A) and sch9Δ (JW 00 035) cells to aureobasidin A (1 mg/ml), as assessed via a growth-inhibitory halo assay on YPD agar plates.
We then investigated the sensitivity of WT and sch9Δ cells to PHS. Maintaining the balance in intermediary sphingolipid metabolites is of utmost importance for cell growth and survival. Addition of low concentrations of PHS rescues myriocin toxicity (Sun et al., 2000), whereas addition of high concentrations of PHS inhibits cell growth (Ella et al., 1997; Skrzypek et al., 1998; Chung et al., 2001). Analysis of the growth of sch9Δ mutant and WT cells in the presence of different concentrations of PHS revealed that sch9Δ mutant cells are more sensitive to the growth-inhibitory effect of PHS than WT cells (Figure 2E), suggesting that cells lacking Sch9 already have higher internal pools of LCBs and LCBPs. In line with this are the data obtained upon monitoring the effect of the fungicide aureobasidin A. This fungicide inhibits Aur1 (Figure 1), an enzyme responsible for the production of the complex sphingolipid inositolphosphoryl ceramide (IPC; Heidler and Radding, 1995). The toxicity of aureobasidin A is due not only to the inhibition of the synthesis of complex sphingolipids, but also to the accumulation of LCBs (Nagiec et al., 1997). Consistently, we observed that the sch9Δ mutant was more sensitive to aureobasidin A than the WT strain (Figure 2F).
Deletion of SCH9 alters the LCB(P)/ceramide balance
To evaluate the hypothesis that cells lacking Sch9 have higher levels of intermediary sphingolipid metabolites and thus that Sch9 may function as modulator of sphingolipid metabolism in vivo, we determined the levels of PHS and dihydrosphingosine (DHS), their phosphates, phytosphingosine-1-phosphate (PHS-P) and dihydrosphingosine-1-phosphate (DHS-P), and the levels of (phyto)ceramides in the membranes of the WT and the sch9Δ strain. Compared to the WT strain, sch9Δ cells were characterized by increased levels of DHS, PHS, and PHS-P, whereas levels of DHS-P remained below the detection limit (Figure 3A). Conversely, the concentrations of the ceramides C18-dihydroceramide, C20-dihydroceramide, and C26-phytoceramide were decreased in sch9Δ cells (Figure 3, B and C), as was the amount of α-hydroxylated phytoceramide (αOH-PhytoCer-C26; Figure 3D). Thus, these data suggest that the Sch9 protein kinase fulfils a regulatory role to maintain de novo ceramide synthesis.
FIGURE 3:

The levels of LCBs, LCB-phosphates, and ceramides are altered in sch9Δ cells. Sphingolipids were purified from wild-type (W303-1A; closed bars) and sch9Δ (JW 01 418; open bars) cells growing exponentially in YPD medium, analyzed by LC-MS, and normalized by organic phosphates: (A) Phytosphingosine and dihydrosphingosine bases and their phosphates, (B) dihydroceramide species (DHCer) with acyl chains of different length, (C) phytoceramide species (PhytoCer) with acyl chains of different length, and (D) αOH-PhytoCer with acyl chains of different length. The results are mean values ± SD of lipid measurements from three independent cultures measured in duplicate.
An increase of LCB(P)s in sch9Δ cells could be the result of an increase in SPT activity, perhaps through phosphorylation of the Orm proteins. However, in this case we would expect that also ceramide levels would have increased, as shown before for the orm1Δ orm2Δ strain (Breslow et al., 2010; Shimobayashi et al., 2013). Alternatively, Sch9 could also be involved in very long-chain fatty acid formation, which serves as a substrate in the ceramide production (Figure 1). As such, the LCB(P)s may accumulate due to the inability to react with very long-chain fatty acids to form ceramides, as is the case in sur4Δ cells (Breslow et al., 2010). However, we present genetic evidence that SCH9 and SUR4 work in parallel pathways, making this possibility unlikely (Supplemental Figure S1, B and C). Therefore a more obvious explanation is that Sch9 plays a role at the step of ceramide production or breakdown. This is supported by our genetic data showing that deletion of either gene encoding ceramidase (YDC1 or YPC1) abrogates myriocin resistance of the sch9Δ strain (Supplemental Figure S1A), as does overexpression of the ceramide synthase LAG1 or LAC1 (Supplemental Figure S1D). To have a closer look at the enzymes involved in ceramide production and breakdown, we constructed WT and sch9Δ strains expressing chromosomally encoded, Myc-tagged versions of Lag1, Lac1, Ydc1, and Ypc1 and analyzed their protein levels. We included the addition of rapamycin in these experiments, as this compound is well known for its ability to inactivate TORC1, a major nutrient-dependent activator of Sch9 (Urban et al., 2007). Results in Figure 4 indicate that either deleting SCH9 or treating WT cells with rapamycin increases the presence of the ceramidases Ydc1 and Ypc1. Because this effect of rapamycin addition is abrogated in sch9Δ cells, this suggests that Sch9 functions to repress ceramidase levels downstream of TORC1. Concerning the levels of the ceramide synthases, we also observed an increase in the levels of Lag1 and Lac1 in the sch9Δ strain, although the effects on Lac1 were not statistically significant. Of importance, this increase in Lag1/Lac1 levels is not seen when treating WT or sch9Δ cells with rapamycin. One possible explanation is that Sch9 might specifically regulate ceramide synthase levels, independent of TORC1. Note, however, that the rapamycin treatment represents a short-term response to TORC1 inactivation, whereas conditions for the sch9Δ strain represent a steady state of this strain during growth. Therefore, an alternative explanation is that during steady-state growth under nutrient-rich conditions, the increased abundance of ceramidase enzymes in the sch9Δ strain may trigger additional (TORC1-independent) homeostatic mechanisms, which increase Lag1/Lac1 levels to try to compensate the imbalanced sphingolipid rheostat. Because elevated levels of phosphorylated LCBs act as inhibitory to growth (Kim et al., 2000), this compensatory response could function to reduce LCB(P) levels to some extent to avoid complete growth inhibition.
FIGURE 4:

Sch9 affects protein levels of enzymes involved in de novo ceramide synthesis and breakdown. Genes encoding the enzymes of ceramide synthase (LAG1 and LAC1) or ceramidase (YDC1 or YPC1) were genomically tagged with a 9Myc tag in both WT BY4741 and sch9Δ (JW 03 038) strains. Overnight precultures were inoculated at initial OD600 of 0.3 and grown to OD600 of 2.0, after which a sample was withdrawn for protein extraction (noted as –). The remainder of the culture was treated with 200 nM rapamycin and grown for an additional 1 h, after which a second sample for protein extraction was taken (noted as +). After TCA protein extraction, equal protein amounts were run on a SDS–PAGE. Tagged enzymes were detected using an anti-Myc antibody; the yeast Adh2 serves as an internal control. Representative results for Western blots are shown for (A) Lag1-9Myc, (B) Lac1-9Myc, (C) Ydc1-9Myc, and (D) Ypc1-9Myc. Signals for Myc detection were quantified and normalized for Adh2 levels. Average results of two or three independent cultures are shown in E, with SD shown as error bars. Statistical significance was determined by unpaired t tests for effects between the WT and sch9Δ strains, and paired t tests for effects of rapamycin. Because several experimental manipulations in Western blot experiments, such as variations in blotting efficiency, antibody activity, and so on, increase variability not related to the intrinsic properties of the protein samples, we set the threshold for statistical significance at p < 0.1 instead of the usual threshold of p < 0.05. Results of the t tests are shown as ^p < 0.1, *p < 0.05, and ***p < 0.001.
Sch9 controls de novo ceramide synthesis via transcriptional regulation mechanisms
To investigate whether the changes in protein levels under our experimental conditions reflect a transcriptional response, we constructed lacZ reporter fusions with the promoters of LAG1, LAC1, YDC1, and YPC1 in the multicopy plasmid Yep357. First, Figure 5A shows that deletion of SCH9 indeed results in a significant induction in reporter activity for both the ceramide synthase promoters, LAG1 and LAC1, as for the ceramidase promoters YDC1 and YPC1. This induction in the sch9Δ strain was higher for the ceramidase promoters compared with the induction of the promoters of the ceramide synthase genes, and as such correlates with our observation that the increase in protein levels for Ydc1-Myc and Ypc1-Myc is larger than the increases in Lag1-Myc and Lac1-Myc levels in the sch9Δ strain (Table 1). Second, treatment of the WT strain with rapamycin resulted in significant transcriptional induction in ceramidase promoter activity for both the YDC1 and YPC1 reporters, whereas such an induction was absent for both the LAG1 and LAC1 reporters (Figure 5B). The fact that derepression of the ceramidase enzymes is higher in sch9Δ cells than in WT cells treated with rapamycin might be due to the fact that our rapamycin treatment does not result in a complete inactivation of Sch9, especially in the BY4741 strain, which is more resistant to rapamycin treatment than most other backgrounds. Finally, the rapamycin-induced effect on the YDC1 and YPC1 reporters was abrogated in the sch9Δ strain (Figure 5C). As such, the effects on the Myc-tagged protein levels shown in Figure 4 are recapitulated on a transcriptional level by our lacZ results shown in Figure 5. Thus, Sch9 seems, indeed, to be the downstream effector of the TORC1 kinase in the transcriptional control of ceramidase expression. However, one may argue that the absence of rapamycin-induced expression of the YDC1 and YPC1 reporters in the sch9Δ strain may be due to an already complete derepression of promoter activity. Furthermore, induction of ceramidase promoter activity by rapamycin treatment in the WT strain might be due to Sch9-dependent and -independent effects, for instance through the Tap42 signaling branch of TORC1 (Smets et al., 2010). To further demonstrate that Sch9 is the principal mediator of the observed rapamycin effects, we used SCH9 constructs in which specifically the five TORC1 phosphorylation sites were mutated (Urban et al., 2007). Mutation of these sites to alanine (SCH95A) results in the expression of an inactive Sch9 protein that cannot be phosphorylated by TORC1. On the other hand, mutation of these sites to aspartic (D) or glutamic (E) acid (SCH92D3E) results in the expression of a variant of Sch9 that mimics a constitutively phosphorylated, and therefore active, Sch9, which cannot be inactivated by rapamycin treatment (Urban et al., 2007). We subcloned these SCH9 variants, along with the wild-type SCH9 gene, into the pRS415 vector to allow for coexpression with our YDC1- and YPC1-lacZ constructs in the sch9Δ strain. As shown in Figure 6, coexpression of the ceramidase lacZ constructs with wild-type SCH9 in the sch9Δ strain can complement the high basal lacZ activity observed with the empty vector (pRS415), as well as restore rapamycin induction of promoter activity. Furthermore, expressing the inactive SCH95A variant mimics the empty vector situation, demonstrating that phosphorylation of Sch9 by TORC1 is required for keeping basal promoter activities in check. Further induction by rapamycin is also abolished in cells expressing this SCH95A construct. Expressing the phospho-mimic SCH92D3E variant, on the other hand, results in basal promoter activities, comparable to those observed when expressing the wild-type SCH9 gene (Figure 6). They are somewhat elevated compared with the wild-type gene, likely due to the slight differences in in vivo conformation between the phospho-mimic and truly phosphorylated Sch9. Still, comparing basal promoter activities of cells expressing SCH95A and SCH92D3E clearly demonstrates the importance of phosphorylation of the TORC1-dependent residues of Sch9 in regulating ceramidase promoter activity. Intriguingly, rapamycin-mediated induction of YDC1- and YPC1-lacZ activity is completely lost in cells expressing the SCH92D3E variant, indicating that this induction by rapamycin requires a loss in phosphorylation of Sch9 by TORC1. Also, these results argue against additional effectors besides Sch9 in mediating the rapamycin effect.
FIGURE 5:
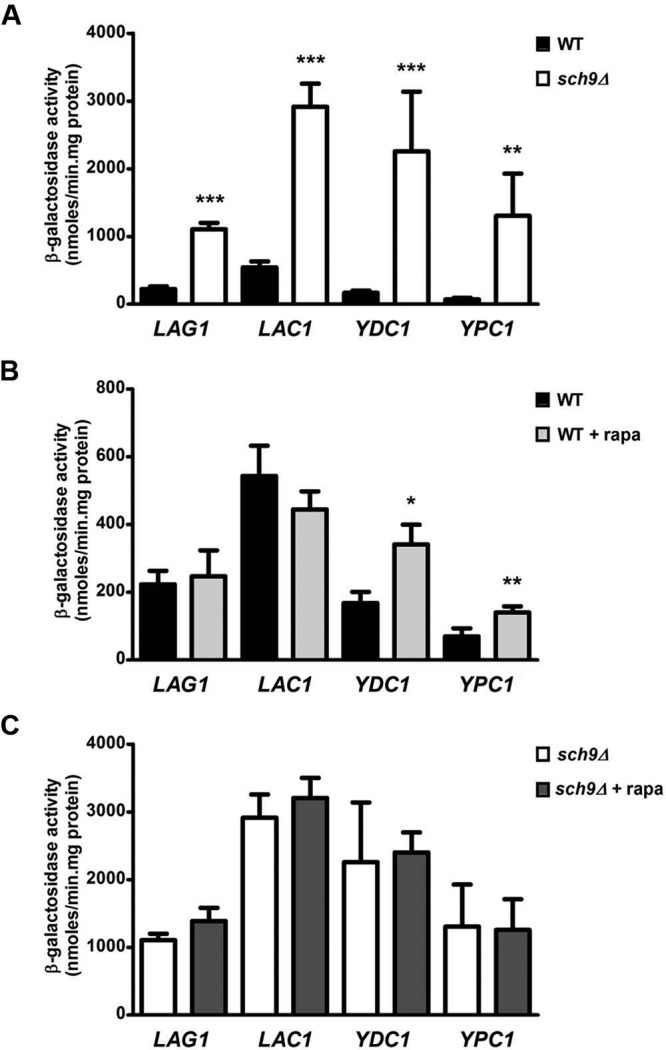
Transcriptional control by Sch9 of genes encoding enzymes involved in de novo ceramide synthesis and breakdown. Promoters of genes LAG1, LAC1, YDC1, and YPC1 were cloned into the lacZ reporter plasmid YEp357 as described in Materials and Methods and transformed into the WT BY4741 and sch9Δ (JW 03 038) strains. Precultures were grown overnight in SD-URA, inoculated into YPD medium, and grown for 6–7 h, after which part of the culture was treated with 200 nM rapamycin. After 1 h, samples of treated and untreated cells were pelleted at 4°C and stored at −80°C. Protein extracts were prepared, and specific activities were determined. Results are expressed as mean of four independent transformants, with SD noted as error bars. Results displayed in A indicate a significant increase in lacZ activities in the sch9Δ strain compared with the WT strain (**p < 0.01, ***p < 0.001, unpaired t test). Rapamycin-dependent effects in WT and sch9Δ cells are separately displayed in B and C, respectively, for extra clarity. Only in the WT strain was there a significant increase in YDC1- and YPC1-lacZ activities observed after addition of rapamycin to the cells (*p < 0.05, **p < 0.01, paired t test).
TABLE 1:
Effects of SCH9 deletion and rapamycin addition on protein levels and lacZ promoter constructs.
| Proteina | Fold increase | Significance | lacZ constructb | Fold increase | Significance |
|---|---|---|---|---|---|
| Fold increase in sch9Δ vs. WT strain | |||||
| Lag1-9Myc | 1.8 | ^ | LAG1pr | 4.9 | *** |
| Lac1-9Myc | 1.4 | ns | LAC1pr | 5.4 | *** |
| Ydc1-9Myc | 2.9 | * | YDC1pr | 13.4 | *** |
| Ypc1-9Myc | 2.4 | * | YPC1pr | 18.7 | ** |
| Fold increase after addition of rapamycin to WT cells | |||||
| Lag1-9Myc | 1.1 | ns | LAG1pr | 1.1 | ns |
| Lac1-9Myc | 1.0 | ns | LAC1pr | 0.8 | ns |
| Ydc1-9Myc | 2.3 | ^ | YDC1pr | 2.0 | * |
| Ypc1-9Myc | 2.2 | *** | YPC1pr | 2.0 | ** |
| Fold increase after addition of rapamycin to sch9Δ cells | |||||
| Lag1-9Myc | 1.2 | ns | LAG1pr | 1.3 | ns |
| Lac1-9Myc | 0.8 | ns | LAC1pr | 1.1 | ns |
| Ydc1-9Myc | 1.0 | ns | YDC1pr | 1.1 | ns |
| Ypc1-9Myc | 1.1 | ns | YPC1pr | 1.0 | ns |
Statistical significance was determined using an unpaired t test for the effects of sch9Δ vs. WT strain, and paired t tests for the effects of rapamycin addition. Statistical significance: ^p < 0.1 (only used for protein levels), *p < 0.05, **p < 0.01, and ***p < 0.001.
aAnalysis of results shown in Figure 4.
bAnalysis of results shown in Figure 5.
FIGURE 6:

The rapamycin-induced effects on YDC1 and YPC1 lacZ activity are mediated by Sch9. LacZ activities of the YDC1 (left) and YPC1 (right) promoters was assessed in the sch9Δ strain (JW 03 038) coexpressing the empty vector (EV, pRS415), the wild-type SCH9 gene, or one of the SCH9 mutant genes in which its TORC1 phosphorylation sites are mutated to either alanine (SCH95A) or glutamic/aspartic acid residues (SCH92D3E). The WT strain (BY4741) coexpressing the EV was taken as an additional control. Precultures were grown overnight in SD-URA-LEU, inoculated into YPD medium, and grown for 6–7 h, after which part of the culture was treated with 200 nM rapamycin. After 1 h, samples of treated and untreated cells were pelleted at 4°C and stored at −80°C. Protein extracts were prepared, and specific activities were determined. Results are expressed as mean of four independent transformants, with SD noted as error bars. Top: all results in one graph. Bottom: for clarity, selective omission of results of conditions that mimic the condition of the sch9Δ strain with the EV. Results for both promoters are equivalent, in that the SCH95A construct mimics the absence of SCH9 in its high basal lacZ activity and no induction by rapamycin. The SCH92D3E construct, on the other hand, gives basal lacZ activities compared with the SCH9 control strain, although induction by rapamycin is lost due to the inability of the Sch92D3E protein to be inhibited by loss of TORC1 activity. Statistical significance of rapamycin addition for each construct was assessed by a paired t test (**p < 0.01, ***p < 0.001).
In conclusion, due to the tight correlation between the effects observed in the lacZ experiments and the determination of protein levels (summarized in Table 1), our results point to the existence of a nutrient-dependent transcriptional response in which the TORC1–Sch9 signaling pathway acts to repress the expression of the ceramidase enzymes (YDC1 and YPC1). In addition, TORC1-independent regulation mechanisms exist that affect the transcriptional regulation of the genes encoding the ceramide synthases (LAG1 and LAC1), thereby constituting an independent homeostatic mechanism controlling sphingolipid balance. Whether the latter mechanism is also independent of Sch9 remains to be established. Indeed, despite being a major downstream effector of TORC1, Sch9 also performs functions independent of this upstream regulator (Pascual-Ahuir and Proft, 2007; Smets et al., 2008).
Sch9 has a regulatory role in the metabolism of complex sphingolipids
Because Sch9 proved to have a significant effect on the LCB(P)/ceramide balance, we set out to test how the complex sphingolipid profile was affected by deletion of SCH9. To this end, we measured the levels of the three major inositol phosphosphingolipid classes, namely IPC, mannosylinositolphosphoryl ceramide (MIPC), and mannosyldiinositolphosphoryl ceramide (M(IP)2C), in membranes of WT and sch9Δ cells. This revealed that the sch9Δ mutant combined relative reduced levels of IPC with increased levels of MIPC and M(IP)2C (Figure 7). Intriguingly, a recent lipidomic approach indicated that as yeast cells go into the stationary phase, IPC levels drop, whereas MIPC levels increase and M(IP)2C levels remain constant (Klose et al., 2012). The net result is the same as we observe upon deletion of SCH9, that is, a relative decrease in IPC levels combined with a relative increase in MIPC and M(IP)2C levels. Thus, the complex sphingolipid profile of a sch9Δ strain reflects that of a WT yeast strain in stationary phase, consistent with the model that Sch9 activity signals the presence of nutrients (Urban et al., 2007). The reduction of IPC could be explained by the reduced content of (phyto)ceramides, which serve as precursors. However, the increment in the levels of mannosylated sphingolipids suggests an additional regulatory role for Sch9 in the biosynthesis or turnover of mannosylated sphingolipids.
FIGURE 7:

The complex sphingolipid profile is changed in sch9Δ cells. Negative-ion ESI/MS spectra of complex sphingolipids from wild-type (W303-1A; open bars) and sch9Δ (JW 01 418; closed bars) mutants. Sphingolipids were purified from wild-type and sch9Δ cells growing exponentially in YPD medium. The three different classes of complex sphingolipids—IPCs, MIPCs, and M(IP)2Cs—are indicated. (A) Representative spectrum from two independent measurements. (B) Quantifications of relative levels.
Sch9 affects the mitochondrial translocation of Isc1
To further decipher the connection between Sch9 and complex sphingolipid synthesis, we performed a genetic analysis on myriocin resistance of an sch9Δ strain lacking additional genes involved in the synthesis of complex sphingolipids. Results indicated that complex sphingolipids may also contribute to myriocin resistance (Supplemental Figure S1A). Specifically interesting to us was the observation that additional deletion of ISC1 resulted in an increase in myriocin resistance of the sch9Δ strain (Figure 1SB). This result indicates a functional link between Sch9 and Isc1, the inositol phosphosphingolipid phospholipase C, which hydrolyses IPC, MIPC, and M(IP)2C back into (phyto)ceramides (Sawai et al., 2000). We first examined whether Sch9 might influence Isc1 protein levels, similar to the situation seen for the enzymes involved in de novo ceramide synthesis. To this end, we constructed WT and sch9Δ strains expressing a chromosomally encoded, Myc-tagged version of Isc1. Determination of the levels of Isc1-Myc in exponentially growing cells demonstrated that deletion of SCH9 or treatment of cells with rapamycin did not alter Isc1-Myc levels (Supplemental Figure S2).
Previous studies demonstrated that Isc1 gains activity during the diauxic shift, when it translocates from the ER to the outer membrane of mitochondria, where the enzyme is required to produce a subset of phytoceramides, especially αOH-PhytoCer-C26 (Vaena de Avalos et al., 2004, 2005; Kitagaki et al., 2007). Because Sch9 plays a pivotal role in the diauxic shift transition (Pedruzzi et al., 2003; Roosen et al., 2005), we set out to monitor and compare the intracellular localization of Isc1 in WT and sch9Δ cells during different growth phases. Initially, we used a galactose-induced Isc1–green fluorescent protein (GFP) expression construct in combination with a red fluorescent mitochondrial marker protein. In agreement with previous work, we observed Isc1-GFP localization at the ER in WT and sch9Δ cells during exponential growth (Vaena de Avalos et al., 2004), with almost no sign of mitochondrial colocalization (Supplemental Figure S3). In the postdiauxic growth phase, Isc1-GFP mainly colocalized with mitochondria in WT cells, whereas in sch9Δ cells, Isc1-GFP remained mostly localized at the ER (Supplemental Figure S3), indicating involvement of Sch9 in mitochondrial translocation of Isc1 on galactose-containing medium. We were curious as to whether Isc1 also translocates to the mitochondria in the postdiauxic phase of cells grown on glucose-containing medium and whether deletion of SCH9 would have a similar effect under these conditions. Furthermore, because we determined our sphingolipid profiles for cells growing on glucose as the carbon source, studying the intracellular localization of Isc1in cells grown on glucose could be directly related to our observed sphingolipid profiles. To this end, we subcloned the ISC1-GFP construct behind its own promoter. In addition, we made two parallel analyses of Isc1-GFP localization: in a first series of experiments, we scored colocalization of Isc1 with an ER-specific mCherry marker (Figure 8A), whereas colocalization with mitochondria was analyzed in a second series of experiments using a mCherry marker targeted to the mitochondria (Figure 8B). For both the WT and sch9Δ strains, we saw that in cells growing exponentially on glucose, Isc1 localized almost exclusively in the perinuclear and cortical ER (Figure 8A), without any significant colocalization with mitochondria (Figure 8B). When scoring colocalization of Isc1 with the ER in cells in the postdiauxic phase, we noticed a higher retention of Isc1 in the ER in sch9Δ cells than in WT cells (Figure 8A). Consistent with this observation, postdiauxic-phase WT cells showed more colocalization of Isc1 with the mitochondrial marker than sch9Δ cells (Figure 8B). Therefore we conclude that deletion of SCH9 impairs mitochondrial translocation of Isc1 in postdiauxic-phase cells in both glucose- and galactose-grown cells.
FIGURE 8:

Fluorescence microscopic analysis of the intracellular localization of Isc1. Intracellular localization of Isc1-GFP expressed from its own promoter (plasmid FBp708) in wild-type (BY4741) and sch9∆ (JW 03 038) cells was examined by assessing colocalization with a mCherry marker targeted to the ER or the mitochondria. Cells precultured on SD-URA-LEU were inoculated in fresh YPD medium (2% glucose) at an initial OD600 of 0.5. Pictures were taken after 6–8 h (exponential) and after 28 h (postdiauxic). Representative pictures are shown for each condition, showing (from left to right) bright field, green channel (GFP), red channel (mCherry), and the corresponding merged picture. (A) Colocalization with the ER. During exponential growth, nearly all cells displayed colocalization of Isc1-GFP with the ER-mCherry marker (plasmid FBp709). In postdiauxic-phase cells, two distinct populations are observed, showing either an overlap or no overlap with the ER. (B) Colocalization with mitochondria. During exponential growth, virtually no cells displayed colocalization of Isc1-GFP with the mitochondria-mCherry marker (plasmid FBp459). In postdiauxic phase cells, two distinct populations are observed, showing either an overlap or no overlap with the mitochondrial marker. For each condition, overlap was assessed in 100–150 cells of three independent transformants. Average results of overlap are noted with SDs, and unpaired t tests were performed to designate statistical difference of each type of colocalization between the WT strain and the sch9∆ strain at the postdiauxic phase (*p < 0.05, ***p < 0.001).
Implications of the functional interaction between Sch9 and Isc1 for yeast longevity
Consistent with Sch9 acting as a regulator of Isc1, several studies documented that Isc1 plays a role in well-known Sch9-dependent phenotypes, including diauxic shift reprogramming and respiration, oxidative stress resistance, and the determination of longevity (Almeida et al., 2008; Kitagaki et al., 2009; Barbosa et al., 2011). Intriguingly, although loss of Sch9 is known to trigger increased resistance to oxidants and increased chronological life span (Fabrizio et al., 2001; Wei et al., 2009), loss of Isc1 is associated with a higher oxidative stress sensitivity and reduced chronological life span (Almeida et al., 2008). To further elaborate on the functional interaction between Sch9 and Isc1, we determined the chronological life span of mutants lacking SCH9 and/or ISC1 (Figure 9A). In agreement with previous published results, we observed an increase in life span in the sch9Δ mutant as compared with the WT strain (Fabrizio et al., 2001; Wei et al., 2009), whereas the isc1Δ mutant displayed reduced viability (Kitagaki et al., 2009; Barbosa et al., 2011). In parallel with viability, we assessed the levels of cellular reactive oxygen species (ROS) under the same conditions, as an increase in oxidative stress plays a major role in determining viability in stationary phase. As compared with WT cells, the level of ROS was already elevated in exponential isc1Δ cells, and this difference became more pronounced when the cells enter the stationary phase (Figure 9, B and C). In sch9Δ cells, the level of ROS also increased during growth, but here the amount of ROS was always significantly lower than in WT cells. Of interest, the additional deletion of SCH9 in the isc1Δ mutant restored the ROS production to levels comparable to those of WT cells (Figure 9, B and C). In line with these reductions in ROS levels, survival of the sch9Δ isc1Δ double mutant increased compared with the isc1Δ strain (Figure 9A). Finally, the decreased chronological life span of cells lacking Isc1 was shown to be due to increased apoptotic cell death (Almeida et al., 2008). We confirmed the involvement of apoptosis in mediating the accelerated cell death of isc1Δ cells by staining yeast cells with the cell death markers of apoptosis and necrosis (annexin/PI costaining; Supplemental Figure S4). We also showed that deletion of SCH9 decreases apoptotic cell death, independent of the presence or absence of ISC1, correlating with the decreased oxidative stress observed in these strains. Linking these viability data with our observation that Sch9 is required for proper mitochondrial translocation of Isc1 in postdiauxic-phase cells is a delicate matter. Because Isc1-mediated sphingolipid metabolism in mitochondria is required for proper mitochondrial function and viability in stationary phase (Almeida et al., 2008; Kitagaki et al., 2009), this would indicate a prosurvival function of Sch9 in stimulating Isc1 activity, which contradicts the increased life span of cells deleted for SCH9 (Figure 9A). On the other hand, decreased mitochondrial translocation of Isc1 in the sch9Δ mutant implies a reduction of mitochondrial ceramide species produced by Isc1 in the postdiauxic phase of sch9Δ cells (Vaena de Avalos et al., 2005; Kitagaki et al., 2007). Several studies showed that ceramides can interact directly with mitochondria, thereby increasing mitochondrial membrane permeability (Birbes et al., 2001; Siskind et al., 2002, 2005; Chipuk et al., 2012; Rego et al., 2012) and disrupting electron transport, resulting in elevated ROS levels (Garcia-Ruiz et al., 1997; Gudz et al., 1997; Di Paola et al., 2000). As such, impaired Isc1 translocation might be responsible for part of the increased longevity observed in a sch9Δ strain, although this antisurvival function of Isc1 does not fit with the loss of viability upon deleting ISC1 in the WT or sch9Δ strain (Figure 9A). Clearly, more work is needed to further characterize the molecular connections between Sch9 and Isc1 functions. For instance, although it was proven that Isc1 activity increases upon translocation to the mitochondria (Vaena de Avalos et al., 2004, 2005), it may also posses (basal) enzymatic activity at the ER. Future studies may test the effect of Sch9 specifically on the enzymatic activity of Isc1 at these different cellular locations. Furthermore, due to the plethora of ceramide species, it is conceivable that specific ceramide species, possibly generated at different intracellular locations, mediate different cellular responses, thereby regulating either survival or death, depending on the cellular context (Hannun and Obeid, 2011; Matmati et al., 2013). Of interest, the complex sphingolipids, whose profile is also altered by deletion of SCH9, were recently demonstrated to influence yeast viability, independent of their ceramide precursors (Kajiwara et al., 2012). As such, these species should not be overlooked when building a model for the cell death/survival mechanisms operating in yeast cells.
FIGURE 9:

Control of viability and oxidative stress by SCH9 and ISC1 during chronological aging. (A) Chronological life span experiment. The viability of the wild-type (BY4741), sch9Δ (JW 01 306), isc1Δ, and sch9Δisc1Δ strains was measured by determining the colony-forming units (CFUs), expressed as percentage of CFUs observed at time 0 h. (B, C) The indicated strains were stained with dihydroethidium (DHE) for measurement of ROS accumulation after 16 h (exponential phase) and 96 h (stationary phase) of growth. (B) Fluorescence microscopic visualization of DHE-stained cells. (C) ROS levels quantified by fluorescence measurements (excitation, 535 nm; emission, 595 nm) and normalized for cell number. ROS levels of the WT strain at 16 h was set as 100%. Results in A and C are mean values of three independent cultures; error bars represent SD. In C, unpaired t tests were performed to designate statistical difference with ROS levels in the WT strain at the same time point (*p < 0.05, ***p < 0.001).
DISCUSSION
Sch9 is a regulator of sphingolipid metabolism
Regulation of the sphingolipid rheostat is essential for yeast cells to ensure proper growth and survival properties (Dickson, 2010). Therefore it is not surprising that this sphingolipid balance changes when nutrient conditions alter. In this study, we observed that, during growth, the sch9Δ strain displays sphingolipid profiles described for cells in stationary phase. Indeed, compared with the WT strain, sch9Δ cells accumulate LCB(P)s and have decreased (phyto)ceramide levels and an altered profile of complex sphingolipids, which is similar to cells entering into stationary phase (Klose et al., 2012; Lester et al., 2013). The specific increase of mannosylated sphingolipid species compared with IPC levels indicates that Sch9 has additional inputs into complex sphingolipid synthesis, apart from its role in maintaining the LCB(P)/ceramide balance. Interestingly, TORC1 inhibition has been reported to stimulate complex sphingolipid synthesis through Npr1-dependent phosphorylation of the Orm1/2 proteins (Shimobayashi et al., 2013). The molecular mechanism behind this phenotype is unknown, although it was shown to be independent of SPT activity. Given that these results were obtained by short-term rapamycin treatment, steady-state levels of complex sphingolipids may thus be regulated by TORC1 through both the Sit4-Npr1 effector branch and the Sch9 effector branch, the latter being supported by this work.
Concerning the LCB(P)/ceramide rheostat, we demonstrate a novel mechanism in which Sch9 controls the presence of the Ydc1 and Ypc1 ceramidase enzymes. Using promoter-lacZ reporter constructs, we demonstrate that Sch9 performs this function by acting at the transcriptional level, with deletion of SCH9 resulting in a significant derepression of YDC1 and YPC1 expression. Treating WT cells with rapamycin, which inhibits the nutrient-dependent kinase TORC1, also results in derepression of YDC1 and YPC1, and we show that this effect is mediated by Sch9, which is known to act as a downstream effector of TORC1 (Urban et al., 2007). Therefore we conclude that signaling through the TORC1–Sch9 pathway during nutrient-rich conditions serves to repress transcription of the YDC1 and YPC1 ceramidase-encoding genes. We also observed TORC1-independent effects on the expression of the ceramide synthase genes LAG1 and LAC1 in the sch9Δ strain. However, we cannot discriminate between whether this represents a true Sch9-dependent, TORC1-independent, signaling event or is due to additional, Sch9-independent homeostatic mechanisms that counteract the significant increased ceramidase presence in the sch9Δ strain. Identification of the transcription factors involved in these processes, which is currently being pursued, will help to shed light on this issue.
It is intriguing that, besides TORC1, multiple in vitro and in vivo studies show that Sch9 activity is also regulated independently by the LCB (PHS)-dependent Pkh1/2 kinases (Roelants et al., 2004; Liu et al., 2005; Urban et al., 2007; Voordeckers et al., 2011; Huang et al., 2012). According to this model, if PHS drops (e.g., by myriocin treatment), Sch9 activity will also drop due to reduced phosphorylation by Pkh1/2. This would lead to increased ceramidase action, helping to restore internal LCB pools. Therefore Sch9 comprises a major gatekeeper of sphingolipid homeostasis, optimizing ceramidase activity by integrating information on internal LCB (PHS) levels through Pkh1/2, as well as information on nutritional status via TORC1, thereby adjusting sphingolipid metabolite levels to cellular needs. Given that Orm1/2-mediated regulation of sphingolipid metabolism was shown to be mainly regulated via (rapid) Orm1/2 phosphorylation, the Sch9-mediated transcriptional response may comprise a complementary mechanism, operating somewhat more slowly, as it is dependent on transcription, although probably essential to generate major long-term changes in the sphingolipid rheostat.
Altered sphingolipid levels and longevity in sch9Δ cells
A well-established phenotype of the sch9Δ strain is its increased survival during stationary phase (Fabrizio et al., 2001; Wei et al., 2009), and much research has been performed to elucidate the mechanisms behind this phenotype. Sphingolipids are also crucial regulators of cell viability, and it has been shown that in higher eukaryotes, the balance in intermediary sphingolipid signaling metabolites, the so-called sphingolipid rheostat, has an important function in cell survival, disease and senescence (Olivera et al., 1999; Levade et al., 2002; Hait et al., 2006; Saddoughi et al., 2008; Breslow and Weissman, 2010; Dickson, 2010; Bikman and Summers, 2011; Van Brocklyn and Williams, 2012). Therefore it is not surprising that the altered sphingolipid profile we describe for sch9Δ cells may have important contributions to the increased life span of this strain.
The increased survival of the sch9Δ strain is reported to be partly due to increased mitochondrial function and respiration during growth (Lavoie and Whiteway, 2008; Pan and Shadel, 2009; Pan et al., 2011). Of interest, the elevated PHS-P levels of sch9Δ cells we demonstrated in this study might be crucial for this process, as cellular PHS-P have been implicated in the control of the HAP complex transcription factor (Cowart et al., 2010), which regulates mitochondrial respiration. As such, our results would provide the missing mechanistic link between Sch9 and the Hap4 transcription factor, which was shown to be essential for the increased cellular respiration in sch9Δ cells (Lavoie and Whiteway, 2008).
The decreased ceramide levels may also contribute to the increased life span of the sch9Δ strain. Indeed, evidence indicates that ceramides can induce a mitochondrial cell death pathway in yeast, which seems to involve increasing mitochondrial membrane permeability (Carmona-Gutierrez et al., 2011; Rego et al., 2012). In addition, ceramides exert proapoptotic effects via ceramide-activated protein phosphatases, such as Sit4 in yeast (Nickels and Broach, 1996; McCourt et al., 2009; Barbosa et al., 2011). In addition to the aforementioned effect of Sch9 on the de novo synthesis of ceramides, we demonstrate that Sch9 is required for the proper mitochondrial localization of Isc1 in postdiauxic cells, which, to our knowledge, is the first report of a protein required for Isc1 translocation (Vaena de Avalos et al., 2004, 2005; Kitagaki et al., 2007). Given that this translocation of Isc1 is blocked in sch9Δ cells, this may abrogate the production of a specific mitochondrial ceramide pool, which could contribute to apoptotic cell death, as demonstrated in both yeast and mammals (Birbes et al., 2001; Chipuk et al., 2012; Rego et al., 2012). Still, we and others have shown that loss of ISC1 impairs survival during stationary phase (Almeida et al., 2008; Kitagaki et al., 2009; Barbosa et al., 2011), indicating that Isc1-mediated ceramide production can elicit prosurvival and antisurvival programs, depending on specific cellular conditions. Finally, since Sch9 activity is proposed to decline upon nutrient depletion, this indicates that Sch9 affects the translocation of Isc1 indirectly. Given that sch9Δ cells were shown to have altered mitochondrial properties, such as reduced superoxide production, in stationary phase (Pan and Shadel, 2009; Pan et al., 2011), our experimental observations support a model in which mitochondrial ROS production may provide the cellular signal for Isc1 translocation.
In conclusion, we show that the TORC1–Sch9 signaling branch controls sphingolipid homeostasis by controlling the expression of the ceramidase enzymes. Given that transcriptional regulation mechanisms of sphingolipid metabolism are still largely elusive (Breslow and Weissman, 2010), it will be of interest to see whether the mechanisms described here are conserved in higher eukaryotes. Furthermore, the altered sphingolipid profile exhibited by the sch9Δ strain provides additional molecular links that help explain the extended life span of this strain. As such, it appears that changing the sphingolipid balance in yeast by tipping it in favor of the (LCBs and) LCBPs, concomitant with decreased ceramide levels, results in lower apoptosis and increased survival, which in many ways is similar to what is seen for mammalian cells (Olivera et al., 1999; Levade et al., 2002; Hait et al., 2006; Saddoughi et al., 2008; Bikman and Summers, 2011; Van Brocklyn and Williams, 2012). Given this conserved nature of the role of sphingolipid signaling in eukaryotic cells, yeast may continue to serve as an important model system for higher eukaryotes.
MATERIALS AND METHODS
Materials, yeast strains, plasmids, and growth media
S. cerevisiae strains and plasmids used in this study are listed in Supplemental Tables S1 and S2, respectively. Deletion strains were made using PCR-derived deletion cassettes (Brachmann et al., 1998). Yeast strains were grown at 30°C in YP (1% yeast extract, 2% bactopeptone [OXOID, Aalst, Belgium]) or in synthetic growth medium (SG; 0.5% ammonium sulfate, 0.17% yeast nitrogen base without amino acids and without ammonium sulfate, and the appropriate synthetic drop-out amino acid/nucleotide mixture [ForMedium, Norfolk, UK]) supplemented with either 2% glucose (D) or 2% galactose (GAL) as indicated. Sporulation and tetrad analysis was carried out as described previously (Swinnen et al., 2005).
Drug sensitivity assays
For analysis of sensitivity to myriocin and aureobasidin A, overnight yeast cultures in YPD were diluted to an OD600 of 0.5 in YPD and further incubated at 30°C for 4–6 h. Sensitivity of the yeast cultures to myriocin (Sigma-Aldrich, St. Louis, MO) was assayed by spotting 5-μl samples of 10-fold serial dilution of these yeast cultures on YPD plates containing 0.5 μg/ml myriocin. Growth was assessed after 48 h of incubation at 30°C. To determine sensitivity of the yeast cultures to aureobasidin A, 0.5 ml of these cultures was used to inoculate an YPD agar plate on which Whatman paper disks were placed containing 5 μl of 1 mg/ml aureobasidin A (Takara Bio, Shiga, Japan) in water. After 3 d of incubation at 30°C the size of the halo was measured. To assess sensitivity of yeast cultures to phytosphingosine (Sigma-Aldrich), cells were grown to stationary phase (>5 d) in YPD and subsequently diluted to an OD600 of 0.05 in YPD containing 5 or 15 μM phytosphingosine and 0.0015% Nonidet P-40. The OD600 of the different cultures was measured at regular time points. For PI staining, yeast cells growing exponentially in YPD medium were treated for 2 h with 0.5 μg/ml myriocin. Next cells were collected, washed in phosphate-buffered saline, and stained with PI using the Annexin-V-Fluos Staining Kit (Roche Diagnostics, Vilvoorde, Belgium) according to the provided protocol.
Northern blot analysis
Cells were grown to an OD600 of 1.5 for a period of at least 24 h by repeated dilution. Samples were taken at the indicated time points, before and after the addition of 0.5 μg/ml myriocin. RNA extraction, probe preparation, and Northern blotting were performed as described previously (Swinnen et al., 2005). Hybridized blots were exposed to phosphorimager screens, and images were scanned with a Bas 1000 PhosphorImager (Fujix, Tokyo, Japan).
Sphingolipid analysis
Sphingolipid labeling and sphingolipidomics were performed as described previously (Kitagaki et al., 2007; Thevissen et al., 2010). In short, yeast cells growing exponentially in YPD medium were snap frozen in a methanol–dry ice bath and stored at –80°C. Electrospray tandem mass spectrometry (ESI-MS/MS) analysis of endogenous LCBs, their phosphates, and nonhydroxylated phytoceramide and dihydroceramide species was performed on a Thermo Finnigan TSQ 7000 triple quadrupole mass spectrometer (Thermo Scientific, Waltham, MA). Sphingolipid levels were expressed in pmol, normalized for the level of phospholipids (Pi, in nmol) present in the Bligh-Dyer lipid extract: pmol/nmol of Pi (Bligh and Dyer, 1959). For the analysis of complex inositolphosphoryl-containing sphingolipids, extracts were made from yeast cells grown to an OD600 of 5 in YPD medium using a procedure described previously (Stock et al., 2000). Sphingolipid analysis of the extracts was performed using ESI-MS on a Finnigan LCQ Deca mass spectrometer (Thermo Scientific) in the negative mode. Spectra were averaged over 100 scans. MS data were analyzed using Xcalibur software from Finnigan (Aerts et al., 2006).
Trichloroacetic acid protein extraction and Western blot
Samples for protein extraction were washed with 20% trichloroacetic acid (TCA) and stored at −80°C for extraction. Cells were resuspended in 20% TCA and broken with glass beads. Extracts were spun down at 4°C for 15 min at 13,000 rpm, and the pellet was washed twice with ice-cold acetone. Equal amounts of protein (Bradford quantification) were mixed with sample buffer and loaded onto an SDS–PAGE gel. Detection of the 9Myc-tagged proteins was performed with the anti-Myc antibody (BIOKE, Leiden, the Netherlands), and detection of internal Adh2 levels with the anti-Adh2 antibody (Millipore, Overijse, Belgium). Signals were quantified using UVP VisionWorks LS software (VWR, Leuven, Belgium).
β-Galactosidase assay
Promoters of the LAG1, LAC1, YDC1, and YPC1 genes were amplified using primers listed in Supplemental Table S3 and cloned into the BamHI and SalI sites of the multicopy lacZ reporter YEp357 (Serrano et al., 2002), yielding plasmids FBp701–704. Subcloning of SCH9 constructs was performed by cutting the SCH9 coding regions from plasmids pJU675, pJU822, and pJU841 (Urban et al., 2007) with XhoI and HindIII and ligating them into the pRS415 vectors, generating plasmids FBp705, FBp706, and FBp707. Precultures were grown overnight in SD-URA or SD-URA-LEU, inoculated into YPD medium, and grown for 6–7 h, after which part of the culture was treated with 200 nM rapamycin (Sigma-Aldrich). After 1 h, samples of treated and untreated cells were pelleted at 4°C and stored at −80°C. Cell pellets were resuspended in breaking buffer (16.1 g of Na2HPO4⋅7H2O, 5.5 g of NaH2PO4⋅H2O, 0.75 g of KCl, 246 mg of MgSO4⋅7H2O per liter) containing proteinase inhibitor cocktail tablets (Complete Mini, EDTA free; Roche Diagnostics) and broken using glass beads. The clarified extract was diluted in breaking buffer to a total volume of 100 μl and incubated at 30°C for 5 min before the reaction was initiated by adding 20 μl of 4 mg/ml o-nitrophenylgalactoside (Sigma-Aldrich). At a precise time, the reaction was terminated by addition of 50 μl of 1 M Na2CO3. OD405nm was measured, and protein concentration was determined according to the Bradford method. We calculated specific activity from 1.7OD405nm/(0.0045 × protein concentration × extract volume × time), expressed as nmol/min mg protein. Data are the mean of three independent transformants. Error bars represent SD.
Fluorescence microscopy
To study intracellular localization of Isc1, we received a construct expressing Isc1-GFP under the galactose-inducible promoter of the pYES2 vector (FBp431; Vaena de Avalos et al., 2004). To study Isc1-GFP localization under conditions using glucose as a carbon source, we cloned ISC1-GFP behind its native promoter into plasmid pRS426 (2 μ, URA3). For this, we used plasmid FBp431 as a template for PCR of the ISC1-GFP fusion construct using primers ISC1-fus5 and ISC1-fus4. Yeast genomic DNA was used for PCR of the ISC1 promoter using primers ISC1-fus1 and ISC1-RVC. Both PCR products contain overlapping ends with the pRS426 vector and each other, and a cotransformation of both PCR products with EcoRI-linearized pRS426 into yeast resulted in in vivo recombination to yield plasmid FBp708 (pISC1pr-ISC1-GFPuv construct in pRS426). Correct cloning was confirmed by sequencing. Intracellular localization of Isc1-GFP was scored by assessing colocalization with mCherry markers for mitochondria (plasmid FBp459; mCherry targeted to the mitochondria by the Cox4 presequence) and the ER (plasmid FBp709). The latter plasmid was created in analogy with the strategy used by Okamoto et al. (2006). In short, an ER-targeted version of mCherry was made by fusing the Kar2p signal-peptide sequence (first 135 nucleotides) to the coding region of mCherry containing a C-terminal HDEL retention sequence. This was achieved by cotransformation of PCR products using primers KAR2-F1 and KAR2-F2 (genomic DNA template) and primers mCherry-F1 and mCherry-F2 (FBp459 template), with a BamHI-linearized pYX242 plasmid. After recombination in yeast, plasmid FBp709 was formed, expressing the KAR2(1→135)-mCherry-HDEL fusion from the TPI promoter. Plasmids used are listed in Supplemental Table S2 and primers in Supplemental Table S3. Colocalization of Isc1-GFP (plasmid FBp431 or FBp708) with mCherry (plasmid FBp459 or FBp709) was carried out using a Leica DM 4000B fluorescence microscope (Leica Microsystems, Diegem, Belgium), and images were taken with a Leica DFC 420c camera using Leica Application software. Cultures were pregrown overnight on SG medium lacking uracil and leucine and transferred to YPGAL (FBp431) or YPD (FBp708) medium at an initial OD600 of 0.5. Green and red fluorescence was monitored after 6–8 h (exponential phase) and after 28 h (postdiauxic phase).
Chronological life span analysis and determination of ROS
For the analysis of chronological life span, cultures were pregrown in SG complete growth medium and diluted in flasks to an OD600 of 0.1 in SG complete medium containing 2% glucose for 28 h, which was set as time zero for longevity assessment. At the indicated time points, cells were plated out on YPD agar plates, and colony-forming units were counted after 2 d of incubation at 30°C. For determination of ROS accumulation, cells were stained with dihydroethidium, pictures were taken with the fluorescence microscope, and quantification was performed by fluorescence measurements (excitation, 535 nm; emission, 595 nm), normalized for cell number by measuring OD595, using a Beckman DTX880 plate reader (Molecular Devices, Wokingham, UK).
Reproducibility of results
All experiments were performed at least three times with similar results. Where applicable, quantification was performed, and results are shown as mean values ± SD (shown as error bars). For other experiments, representative results are shown.
Supplementary Material
Acknowledgments
We thank R. Loewith for providing the plasmids encoding the SCH9 constructs. Research was funded by grants of the Fonds Wetenschappelijk Onderzoek-Vlaanderen to J.W.; grants of KU Leuven to J.W., D.D.V., and B.C.; a Ph.D. grant of the Agency for Innovation by Science and Technology to P.D.S. and T.W.; and a postdoc grant of the Fonds Wetenschappelijk Onderzoek-Vlaanderen to E.S. K.T. acknowledges the receipt of a postdoctoral fellowship from the Industrial Research Fund, KU Leuven. This work was also partly supported by National Institutes of Health Grant GM63265; the Lipidomics Shared Resource, Hollings Cancer Center, Medical University of South Carolina (P30 CA138313); and the Lipidomics Core in the SC Lipidomics and Pathobiology COBRE, Department of Biochemistry, Medical University of South Carolina (NCRR Grant P20 RR017677).
Abbreviations used:
- DHS
dihydrosphingosine
- DHS-P
dihydrosphingosine-1-phosphate
- IPC
inositolphosphoryl ceramide
- LCB
long-chain base
- LCBP
long-chain base 1-phosphate
- MIPC
mannosylinositolphosphoryl ceramide
- M(IP)2C
mannosyldiinositolphosphoryl ceramide
- PHS
phytosphingosine
- PHS-P
phytosphingosine-1-phosphate
- ROS
reactive oxygen species
- SPT
serine palmitoyl transferase
- TORC
target of rapamycin complex
- WT
wild type
Footnotes
This article was published online ahead of print in MBoC in Press (http://www.molbiolcell.org/cgi/doi/10.1091/mbc.E13-06-0340) on November 6, 2013.
*These authors contributed equally to this work.
REFERENCES
- Aerts AM, Francois IE, Bammens L, Cammue BP, Smets B, Winderickx J, Accardo S, De Vos DE, Thevissen K. Level of M(IP)2C sphingolipid affects plant defensin sensitivity, oxidative stress resistance and chronological life-span in yeast. FEBS Lett. 2006;580:1903–1907. doi: 10.1016/j.febslet.2006.02.061. [DOI] [PubMed] [Google Scholar]
- Almeida T, et al. Isc1p plays a key role in hydrogen peroxide resistance and chronological lifespan through modulation of iron levels and apoptosis. Mol Biol Cell. 2008;19:865–876. doi: 10.1091/mbc.E07-06-0604. [DOI] [PMC free article] [PubMed] [Google Scholar]
- Barbosa AD, Osorio H, Sims KJ, Almeida T, Alves M, Bielawski J, Amorim MA, Moradas-Ferreira P, Hannun YA, Costa V. Role for Sit4p-dependent mitochondrial dysfunction in mediating the shortened chronological lifespan and oxidative stress sensitivity of Isc1p-deficient cells. Mol Microbiol. 2011;81:515–527. doi: 10.1111/j.1365-2958.2011.07714.x. [DOI] [PMC free article] [PubMed] [Google Scholar]
- Bikman BT, Summers SA. Ceramides as modulators of cellular and whole-body metabolism. J Clin Invest. 2011;121:4222–4230. doi: 10.1172/JCI57144. [DOI] [PMC free article] [PubMed] [Google Scholar]
- Birbes H, El Bawab S, Hannun YA, Obeid LM. Selective hydrolysis of a mitochondrial pool of sphingomyelin induces apoptosis. FASEB J. 2001;15:2669–2679. doi: 10.1096/fj.01-0539com. [DOI] [PubMed] [Google Scholar]
- Bligh EG, Dyer WJ. A rapid method of total lipid extraction and purification. Can J Biochem Physiol. 1959;37:911–917. doi: 10.1139/o59-099. [DOI] [PubMed] [Google Scholar]
- Brachmann CB, Davies A, Cost GJ, Caputo E, Li J, Hieter P, Boeke JD. Designer deletion strains derived from Saccharomyces cerevisiae S288C: a useful set of strains and plasmids for PCR-mediated gene disruption and other applications. Yeast. 1998;14:115–132. doi: 10.1002/(SICI)1097-0061(19980130)14:2<115::AID-YEA204>3.0.CO;2-2. [DOI] [PubMed] [Google Scholar]
- Breslow DK, Collins SR, Bodenmiller B, Aebersold R, Simons K, Shevchenko A, Ejsing CS, Weissman JS. Orm family proteins mediate sphingolipid homeostasis. Nature. 2010;463:1048–1053. doi: 10.1038/nature08787. [DOI] [PMC free article] [PubMed] [Google Scholar]
- Breslow DK, Weissman JS. Membranes in balance: mechanisms of sphingolipid homeostasis. Mol Cell. 2010;40:267–279. doi: 10.1016/j.molcel.2010.10.005. [DOI] [PMC free article] [PubMed] [Google Scholar]
- Carmona-Gutierrez D, et al. Ceramide triggers metacaspase-independent mitochondrial cell death in yeast. Cell Cycle. 2011;10:3973–3978. doi: 10.4161/cc.10.22.18212. [DOI] [PubMed] [Google Scholar]
- Chipuk JE, McStay GP, Bharti A, Kuwana T, Clarke CJ, Siskind LJ, Obeid LM, Green DR. Sphingolipid metabolism cooperates with BAK and BAX to promote the mitochondrial pathway of apoptosis. Cell. 2012;148:988–1000. doi: 10.1016/j.cell.2012.01.038. [DOI] [PMC free article] [PubMed] [Google Scholar]
- Chung N, Mao C, Heitman J, Hannun YA, Obeid LM. Phytosphingosine as a specific inhibitor of growth and nutrient import in Saccharomyces cerevisiae. J Biol Chem. 2001;276:35614–35621. doi: 10.1074/jbc.M105653200. [DOI] [PubMed] [Google Scholar]
- Cowart LA, Shotwell M, Worley ML, Richards AJ, Montefusco DJ, Hannun YA, Lu X. Revealing a signaling role of phytosphingosine-1-phosphate in yeast. Mol Syst Biol. 2010;6:349. doi: 10.1038/msb.2010.3. [DOI] [PMC free article] [PubMed] [Google Scholar]
- Crauwels M, Donaton MC, Pernambuco MB, Winderickx J, de Winde JH, Thevelein JM. The Sch9 protein kinase in the yeast Saccharomyces cerevisiae controls cAPK activity and is required for nitrogen activation of the fermentable-growth-medium-induced (FGM) pathway. Microbiology. 1997;143:2627–2637. doi: 10.1099/00221287-143-8-2627. [DOI] [PubMed] [Google Scholar]
- Di Paola M, Cocco T, Lorusso M. Ceramide interaction with the respiratory chain of heart mitochondria. Biochemistry. 2000;39:6660–6668. doi: 10.1021/bi9924415. [DOI] [PubMed] [Google Scholar]
- Dickson RC. Thematic review series: sphingolipids. New insights into sphingolipid metabolism and function in budding yeast. J Lipid Res. 2008;49:909–921. doi: 10.1194/jlr.R800003-JLR200. [DOI] [PMC free article] [PubMed] [Google Scholar]
- Dickson RC. Roles for sphingolipids in Saccharomyces cerevisiae. Adv Exp Med Biol. 2010;688:217–231. doi: 10.1007/978-1-4419-6741-1_15. [DOI] [PMC free article] [PubMed] [Google Scholar]
- Dickson RC, Sumanasekera C, Lester RL. Functions and metabolism of sphingolipids in Saccharomyces cerevisiae. Prog Lipid Res. 2006;45:447–465. doi: 10.1016/j.plipres.2006.03.004. [DOI] [PubMed] [Google Scholar]
- Ella KM, Qi C, Dolan JW, Thompson RP, Meier KE. Characterization of a sphingomyelinase activity in Saccharomyces cerevisiae. Arch Biochem Biophys. 1997;340:101–110. doi: 10.1006/abbi.1997.9897. [DOI] [PubMed] [Google Scholar]
- Fabrizio P, Pozza F, Pletcher SD, Gendron CM, Longo VD. Regulation of longevity and stress resistance by Sch9 in yeast. Science. 2001;292:288–290. doi: 10.1126/science.1059497. [DOI] [PubMed] [Google Scholar]
- Funato K, Vallee B, Riezman H. Biosynthesis and trafficking of sphingolipids in the yeast Saccharomyces cerevisiae. Biochemistry. 2002;41:15105–15114. doi: 10.1021/bi026616d. [DOI] [PubMed] [Google Scholar]
- Garcia-Ruiz C, Colell A, Mari M, Morales A, Fernandez-Checa JC. Direct effect of ceramide on the mitochondrial electron transport chain leads to generation of reactive oxygen species. Role of mitochondrial glutathione. J Biol Chem. 1997;272:11369–11377. doi: 10.1074/jbc.272.17.11369. [DOI] [PubMed] [Google Scholar]
- Gudz TI, Tserng KY, Hoppel CL. Direct inhibition of mitochondrial respiratory chain complex III by cell-permeable ceramide. J Biol Chem. 1997;272:24154–24158. doi: 10.1074/jbc.272.39.24154. [DOI] [PubMed] [Google Scholar]
- Hait NC, Oskeritzian CA, Paugh SW, Milstien S, Spiegel S. Sphingosine kinases, sphingosine 1-phosphate, apoptosis and diseases. Biochim Biophys Acta. 2006;1758:2016–2026. doi: 10.1016/j.bbamem.2006.08.007. [DOI] [PubMed] [Google Scholar]
- Han S, Lone MA, Schneiter R, Chang A. Orm1 and Orm2 are conserved endoplasmic reticulum membrane proteins regulating lipid homeostasis and protein quality control. Proc Natl Acad Sci USA. 2010;107:5851–5856. doi: 10.1073/pnas.0911617107. [DOI] [PMC free article] [PubMed] [Google Scholar]
- Hannun YA, Obeid LM. Many ceramides. J Biol Chem. 2011;286:27855–27862. doi: 10.1074/jbc.R111.254359. [DOI] [PMC free article] [PubMed] [Google Scholar]
- Heidler SA, Radding JA. The AUR1 gene in Saccharomyces cerevisiae encodes dominant resistance to the antifungal agent aureobasidin A (LY295337) Antimicrob Agents Chemother. 1995;39:2765–2769. doi: 10.1128/aac.39.12.2765. [DOI] [PMC free article] [PubMed] [Google Scholar]
- Huang X, Liu J, Dickson RC. Down-regulating sphingolipid synthesis increases yeast lifespan. PLoS Genet. 2012;8:e1002493. doi: 10.1371/journal.pgen.1002493. [DOI] [PMC free article] [PubMed] [Google Scholar]
- Kajiwara K, Muneoka T, Watanabe Y, Karashima T, Kitagaki H, Funato K. Perturbation of sphingolipid metabolism induces endoplasmic reticulum stress-mediated mitochondrial apoptosis in budding yeast. Mol Microbiol. 2012;86:1246–1261. doi: 10.1111/mmi.12056. [DOI] [PubMed] [Google Scholar]
- Kihara A, Mitsutake S, Mizutani Y, Igarashi Y. Metabolism and biological functions of two phosphorylated sphingolipids, sphingosine 1-phosphate and ceramide 1-phosphate. Prog Lipid Res. 2007;46:126–144. doi: 10.1016/j.plipres.2007.03.001. [DOI] [PubMed] [Google Scholar]
- Kim S, Fyrst H, Saba J. Accumulation of phosphorylated sphingoid long chain bases results in cell growth inhibition in Saccharomyces cerevisiae. Genetics. 2000;156:1519–1529. doi: 10.1093/genetics/156.4.1519. [DOI] [PMC free article] [PubMed] [Google Scholar]
- Kitagaki H, Cowart LA, Matmati N, Montefusco D, Gandy J, de Avalos SV, Novgorodov SA, Zheng J, Obeid LM, Hannun YA. ISC1-dependent metabolic adaptation reveals an indispensable role for mitochondria in induction of nuclear genes during the diauxic shift in Saccharomyces cerevisiae. J Biol Chem. 2009;284:10818–10830. doi: 10.1074/jbc.M805029200. [DOI] [PMC free article] [PubMed] [Google Scholar]
- Kitagaki H, Cowart LA, Matmati N, Vaena de Avalos S, Novgorodov SA, Zeidan YH, Bielawski J, Obeid LM, Hannun YA. Isc1 regulates sphingolipid metabolism in yeast mitochondria. Biochim Biophys Acta. 2007;1768:2849–2861. doi: 10.1016/j.bbamem.2007.07.019. [DOI] [PMC free article] [PubMed] [Google Scholar]
- Klose C, Surma MA, Gerl MJ, Meyenhofer F, Shevchenko A, Simons K. Flexibility of a eukaryotic lipidome—insights from yeast lipidomics. PLoS One. 2012;7:e35063. doi: 10.1371/journal.pone.0035063. [DOI] [PMC free article] [PubMed] [Google Scholar]
- Kobayashi SD, Nagiec MM. Ceramide/long-chain base phosphate rheostat in Saccharomyces cerevisiae: regulation of ceramide synthesis by Elo3p and Cka2p. Eukaryot Cell. 2003;2:284–294. doi: 10.1128/EC.2.2.284-294.2003. [DOI] [PMC free article] [PubMed] [Google Scholar]
- Lavoie H, Whiteway M. Increased respiration in the sch9Delta mutant is required for increasing chronological life span but not replicative life span. Eukaryot Cell. 2008;7:1127–1135. doi: 10.1128/EC.00330-07. [DOI] [PMC free article] [PubMed] [Google Scholar]
- Lester RL, Withers BR, Schultz MA, Dickson RC. Iron, glucose and intrinsic factors alter sphingolipid composition as yeast cells enter stationary phase. Biochim Biophys Acta. 2013;1831:726–736. doi: 10.1016/j.bbalip.2012.12.012. [DOI] [PMC free article] [PubMed] [Google Scholar]
- Levade T, Malagarie-Cazenave S, Gouaze V, Segui B, Tardy C, Betito S, Andrieu-Abadie N, Cuvillier O. Ceramide in apoptosis: a revisited role. Neurochem Res. 2002;27:601–607. doi: 10.1023/a:1020215815013. [DOI] [PubMed] [Google Scholar]
- Liu J, Huang X, Withers BR, Blalock E, Liu K, Dickson RC. Reducing sphingolipid synthesis orchestrates global changes to extend yeast lifespan. Aging Cell. 2013;12:833–841. doi: 10.1111/acel.12107. [DOI] [PMC free article] [PubMed] [Google Scholar]
- Liu K, Zhang X, Lester RL, Dickson RC. The sphingoid long chain base phytosphingosine activates AGC-type protein kinases in Saccharomyces cerevisiae including Ypk1, Ypk2, and Sch9. J Biol Chem. 2005;280:22679–22687. doi: 10.1074/jbc.M502972200. [DOI] [PubMed] [Google Scholar]
- Liu M, Huang C, Polu SR, Schneiter R, Chang A. Regulation of sphingolipid synthesis through Orm1 and Orm2 in yeast. J Cell Sci. 2012;125:2428–2435. doi: 10.1242/jcs.100578. [DOI] [PMC free article] [PubMed] [Google Scholar]
- Matmati N, Hannun YA. Thematic review series: sphingolipids. ISC1 (inositol phosphosphingolipid-phospholipase C), the yeast homologue of neutral sphingomyelinases. J Lipid Res. 2008;49:922–928. doi: 10.1194/jlr.R800004-JLR200. [DOI] [PMC free article] [PubMed] [Google Scholar]
- Matmati N, Metelli A, Tripathi K, Yan S, Mohanty BK, Hannun YA. Identification of C18:1-phytoceramide as the candidate lipid mediator for hydroxyurea resistance in yeast. J Biol Chem. 2013;288:17272–17284. doi: 10.1074/jbc.M112.444802. [DOI] [PMC free article] [PubMed] [Google Scholar]
- McCourt PC, Morgan JM, Nickels JT., Jr Stress-induced ceramide-activated protein phosphatase can compensate for loss of amphiphysin-like activity in Saccharomyces cerevisiae and functions to reinitiate endocytosis. J Biol Chem. 2009;284:11930–11941. doi: 10.1074/jbc.M900857200. [DOI] [PMC free article] [PubMed] [Google Scholar]
- Miyake Y, Kozutsumi Y, Nakamura S, Fujita T, Kawasaki T. Serine palmitoyltransferase is the primary target of a sphingosine-like immunosuppressant, ISP-1/myriocin. Biochem Biophys Res Commun. 1995;211:396–403. doi: 10.1006/bbrc.1995.1827. [DOI] [PubMed] [Google Scholar]
- Nagiec MM, Nagiec EE, Baltisberger JA, Wells GB, Lester RL, Dickson RC. Sphingolipid synthesis as a target for antifungal drugs. Complementation of the inositol phosphorylceramide synthase defect in a mutant strain of Saccharomyces cerevisiae by the AUR1 gene. J Biol Chem. 1997;272:9809–9817. doi: 10.1074/jbc.272.15.9809. [DOI] [PubMed] [Google Scholar]
- Nickels JT, Broach JR. A ceramide-activated protein phosphatase mediates ceramide-induced G1 arrest of Saccharomyces cerevisiae. Genes Dev. 1996;10:382–394. doi: 10.1101/gad.10.4.382. [DOI] [PubMed] [Google Scholar]
- Okamoto M, Yoko-o T, Umemura M, Nakayama K, Jigami Y. Glycosylphosphatidylinositol-anchored proteins are required for the transport of detergent-resistant microdomain-associated membrane proteins Tat2p and Fur4p. J Biol Chem. 2006;281:4013–4023. doi: 10.1074/jbc.M504684200. [DOI] [PubMed] [Google Scholar]
- Olivera A, Kohama T, Edsall L, Nava V, Cuvillier O, Poulton S, Spiegel S. Sphingosine kinase expression increases intracellular sphingosine-1-phosphate and promotes cell growth and survival. J Cell Biol. 1999;147:545–558. doi: 10.1083/jcb.147.3.545. [DOI] [PMC free article] [PubMed] [Google Scholar]
- Pan Y, Schroeder EA, Ocampo A, Barrientos A, Shadel GS. Regulation of yeast chronological life span by TORC1 via adaptive mitochondrial ROS signaling. Cell Metab. 2011;13:668–678. doi: 10.1016/j.cmet.2011.03.018. [DOI] [PMC free article] [PubMed] [Google Scholar]
- Pan Y, Shadel GS. Extension of chronological life span by reduced TOR signaling requires down-regulation of Sch9p and involves increased mitochondrial OXPHOS complex density. Aging (Albany NY) 2009;1:131–145. doi: 10.18632/aging.100016. [DOI] [PMC free article] [PubMed] [Google Scholar]
- Pascual-Ahuir A, Proft M. Control of stress-regulated gene expression and longevity by the Sch9 protein kinase. Cell Cycle. 2007;6:2445–2447. doi: 10.4161/cc.6.20.4792. [DOI] [PubMed] [Google Scholar]
- Pedruzzi I, Dubouloz F, Cameroni E, Wanke V, Roosen J, Winderickx J, De Virgilio C. TOR and PKA signaling pathways converge on the protein kinase Rim15 to control entry into G0. Mol Cell. 2003;12:1607–1613. doi: 10.1016/s1097-2765(03)00485-4. [DOI] [PubMed] [Google Scholar]
- Rego A, Costa M, Chaves SR, Matmati N, Pereira H, Sousa MJ, Moradas-Ferreira P, Hannun YA, Costa V, Corte-Real M. Modulation of mitochondrial outer membrane permeabilization and apoptosis by ceramide metabolism. PLoS One. 2012;7:e48571. doi: 10.1371/journal.pone.0048571. [DOI] [PMC free article] [PubMed] [Google Scholar]
- Roelants FM, Breslow DK, Muir A, Weissman JS, Thorner J. Protein kinase Ypk1 phosphorylates regulatory proteins Orm1 and Orm2 to control sphingolipid homeostasis in Saccharomyces cerevisiae. Proc Natl Acad Sci USA. 2011;108:19222–19227. doi: 10.1073/pnas.1116948108. [DOI] [PMC free article] [PubMed] [Google Scholar]
- Roelants FM, Torrance PD, Thorner J. Differential roles of PDK1- and PDK2-phosphorylation sites in the yeast AGC kinases Ypk1, Pkc1 and Sch9. Microbiology. 2004;150:3289–3304. doi: 10.1099/mic.0.27286-0. [DOI] [PubMed] [Google Scholar]
- Roosen J, Engelen K, Marchal K, Mathys J, Griffioen G, Cameroni E, Thevelein JM, De Virgilio C, De Moor B, Winderickx J. PKA and Sch9 control a molecular switch important for the proper adaptation to nutrient availability. Mol Microbiol. 2005;55:862–880. doi: 10.1111/j.1365-2958.2004.04429.x. [DOI] [PubMed] [Google Scholar]
- Saddoughi SA, Song P, Ogretmen B. Roles of bioactive sphingolipids in cancer biology and therapeutics. Subcell Biochem. 2008;49:413–440. doi: 10.1007/978-1-4020-8831-5_16. [DOI] [PMC free article] [PubMed] [Google Scholar]
- Sawai H, Okamoto Y, Luberto C, Mao C, Bielawska A, Domae N, Hannun YA. Identification of ISC1 (YER019w) as inositol phosphosphingolipid phospholipase C in Saccharomyces cerevisiae. J Biol Chem. 2000;275:39793–39798. doi: 10.1074/jbc.M007721200. [DOI] [PubMed] [Google Scholar]
- Serrano R, Ruiz A, Bernal D, Chambers JR, Arino J. The transcriptional response to alkaline pH in Saccharomyces cerevisiae: evidence for calcium-mediated signalling. Mol Microbiol. 2002;46:1319–1333. doi: 10.1046/j.1365-2958.2002.03246.x. [DOI] [PubMed] [Google Scholar]
- Shimobayashi M, Oppliger W, Moes S, Jeno P, Hall MN. TORC1-regulated protein kinase Npr1 phosphorylates Orm to stimulate complex sphingolipid synthesis. Mol Biol Cell. 2013;24:870–881. doi: 10.1091/mbc.E12-10-0753. [DOI] [PMC free article] [PubMed] [Google Scholar]
- Sims KJ, Spassieva SD, Voit EO, Obeid LM. Yeast sphingolipid metabolism: clues and connections. Biochem Cell Biol. 2004;82:45–61. doi: 10.1139/o03-086. [DOI] [PubMed] [Google Scholar]
- Siskind LJ. Mitochondrial ceramide and the induction of apoptosis. J Bioenerg Biomembr. 2005;37:143–153. doi: 10.1007/s10863-005-6567-7. [DOI] [PMC free article] [PubMed] [Google Scholar]
- Siskind LJ, Kolesnick RN, Colombini M. Ceramide channels increase the permeability of the mitochondrial outer membrane to small proteins. J Biol Chem. 2002;277:26796–26803. doi: 10.1074/jbc.M200754200. [DOI] [PMC free article] [PubMed] [Google Scholar]
- Skrzypek MS, Nagiec MM, Lester RL, Dickson RC. Inhibition of amino acid transport by sphingoid long chain bases in Saccharomyces cerevisiae. J Biol Chem. 1998;273:2829–2834. doi: 10.1074/jbc.273.5.2829. [DOI] [PubMed] [Google Scholar]
- Smets B, De Snijder P, Engelen K, Joossens E, Ghillebert R, Thevissen K, Marchal K, Winderickx J. Genome-wide expression analysis reveals TORC1-dependent and -independent functions of Sch9. FEMS Yeast Res. 2008;8:1276–1288. doi: 10.1111/j.1567-1364.2008.00432.x. [DOI] [PubMed] [Google Scholar]
- Smets B, Ghillebert R, De Snijder P, Binda M, Swinnen E, De Virgilio C, Winderickx J. Life in the midst of scarcity: adaptations to nutrient availability in Saccharomyces cerevisiae. Curr Genet. 2010;56:1–32. doi: 10.1007/s00294-009-0287-1. [DOI] [PubMed] [Google Scholar]
- Stock SD, Hama H, Radding JA, Young DA, Takemoto JY. Syringomycin E inhibition of Saccharomyces cerevisiae: requirement for biosynthesis of sphingolipids with very-long-chain fatty acids and mannose- and phosphoinositol-containing head groups. Antimicrob Agents Chemother. 2000;44:1174–1180. doi: 10.1128/aac.44.5.1174-1180.2000. [DOI] [PMC free article] [PubMed] [Google Scholar]
- Sun Y, Miao Y, Yamane Y, Zhang C, Shokat KM, Takematsu H, Kozutsumi Y, Drubin DG. Orm protein phosphoregulation mediates transient sphingolipid biosynthesis response to heat stress via the Pkh-Ypk and Cdc55-PP2A pathways. Mol Biol Cell. 2012;23:2388–2398. doi: 10.1091/mbc.E12-03-0209. [DOI] [PMC free article] [PubMed] [Google Scholar]
- Sun Y, Taniguchi R, Tanoue D, Yamaji T, Takematsu H, Mori K, Fujita T, Kawasaki T, Kozutsumi Y. Sli2 (Ypk1), a homologue of mammalian protein kinase SGK, is a downstream kinase in the sphingolipid-mediated signaling pathway of yeast. Mol Cell Biol. 2000;20:4411–4419. doi: 10.1128/mcb.20.12.4411-4419.2000. [DOI] [PMC free article] [PubMed] [Google Scholar]
- Swinnen E, Rosseels J, Winderickx J. The minimum domain of Pho81 is not sufficient to control the Pho85-Rim15 effector branch involved in phosphate starvation-induced stress responses. Curr Genet. 2005;48:18–33. doi: 10.1007/s00294-005-0583-3. [DOI] [PubMed] [Google Scholar]
- Thevissen K, Yen WL, Carmona-Gutierrez D, Idkowiak-Baldys J, Aerts AM, Francois IE, Madeo F, Klionsky DJ, Hannun YA, Cammue BP. Skn1 and Ipt1 negatively regulate autophagy in Saccharomyces cerevisiae. FEMS Microbiol Lett. 2010;303:163–168. doi: 10.1111/j.1574-6968.2009.01869.x. [DOI] [PMC free article] [PubMed] [Google Scholar]
- Toda T, Cameron S, Sass P, Wigler M. SCH9, a gene of Saccharomyces cerevisiae that encodes a protein distinct from, but functionally and structurally related to, cAMP-dependent protein kinase catalytic subunits. Genes Dev. 1988;2:517–527. doi: 10.1101/gad.2.5.517. [DOI] [PubMed] [Google Scholar]
- Urban J, et al. Sch9 is a major target of TORC1 in Saccharomyces cerevisiae. Mol Cell. 2007;26:663–674. doi: 10.1016/j.molcel.2007.04.020. [DOI] [PubMed] [Google Scholar]
- Vaena de Avalos S, Okamoto Y, Hannun YA. Activation and localization of inositol phosphosphingolipid phospholipase C, Isc1p, to the mitochondria during growth of Saccharomyces cerevisiae. J Biol Chem. 2004;279:11537–11545. doi: 10.1074/jbc.M309586200. [DOI] [PubMed] [Google Scholar]
- Vaena de Avalos S, Su X, Zhang M, Okamoto Y, Dowhan W, Hannun YA. The phosphatidylglycerol/cardiolipin biosynthetic pathway is required for the activation of inositol phosphosphingolipid phospholipase C, Isc1p, during growth of Saccharomyces cerevisiae. J Biol Chem. 2005;280:7170–7177. doi: 10.1074/jbc.M411058200. [DOI] [PubMed] [Google Scholar]
- Van Brocklyn JR, Williams JB. The control of the balance between ceramide and sphingosine-1-phosphate by sphingosine kinase: oxidative stress and the seesaw of cell survival and death. Comp Biochem Physiol B Biochem Mol Biol. 2012;163:26–36. doi: 10.1016/j.cbpb.2012.05.006. [DOI] [PubMed] [Google Scholar]
- Voordeckers K, Kimpe M, Haesendonckx S, Louwet W, Versele M, Thevelein JM. Yeast 3-phosphoinositide-dependent protein kinase-1 (PDK1) orthologs Pkh1–3 differentially regulate phosphorylation of protein kinase A (PKA) and the protein kinase B (PKB)/S6K ortholog Sch9. J Biol Chem. 2011;286:22017–22027. doi: 10.1074/jbc.M110.200071. [DOI] [PMC free article] [PubMed] [Google Scholar]
- Wei M, Fabrizio P, Madia F, Hu J, Ge H, Li LM, Longo VD. Tor1/Sch9-regulated carbon source substitution is as effective as calorie restriction in life span extension. PLoS Genet. 2009;5:e1000467. doi: 10.1371/journal.pgen.1000467. [DOI] [PMC free article] [PubMed] [Google Scholar]
- Yorimitsu T, Zaman S, Broach JR, Klionsky DJ. Protein kinase A and Sch9 cooperatively regulate induction of autophagy in Saccharomyces cerevisiae. Mol Biol Cell. 2007;18:4180–4189. doi: 10.1091/mbc.E07-05-0485. [DOI] [PMC free article] [PubMed] [Google Scholar]
Associated Data
This section collects any data citations, data availability statements, or supplementary materials included in this article.