Abstract
Purpose: This paper concerns the feasibility of x-ray differential phase contrast (DPC) tomosynthesis imaging using a grating-based DPC benchtop experimental system, which is equipped with a commercial digital flat-panel detector and a medical-grade rotating-anode x-ray tube. An extensive system characterization was performed to quantify its imaging performance.
Methods: The major components of the benchtop system include a diagnostic x-ray tube with a 1.0 mm nominal focal spot size, a flat-panel detector with 96 μm pixel pitch, a sample stage that rotates within a limited angular span of ±30°, and a Talbot-Lau interferometer with three x-ray gratings. A total of 21 projection views acquired with 3° increments were used to reconstruct three sets of tomosynthetic image volumes, including the conventional absorption contrast tomosynthesis image volume (AC-tomo) reconstructed using the filtered-backprojection (FBP) algorithm with the ramp kernel, the phase contrast tomosynthesis image volume (PC-tomo) reconstructed using FBP with a Hilbert kernel, and the differential phase contrast tomosynthesis image volume (DPC-tomo) reconstructed using the shift-and-add algorithm. Three inhouse physical phantoms containing tissue-surrogate materials were used to characterize the signal linearity, the signal difference-to-noise ratio (SDNR), the three-dimensional noise power spectrum (3D NPS), and the through-plane artifact spread function (ASF).
Results: While DPC-tomo highlights edges and interfaces in the image object, PC-tomo removes the differential nature of the DPC projection data and its pixel values are linearly related to the decrement of the real part of the x-ray refractive index. The SDNR values of polyoxymethylene in water and polystyrene in oil are 1.5 and 1.0, respectively, in AC-tomo, and the values were improved to 3.0 and 2.0, respectively, in PC-tomo. PC-tomo and AC-tomo demonstrate equivalent ASF, but their noise characteristics quantified by the 3D NPS were found to be different due to the difference in the tomosynthesis image reconstruction algorithms.
Conclusions: It is feasible to simultaneously generate x-ray differential phase contrast, phase contrast, and absorption contrast tomosynthesis images using a grating-based data acquisition setup. The method shows promise in improving the visibility of several low-density materials and therefore merits further investigation.
Keywords: x-ray phase contrast imaging, Talbot-Lau interferometer, digital tomosynthesis
INTRODUCTION
X-ray digital tomosynthesis is an imaging method that uses multiple planar x-ray projection images acquired at different angular positions around the image object to reconstruct pseudotomographic images of the object.1 The total angular span of the projection data acquisition is limited to a few tens of degrees, and the reconstructed tomosynthesis images usually have high inplane spatial resolutions but limited slice thickness (typically 1 mm for breast tomosynthesis and 5 mm for chest tomosynthesis).2, 3, 4 This method can be applied to medical imaging to partially address the tissue overlapping problem commonly observed in x-ray planar projection imaging (radiography) while being able to limit the ionizing radiation dose to a reasonably low level.3, 5 Compared with the fully three-dimensional (3D) cone beam computed tomography (CBCT) imaging method, tomosynthesis has several attractive features: first, it typically offers superior inplane spatial resolution than CBCT; second, the cost of the hardware components of a tomosynthesis system is usually less than that of a CBCT system; third, the operating x-ray energy can be reduced in tomosynthesis to improve tissue contrast. This is achieved by compressing the image object along the x-ray beam direction during the tomosynthesis data acquisition, which is similar to the approach used in x-ray mammography. Compared to CBCT, the major drawbacks of tomosynthesis include the lack of quantitative imaging capability and the limited slice sensitivity.4
The tomosynthesis imaging methods currently used in medical diagnosis share a common feature with radiography and CBCT imaging methods: they all use the absorption of x rays (by the image object) to generate the image contrast. However, the absorption contrast is not the sole contrast mechanism enabled by x-ray-matter interactions: when a beam of x rays interact with an image object, both x-ray absorption (a particle physics phenomenon) and x-ray phase shift (a wave optics phenomenon) occur, and both effects carry information about the image object. By using coherent x rays, the phase shift of x rays can be physically measured to generate phase contrast images. Since the phase shift of x rays is only sensitive to the spatial distributions of electron density, phase contrast imaging could be of added value in medical diagnosis.6 In particular, phase contrast imaging could potentially benefit the discrimination of body parts that are primarily comprised of soft tissues (e.g., the breast) with low atomic numbers, which generate very limited absorption contrast due to the lack of photoelectric events. Due to this reason, it is of great interest for pioneering academic medical imaging researchers to study the feasibility of combining the phase contrast mechanism with the tomosynthetic imaging method.
Several implementation methods have been proposed for x-ray phase contrast tomosynthesis imaging, but there are still some challenges in adapting these methods to a practical clinical setting. Having good spatial and temporal x-ray coherence is a typical requirement for phase contrast imaging, and it was met in most of these implementations by using synchrotrons. For example, both Maksimenko et al.7 and Kang et al.8 have used synchrotron radiation and the diffraction enhanced imaging (DEI) method to successfully generate phase contrast tomosynthesis images. The medical utility of these implementation methods is hindered by the large size and high cost of synchrotron facilities. Another means of implementing the phase contrast tomosynthesis imaging is to use the inline holography method as reported by Zhang et al.9 and Hammonds et al.10 In these implementations, partially coherent x rays generated by microfocus x-ray tubes freely propagate through the image object to form projection images for tomosynthesis reconstruction. These projections contain a mixture of the second-order spatial derivative of x-ray phase shift signal and the conventional x-ray absorption signal. The medical utility of these implementations, however, is limited by the low beam flux of the microfocus x-ray tubes. Additionally, the inline holography tomosynthesis method can only generate mixture images that contain both phase contrast and absorption contrast information unless some analytical or iterative phase retrieval method is used to separate the two signal types.11, 12, 13
In this paper, we report a proof-of-concept experimental study for the grating interferometer-based x-ray differential phase contrast (DPC) tomosynthesis imaging. In this method, a Talbot-Lau interferometer14, 15 was used to achieve concurrent yet separable absorption and phase contrast tomosynthesis imaging. A source grating was used to collimate the x-ray beam generated from a medical-grade x-ray tube into many beamlets with adequate spatial coherence.16 A benchtop DPC data acquisition system developed at the authors' institution,17, 18 and inhouse physical phantoms with known phase contrast properties were used to implement the DPC tomosynthesis imaging method.
As an initial step in assessing the imaging capability and the potentials in medical imaging of the proposed grating-based DPC tomosynthesis imaging method, comprehensive and objective characterizations of the method's signal and noise properties were performed. To help understand the potential advantages and disadvantages of the proposed imaging method, the characterizations were performed on both phase contrast tomosynthesis images and absorption contrast tomosynthesis images acquired concurrently at the same x-ray exposure level.
METHODS AND MATERIALS
Basic principle
In grating-based phase contrast imaging, the phase shift of an x-ray beam propagating through an image object is determined by the decrement, δ, of the complex refractive index n = 1 − δ + iβ. More explicitly, under the paraxial approximation commonly used in optics,19 the accumulated phase shift of a diffraction fringe pattern generated by the Talbot-Lau interferometer has been shown to related to the line integral of δ along the x-ray propagation path.15 The grating-based phase contrast imaging method indirectly measures the spatial gradient of the x-ray phase shift by directly measuring the phase shift of the periodic diffraction fringe pattern generated by the grating interferometer, namely,
| (2.1) |
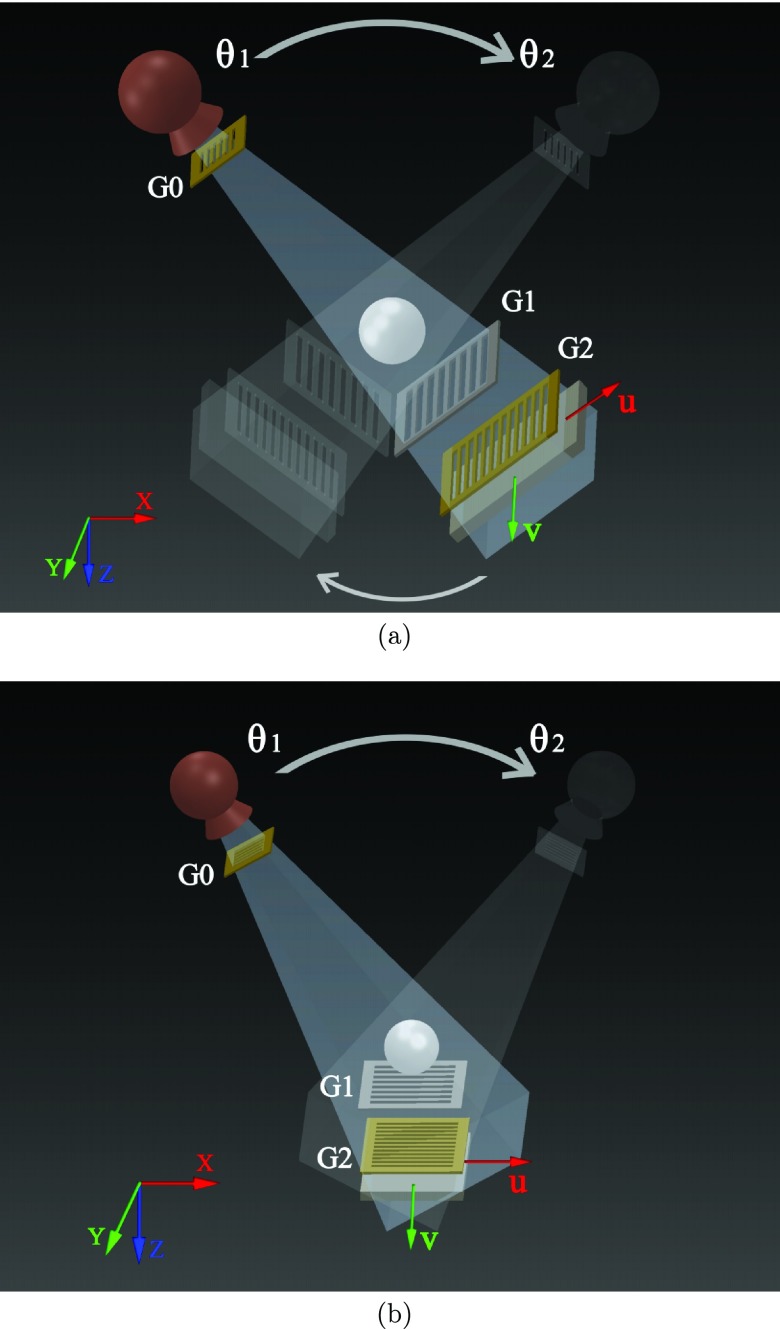
where ϕ denotes the phase shift of the diffraction fringe pattern, Lθ denotes the line path of the x-ray beam at angle position θ, zT denotes the fractional Talbot distance, which was used to set the distance between the phase grating G1 and the analyzer grating G2 of the Talbot-Lau interferometer. p2 denotes the pitch of the G2 grating, R denotes the Radon transform (i.e., line integral) of δ. The Cartesian coordinates (x, y, z) and (u, v) are defined on the image object and the detector, respectively (Fig. 1).
Figure 1.
Schematic illustration of two geometries for the grating-based phase contrast tomosynthesis data acquisition systems. (a) The Grossman geometry with both tube and detector moving along a circular path; (b) The DBT geometry with only the tube moving along an arc. θ1 and θ2 denote the starting and stopping angular positions of the tube. G0, G1, G2 denote three one-dimensional gratings. Details about the grating interferometer setup can be found in Ref. 17.
One advantage of the grating-based phase contrast imaging method is that it can simultaneously generate separable x-ray absorption images: the DC level of the diffraction fringe pattern is exactly the conventional absorption signal, the logarithmic transform of which is equal to the Radon transform of the x-ray linear attenuation coefficient (μ), namely,
| (2.2) |
where μ is linearly related to the imaginary part, β, of the complex refractive index n = 1 − δ + iβ by Ref. 6
| (2.3) |
where λ is the x-ray wavelength.
From the hardware instrumentation standpoint, a grating-based phase contrast imaging acquisition system requires a similar hardware setup to that of a conventional x-ray absorption contrast imaging except for the following two differences: (i) the grating interferometer needs to be incorporated into the x-ray beam; (ii) a sequential movement of the G2 grating known as the phase stepping method14, 15 is usually employed during each projection data acquisition to help extract the phase signal. The phase stepping procedure will prolong the data acquisition time and thus is considered as a drawback. In several recent studies, the phase stepping method has been replaced by other methods such as the moiré analysis method, which do not require multiple grating movement and exposures.20, 21 Therefore, the grating interferometer setup is not necessarily a limiting factor for the data acquisition time of the imaging system.
We proposed two geometries for the potential hardware setups of the grating-based phase contrast tomosynthesis systems: the first one shown in Fig. 1a is known as the Grossman geometry,5 in which both the x-ray tube and detector move along a circular path around the image object. The second geometry shown in Fig. 1b is the one that is currently used by commercial digital breast tomosynthesis (DBT) systems. This DBT geometry features a static detector and a rotary x-ray source that rocks along a circular trajectory in the x-z plane. The experimental benchtop system used in this study uses the Grossman geometry. The feasibility of implementing the grating-based phase contrast tomosynthesis imaging method with the DBT geometry will be discussed in a separate paper.
Tomosynthetic reconstruction algorithm
To reconstruct the conventional absorption tomosynthesis images, a variety of algorithms have been developed, including the shift-and-add (SAA) algorithm,1, 5 the filtered backprojection (FBP) algorithm,22 the statistical image reconstruction algorithm,23 and some other novel algorithms reviewed in Refs. 4 and 24. Among these methods, SAA and FBP are linear algorithms, allowing the tomosynthesis image quality to be physically modeled and characterized by objective image quality metrics such as signal difference to noise ratio (SDNR), artifact spread function (ASF), modulation transfer function (MTF), and noise power spectrum (NPS). Although other image reconstruction algorithms may add potential advantages, for simplicity, this paper focuses on extending the two linear algorithms to grating-based phase contrast tomosynthesis.
First let us briefly review the FBP absorption contrast tomosynthesis reconstruction algorithm: First, the measured absorption projection data, Rμ, needs to be filtered by a ramp filtering kernel as
| (2.4) |
Here, the filtering process is expressed in the spatial frequency domain, and denotes the 1D Fourier transform of Rμ with respect to u
| (2.5) |
Next, the filtered projection data are backprojected to the tomosynthesis image domain. Under the parallel beam approximation, the backprojection operation in a tomosynthesis system with the Grossman geometry can be analytically formulated as follows:
| (2.6) |
where Δθ denotes angular intervals between two sequential projections. The pixel value, Iμ, of the reconstructed absorption contrast tomosynthesis images is linearly related but not equal to μ because of the incomplete angular sampling. For systems with divergent x-ray beams and more complex geometries, the backprojection can be achieved by using projection matrices.25
To reconstruct phase contrast tomosynthesis images, the FBP algorithm described above needs to be modified to account for the differentiation operator in image formation process in Eq. 2.1. In fact, a Fourier transform will recast this imaging equation into the following form:26
| (2.7) |
Based on this expression, a modified Hilbert kernel needs to be used to compensate for the differentiation operator and achieve a similar filtering effect as in Eq. 2.4, namely,
| (2.8) |
Therefore, phase contrast projections filtered by a Hilbert-function-based kernel kernel have the same format as the absorption projections filtered by the ramp kernel, and the remaining backprojection process is identical between phase contrast tomosynthesis and absorption contrast tomosynthesis. The reconstructed phase contrast tomosynthesis images will be denoted Iδ(x, y, z), and their pixel values are expected to be linearly related to δ.
Meanwhile, the more straightforward SAA method can also be used to reconstruct phase contrast tomosynthesis images. Because of the absence of the data filtering process in SAA, the differentiation operator in Eq. 2.1 will not be removed and the differential nature of the projection data will be inherited by the reconstructed tomosynthesis images. To avoid confusion, phase contrast tomosynthesis images reconstructed by the FBP algorithm will be referred as PC-tomo, while phase contrast images reconstructed by the SAA algorithm will be referred as DPC-tomo. The reconstructed absorption contrast tomosynthesis images will be referred as AC-tomo in the remainder of the paper.
Data acquisition system and phantoms
A benchtop grating-based phase contrast tomosynthesis imaging system with the Grossman geometry was used to demonstrate the feasibility of DPC tomosynthesis imaging. This system features the following components: a rotating-anode medical grade x-ray tube with 0.3 and 1.0 mm nominal focal spot sizes (Varian G1582, Palo Alto, CA); a flat panel CMOS x-ray detector (Rad-icon Shad-o-Box 2048, Sunnyvale, CA), with Gd2O2S scintillator and a 2048 × 1024 array of photodiode pixels with a 48 μm native pixel pitch (a 2×2 binning scheme was used in our study); a Talbot-Lau interferometer that is comprised of three gratings (G0, G1, G2) and was designed for an operating energy of 28 keV. The source-to-isocenter distance is 156.1 cm and the source-to-detector distance is 188.2 cm. The distance between the G1 and G2 gratings (zT) is 18.5 cm, and the pitch of the G2 grating (p2) is 4.5 μm. During the tomosynthesis data acquisition, the tube was operated at 40 kVp and 10 mA, and the object stage rotated over a range of ±30°, which is equivalent to moving the tube-gratings-detector assembly over an arc of the same angular range. A total of 21 projections at different angular positions were acquired with 3° increments and 40 s of x-ray exposure per angular position. The phase stepping technique with eight steps per angular position was used to retrieve both differential phase and absorption information.
Three home-made physical phantoms constructed from materials with known μ and δ were used in this study (Fig. 2). Phantom A is a cylindrical water phantom with its enclosure made of polymethyl methacrylate (PMMA). Its outer diameter is 28.5 mm and its length is 70.0 mm. The phantom contains four uniform cylindrical inserts [PMMA, polytetrafluoroethylene (PTFE), polyoxymethylene (POM), and an air filled tube] aligned along the y direction. Phantom B is a cuboid water phantom (PMMA enclosure) with a dimension of 50 (x) × 76.2 (y) × 39.2 mm (z). It incorporates three flat inserts made of PMMA, polymethylpentene (PMP), and polycarbonate (PC), each with a thickness of 2 mm. The three inserts were separated by 8 mm along the z direction. This phantom was repeatedly scanned ten times and the results were averaged to reduce noise. In order to characterize the effective slice thickness of the reconstructed tomosynthesis images, a third phantom (Phantom C) was used. It is similar to phantom A in shape, but the four rods in the phantom A have been replaced by a polystyrene (PS) sphere with a diameter of 6.34 mm. The sphere was fixed on top of a PMMA rod using epoxy and the phantom was filled with vegetable oil. This phantom was scanned twice with identical experimental conditions to generate two sets of images, which were subtracted from each other to generate noise-only images for measurement and analysis of noise properties. To account for the doubling of noise variance due the subtraction operation, a factor of was divided from the noise-only data.
Figure 2.
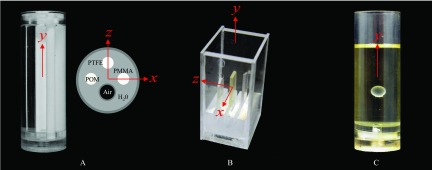
Physical phantoms A, B, and C.
The absorption and DPC tomosynthesis reconstruction methods described in Sec. 2B were implemented using C++. Each tomosynthesis volumetric image reconstruction generated 30 tomosynthesis image slices stacked along the z direction with a offset increment of 1 mm. The inplane pixel size of the tomosynthesis images is 80 × 80 μm2.
Evaluation metrics
In addition to the qualitative comparison between DPC-tomo and PC-tomo with AC-tomo, their image quality was quantitatively assessed using metrics described in this section. Note that some of these well-documented quantitative metrics are not directly applicable to DPC-tomo due to the differential nature of its image signal. For example, the SDNR described below requires the use of large uniform (DC) areas of signal, which cannot be met by differential images.
Signal difference to noise ratio
The SDNR is often used in tomosynthesis imaging for zero-frequency estimation of low contrast detectability. It is defined as23
| (2.9) |
in which denotes the difference in average pixel value between the feature of interest and the background surrounding the feature, σFeature and σBG denote noise standard deviations measured on the feature and the background, respectively. In this work, the SDNR was determined in the infocus tomosynthesis slice of each insert of the three physical phantoms. For Phantom A, the feature was defined on each of the four inserts using a 36 (x) × 300 pixels (y) region of interest (ROI). The background was determined by two 18 × 300 ROIs to the left/right of each insert. For Phantom B, the feature was defined on each flat insert using a 140 × 100 ROI and the background was determined by two 140 × 50 ROIs next to each insert. For Phantom C, the feature was measured using a 48 × 48 ROI inside the sphere and the background was determined by four 12 × 48 ROIs surrounding the sphere.
Phase/absorption signal ratio
Unlike its CT counterpart, DPC tomosynthesis does not quantitatively measure δ due to artifacts associated with the limited angular span and limited angular sampling of the projection data acquisition. Nevertheless, its signal intensity is still expected to be linearly proportional to δ because of the linear nature of the data acquisition system and the FBP reconstruction algorithm. Similarly, the signal intensity of AC-tomo is expected to be proportional to the linear attenuation coefficient, μ. In other words, the ratio between the PC-tomo signal and AC-tomo signal should be the same as δ/μ of the same material measured at the same x-ray energy. This means that the magnitude of PC-tomo signal can be accurately predicted from conventional AC-tomo, as long as δ/μ is given. We performed an experimental validation of this hypothesis using the measured tomosynthesis signals of the phantom inserts as well as the published values of δ and μ measured from differential phase contrast CT.17, 27
Artifact spread function
The slice thickness of tomosynthesis images is primarily restricted by out-of-focus blurring artifacts induced by the limited angular range of the tomosynthesis acquisition.3, 28 A metric referred to as the ASF has been commonly used in tomosynthesis imaging to characterize the degree and extent of these artifacts. The span or spreading of the profile has been used as a metric to characterize the tomosynthesis slice thickness. The ASF is defined as23
| (2.10) |
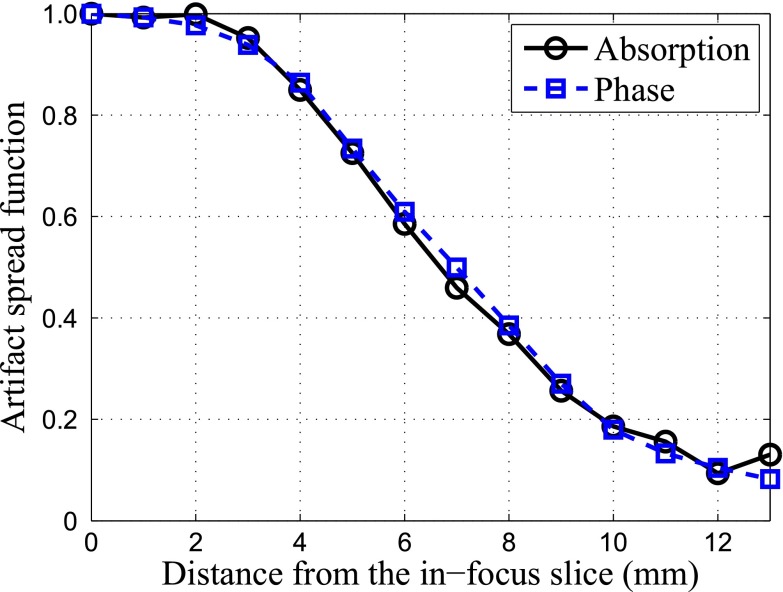
in which z0 is the location of the infocus plane of the feature of interest. Note that ASF is only a relative measure of slice thickness since its span depends on the feature size. In our case, the diameter of the PS sphere (6.34 mm) is much larger than the reconstruction slice thickness. In this study, ASF was used to compared the slice thickness characteristics between AC-tomo and PC-tomo.
Three-dimensional noise power spectrum
Medical x-ray images are fundamentally noise limited due to the radiation dose constraint, and x-ray phase contrast tomosynthesis is no exception. Therefore, it is critical to study the noise performance of each new x-ray imaging system. In this study, the noise properties of both PC-tomo and DPC-tomo were characterized by experimental 3D NPS measurements, which quantify both the magnitude and spatial correlation of noise generated from 3D imaging systems. It was calculated from the noise-only tomosynthesis image volume (generated by scanning Phantom C twice) using the following formula:
| (2.11) |
in which Δx = Δy = 80 μm denote the inplane pixel size, Δz = 1 mm denotes the slice thickness, DFT3D denotes the 3D discrete Fourier transform (DFT), and VOIi denotes each of the M volumes of interest (VOI) used to measure the 3D NPS. The mean VOI, , is given by
| (2.12) |
A total of 121 VOIs were obtained by sliding a Nx = Ny = Nz = 180 × 180 × 30 volumetric window within the reconstructed tomosynthesis image volume. The frequency sampling rates are 0.070, 0.070, and 0.035 mm−1 along the fx, fy, and fz directions, respectively. The 3D NPS was measured for AC-tomo, DPC-tomo, and PC-tomo acquired with the same x-ray exposure and system setup.
RESULTS
Reconstructed tomosynthetic images
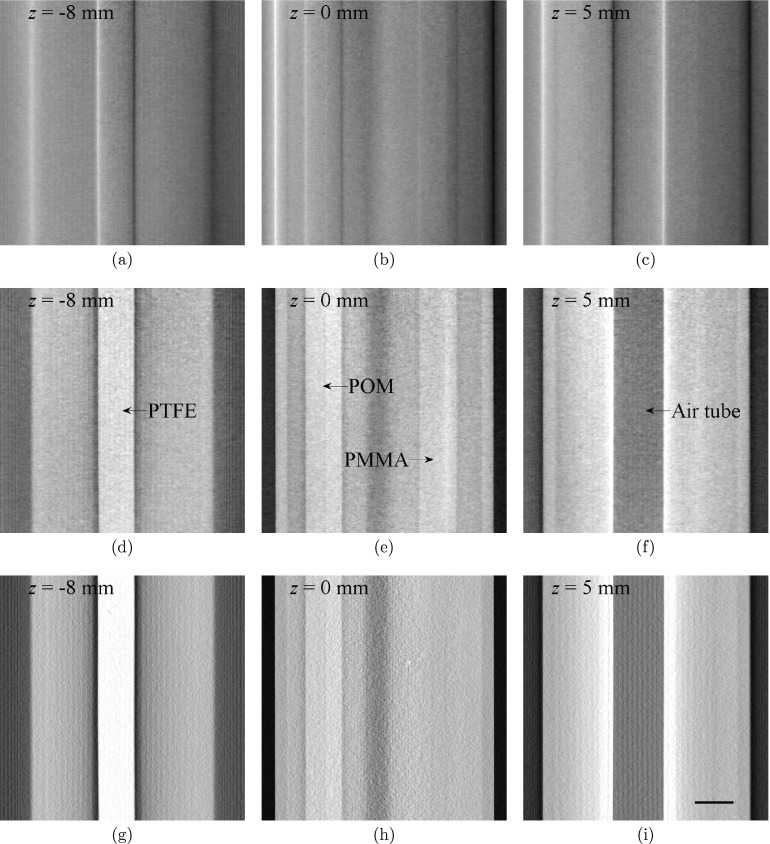
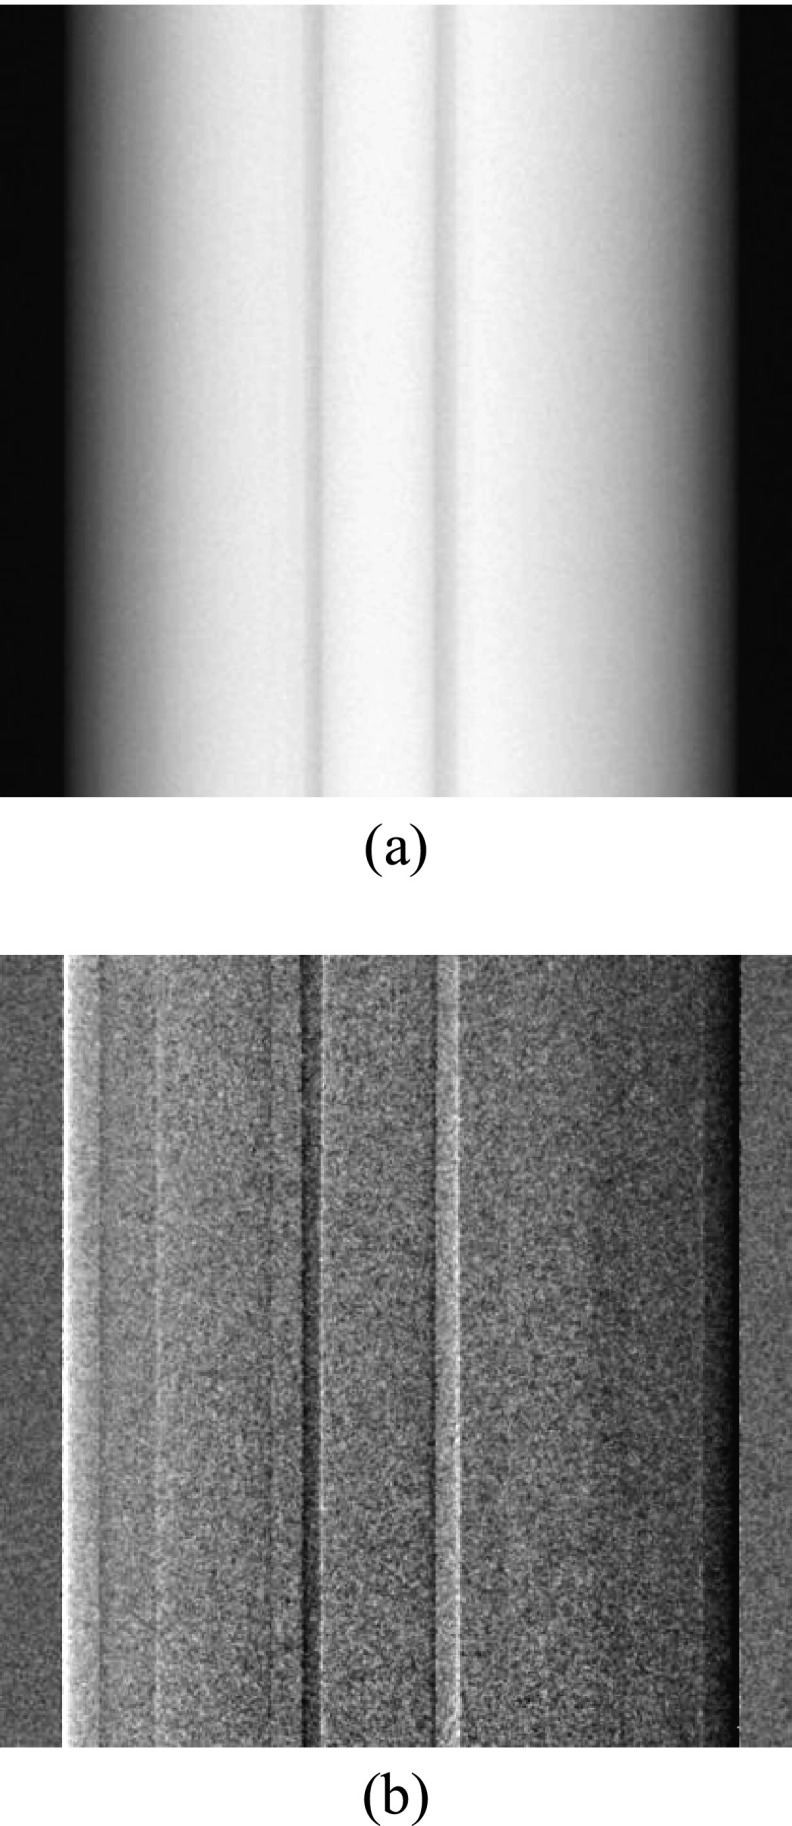
Figure 4 shows reconstructed tomosynthesis images of phantom A that contains the four cylindrical inserts. As a comparison, planar projection images acquired at the central projection angular position were shown in Fig. 3. A noticeable difference in the appearance and visibility of each insert across different contrast mechanism can be immediately appreciated. The edges of the inserts are highlighted in the DPC-tomo images, which is similar in appearance to the planar DPC projection image in Fig. 3b. However, majority of the structural overlap in the planar projection has been removed in the DPC-tomo images, demonstrating a clear advantage of the DPC tomosynthesis imaging method over the DPC projection imaging method. Similar to all other limited angle tomography methods, interslice blurring and signal cross-talk are present in both DPC-Tomo and PC-Tomo images, as in conventional absorption-based tomosynthesis. One can clearly observe this phenomenon from the high contrast air tube observed in planes at z = 0 mm.
Figure 4.
Tomosynthesis images of Phantom A from DPC-tomo (a)–(c), PC-tomo (d)–(f), and AC-tomo (g)–(i) at three different planes along the z axis. All images were generated from a single tomosynthesis data acquisition. The scale bar in (i) denotes 5 mm. The display range of the images were determined by the minimum and maximum pixel values of the images at z = 0 and their values are [− 3.8, 3.7] × 10−2 (DPC-tomo), [− 3.1, 3.0] × 10−7 (PC-tomo), and [− 2.7, 3.3] × 10−2 (AC-tomo), respectively.
Figure 3.
Planar absorption (a) and DPC (b) projection images of Phantom A acquired at the central projection angle.
The appearance of PC-tomo images is quite different from that of the DPC-tomo image, as they no longer have the “differential” look. This can be attributed to use of the Hilbert filter during the FBP PC-tomo reconstruction, which effectively removes the differentiation operator in Eq. 2.1. The results show that, while each of the four inserts can be easily identified in PC-tomo, only three can be visualized in AC-tomo; the PMMA insert cannot be visualized in the infocus AC-tomo slice in Fig. 4h. This finding provides an example of the potential benefit of the phase contrast tomosynthesis method.
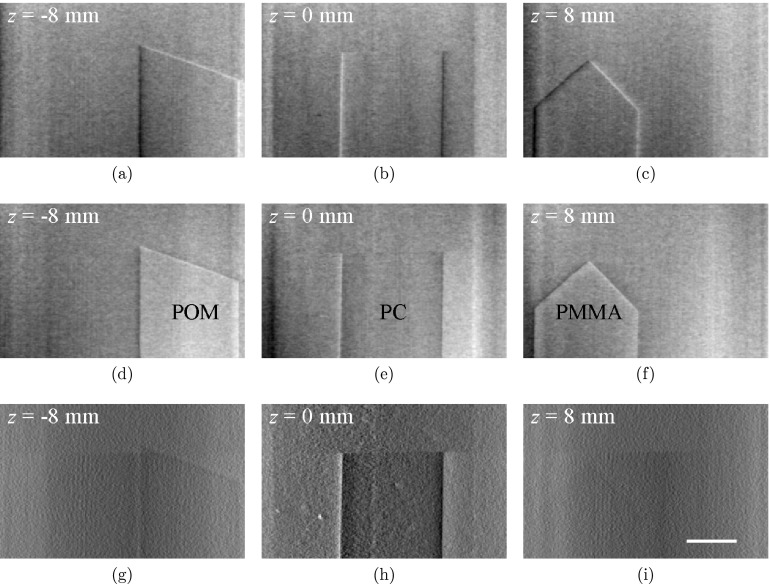
Figure 5 shows tomosynthesis images of phantom B. All three flat inserts in this phantom, including their edges along both x and y directions, can be easily identified in DPC-tomo and PC-tomo images. The overlap of the inserts along the beam direction was also removed in these tomosynthesis images. As a comparison, visibilities of the POM and PMMA inserts in AC-tomo are relatively poor, although the visibility of the polycarbonate insert is better in the AC-tomo.
Figure 5.
Tomosynthesis images of Phantom B with differential phase contrast (a)–(c), phase contrast (d)–(f), and absorption contrast (g)–(i) at three different planes along the z axis. All images were obtained from a single tomosynthesis data acquisition. The scale bar in (i) denotes 5 mm. The display range of the images were determined by the minimum and maximum pixel values of the images at z = 0 and their values are [−4.5× 10⁻³, 4.5× 10⁻³] (DPC-tomo), [0, 1.3× 10⁻⁷] (PC-tomo), and [0.1× 10⁻², 2.1× 10⁻²] (AC-tomo), respectively.
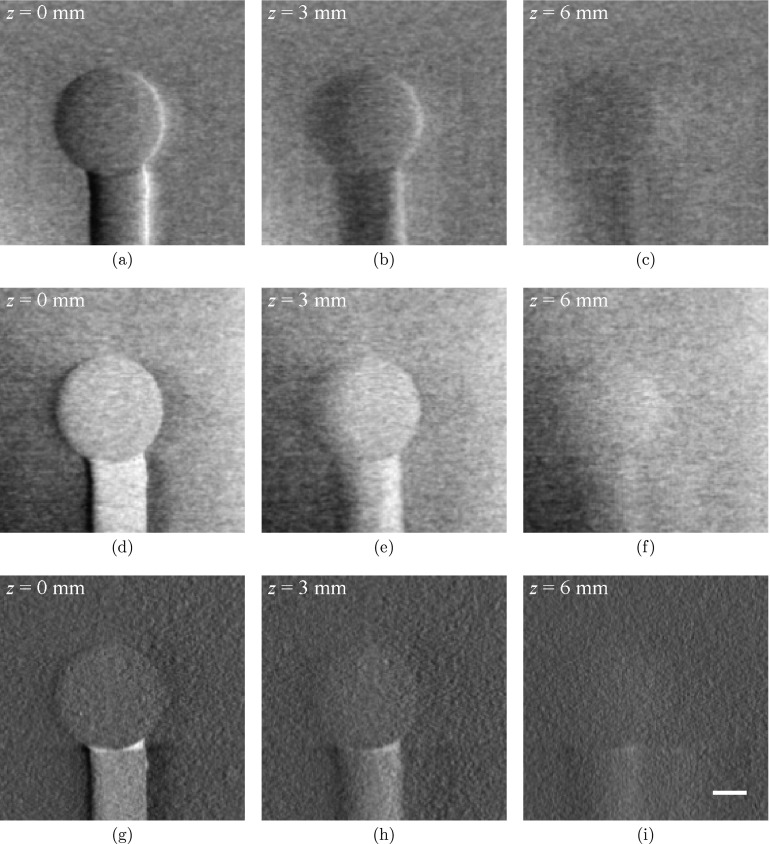
Figure 6 shows tomosynthesis images of phantom C. The PS sphere stands out from the oil bath in the infocus slices of all three sets of tomosynthesis images (DPC-tomo, PC-tomo, and AC-tomo), but its visibility appears to be better in DPC-tomo and PC-tomo than in AC-tomo. At an off-focus position z = 6.0 mm that is much greater than the radius of the sphere (3.2 mm), the sphere is still partially visible in all three contrasts, indicating the limited slice sensitivity of the tomosynthesis method.
Figure 6.
Tomosynthesis images of Phantom C from DPC-tomo (a)–(c), PC-tomo (d)–(f), and AC-tomo (g)–(i). All images were obtained from a single tomosynthesis data acquisition. The scale bar in (i) denotes 2 mm. The display range of the images were determined by the minimum and maximum pixel values of the images at z = 0 and their values are [−4.2× 10⁻², 3.7× 10⁻³] (DPC-tomo), [0.5× 10⁻⁷, 1.4× 10⁻⁷] (PC-tomo), and [−0.2× 10⁻², 2.0× 10⁻²] (AC-tomo), respectively.
Signal magnitude and linearity
Table 1 presents tomosynthesis signal values of different inserts measured in PC-tomo and AC-tomo. The magnitude of the phase contrast tomosynthesis signal (denoted Iδ) and the absorption contrast tomosynthesis signal (denoted Iμ) depends on the tomosynthesis data acquisition and reconstruction method, and is not quantitatively the same as δ and μ. Therefore, we were more interested in the linearity of these signal values. The ratio between and reference17, 27 is listed in the last row of Table 1. The data show that this ratio is about one for the materials tested in our study. Therefore, the image values of the FBP-reconstructed PC-tomo images is linearly related to δ, and one can quantitatively predict this value if an AC-tomo reconstruction of the same material is provided, namely,
| (3.1) |
Table 1.
Experimentally measured phase contrast tomosynthesis signal values (denoted Iδ) and absorption contrast tomosynthesis signal values (denoted Iμ) for different materials. The experimental values are reported in the format of mean ± one standard deviation (σ). The reference δ (dimensionless) and μ values were taken from Refs. 17 and 27 .
| PMMA | POM | PTFE | Air | H2O | PC | POM | PS | Oil | |
|---|---|---|---|---|---|---|---|---|---|
| Iδ (10−7) | 1.5 ± 0.2 | 1.7 ± 0.2 | 1.8 ± 0.2 | 0.1 ± 0.2 | 1.1 ± 0.2 | 0.8 ± 0.1 | 1.7 ± 0.1 | 1.2 ± 0.1 | 1.0 ± 0.1 |
| Iμ (10−2) | 1.3 ± 0.2 | 1.7 ± 0.2 | 2.6 ± 0.2 | 0.1 ± 0.2 | 1.4 ± 0.2 | 0.9 ± 0.1 | 1.6 ± 0.1 | 1.0 ± 0.1 | 0.9 ± 0.1 |
| 1.2 ± 0.2 | 1.1 ± 0.2 | 1.0 ± 0.1 | 2 ± 5 | 1 ± 0.3 | 1.0 ± 0.2 | N/A | 1.2 ± 0.2 | N/A |
Signal difference to noise ratio
Table 2 presents the measured SDNR values, which can be interpreted as a zero-frequency estimation of the detectabilities of different phantom inserts. PC-tomo leads to higher SDNR values for PMMA (in water), POM (in water), POM (in water), and PS (in oil), whereas AC-tomo leads to higher SDNR values for PTFE (in water), air (in water), and polycarbonate (in water). These quantitative measurements are consistent with the visual inspection of the reconstructed images described in Sec. 3A, and they demonstrate the capability of phase contrast tomosynthesis imaging in providing complementary information to absorption tomosynthesis imaging.
Table 2.
SDNR for each phantom insert.
| SDNR | PMMA | POM | PTFE | Air | PC | POM | PS |
|---|---|---|---|---|---|---|---|
| Phase | 2.0 | 3.0 | 3.5 | 5.0 | 2.0 | 4.0 | 2.0 |
| Absorption | 0.5 | 1.5 | 6 | 6.5 | 3.3 | 1.3 | 1.0 |
Artifact spread function
As shown in Fig. 7, the artifact spread functions of AC-tomo and PC-tomo are almost identical, indicating that the two types of tomosynthesis images have similar slice thickness.
Figure 7.
ASF for AC-tomo and PC-tomo.
Three-dimensional NPS
The 3D NPS results are shown in Fig. 8. It can be immediately observed that the frequency distributions of the NPS in DPC-tomo and PC-tomo are almost identical. This is due to the unique frequency dependence of the Hilbert kernel used during the PC-tomo reconstruction [Eq. 2.8], which is similar to the Dirac delta function except for its sign and numerical magnitude. During the NPS calculation, each PC-tomo data set is multiplied by its complex conjugate, which effectively removes the Hilbert kernel in the filtered-backprojection and makes the final NPS look similar to data processed by the direct backprojection reconstruction. This kind of NPS features greater low-frequency noise and less high-frequency noise.
Figure 8.
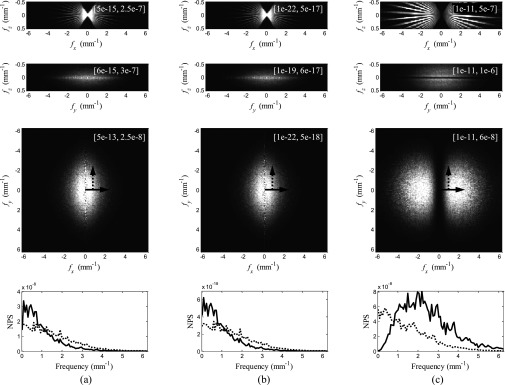
(a) NPS of DPC-tomo. (b) NPS of PC-tomo. (c) NPS of AC-tomo. The first three rows are generated by projecting the 3D NPS along the y, x, and z axes, respectively. Numbers in the square brackets are the display ranges for each image. Line profiles through the third row (indicated by the arrows) are presented in the last row.
Despite this similarity, the magnitudes of the NPS of DPC-tomo and PC-tomo differ by about 10 orders of magnitude, which is approximately the same as the square of the difference in their signal magnitudes (≈105). This difference in the noise magnitudes is induced by the (2πzT)/p2 factor in the fundamental DPC imaging equation 2.1, which is essentially the amplification factor of the x-ray refraction angle introduced by the grating interferometer. The FBP reconstruction of PC-tomo needs to compensate for this factor in order to restore the refraction angle information, whereas the SAA reconstruction of DPC-tomo does not need such a compensation. This is the fundamental reason why the magnitude of the NPS of PC-tomo is much smaller than that of DPC-tomo.
In comparison, the NPS of AC-tomo demonstrates a different noise distribution, which peaks at certain intermediate frequency because of the use of the ramp kernel along the u axis of the detector. The magnitudes of the NPS of DPC-tomo and AC-tomo are the same, since both were reconstructed without being scaled by p2/(2πzT).
DISCUSSION
This study demonstrates that, by using different reconstruction algorithms (FBP vs SAA), PC-tomo images that are linearly related to the δ value in the complex refractive index and DPC-tomo images that are still differential in appearance can be obtained. Their noise textures are surprisingly similar due to the unique filtering kernel used in the FBP reconstruction of PC-tomo. In practice, which of the two reconstruction schemes is more advantageous would be highly dependent on specific imaging tasks. For example, it would be easier to detect edge information in differential images, whereas the phase images are of value in detecting large-area low contrast signals. However, neither PC-tomo or DPC-tomo should be used to replace AC-tomo. Our results suggest that the absorption and phase contrast mechanisms provide complementary information, and would be most valuable if used in tandem.
A benchtop system equipped with a rotary object stage was used in this study. In principle, this is equivalent to the tomosynthesis data acquisition geometry drawn in Fig. 1a, in which the object is fixed in position while the tube-grating-detector assembly rotates around the object (the Grossman geometry). This geometry guarantees that the gratings are kept perpendicular to the x-ray beams, which allows the x rays to pass through the object-grating-detector assembly without being blocked by the side walls of grooves in the gratings. In clinical practice, this Grossman geometry can be realized by using a C-arm x-ray imaging system. However, many existing clinical tomosynthesis imaging systems are DBT imaging systems and these systems use the static detector geometry shown in Fig. 1b. In order to combine the DPC tomosynthesis imaging method with clinical DBT systems, the gratings need to be rotated by 90° about the axis that is parallel to the x-ray beam, which will result in x-ray incidence (onto the G1 and G2 gratings) at some glancing angle (except for the central projection view). This setup is expected to further improve the performance of the Talbot-Lau interferometers, as the effective thickness of the x-ray absorber in the G2 grating increases.29, 30 Details about this setup and the adaptation method of DPC tomosynthesis to clinical DBT systems will be presented in a separate paper.
Over the course of this study, the performance of DPC tomosynthesis system was always compared with the associated absorption tomosynthesis system with the radiation dose to the object being matched. However, the absorption tomosynthesis images were acquired with the interferometer gratings present, one of which (G2) absorbs approximately 50% of the post-object x-ray photons. In contrast, the current standalone absorption tomosynthesis does not require any grating for image formation. Therefore, a fair comparison of the diagnostic performances of the two tomosynthesis imaging methods needs to be performed with the dose penalty added by the G2 grating taken into account.31
Another limitation of this study is the lack of quantitative inplane spatial resolution measurement, which plays an important role in determining the visibility of edges/boundaries and fine objects such as microcalcifications in breast imaging. The quantification of inplane spatial resolution is often achieved using a highly x-ray attenuating object with straight and sharp edge, the signal of which in the reconstructed image can be translated into edge response functions (ERF) and MTF. This method, however, cannot be directly extended to DPC tomosynthesis. This is because of the limited dynamic range of phase (ϕ) measurement, which is limited to (−π, π) as emphasized in Ref. 32. The actual DPC signal of an edge of high contrast is out of this range and is subject to error caused by phase wrapping. Therefore, an edge phantom made of low density material have to be used to measure the spatial resolution of DPC images. On the other hand, such a phantom is likely to introduce an additional challenge to the MTF measurement because of its low contrast-to-noise level.
CONCLUSIONS
In conclusion, the feasibility and basic imaging physics characteristics of the proposed x-ray DPC tomosynthesis imaging have been investigated using an experimental benchtop system and physical phantoms. It was demonstrated that the shift-and-add algorithm can be used to reconstruct differential tomosynthesis images based on the DPC mechanism, while a modified FBP algorithm can generate non-differential phase tomosynthesis images directly from the differential phase contrast projection data. The reconstructed tomosynthesis images provide information that is complementary to that derived from the conventional absorption-based tomosynthesis images, and their slice thickness is the same as the associated absorption tomosynthesis images. The noise power spectrum of both the differential phase images and the phase images were fundamentally different from that of the absorption tomosynthesis images. These results provide the necessary imaging physics foundation for the further investigations of the DPC tomosynthesis imaging method for potential use in medical imaging.
References
- Grant D. G., “TOMOSYNTHESIS: A three-dimensional radiographic imaging technique,” IEEE Trans. Biomed. Eng. BME-19, 20–28 (1972). 10.1109/TBME.1972.324154 [DOI] [PubMed] [Google Scholar]
- Tingberg A., “X-ray tomosynthesis: A review of its use for breast and chest imaging,” Radiat. Prot. Dosim. 139, 1–8 (2010). [DOI] [PubMed] [Google Scholar]
- Sechopoulos I., “A review of breast tomosynthesis. Part I. The image acquisition process,” Med. Phys. 40, 014301 (12pp.) (2013). 10.1118/1.4770279 [DOI] [PMC free article] [PubMed] [Google Scholar]
- Sechopoulos I., “A review of breast tomosynthesis. Part II. Image reconstruction, processing and analysis, and advanced applications,” Med. Phys. 40, 014302 (17pp.) (2013). 10.1118/1.4770281 [DOI] [PMC free article] [PubMed] [Google Scholar]
- Niklason L. T., Christian B. T., Niklason L. E., Kopans D. B., Castleberry D. E., Opsahl-Ong B. H., Landberg C. E., Slanetz P. J., Giardino A. A., Moore R., Albagli D., DeJule M. C., Fitzgerald P. F., Fobare D. F., Giambattista B. W., Kwasnick R. F., Liu J., Lubowski S. J., Possin G. E., Richotte J. F., Wei C. Y., and Wirth R. F., “Digital tomosynthesis in breast imaging,” Radiology 205, 399–406 (1997). [DOI] [PubMed] [Google Scholar]
- Als-Nielsen J. and McMorrow D., Elements of Modern X-Ray Physics (Wiley, New York, 2001). [Google Scholar]
- Maksimenko A., Yuasa T., Ando M., and Hashimoto E., “Refraction-based tomosynthesis: Proof of the concept,” Appl. Phys. Lett. 91, 234108 (2007). 10.1063/1.2819605 [DOI] [Google Scholar]
- Kang K., Huang Z., Zhu P., and Zhang L., “DEI-based phase-contrast tomosynthetic experiment on biological samples with high resolution x-ray CCD camera,” 2008 IEEE NSS Conference Record (Dresden, Germany, 2008), pp. 1451–1454. 10.1109/NSSMIC.2008.4774688 [DOI]
- Zhang L., Jin M., Huang Z., Xiao Y., Yin H., Wang Z., and Xiao T., “Phase-contrast tomosynthetic experiment on biological samples with synchrotron radiation,” 2010 IEEE NSS Conference Record (Knoxville, TN, 2010), pp. 1619–1621. 10.1109/NSSMIC.2010.5874050 [DOI]
- Hammonds J. C., Price R. R., Donnelly E. F., and Pickens D. R., “Phase-contrast digital tomosynthesis,” Med. Phys. 38, 2353–2358 (2011). 10.1118/1.3574871 [DOI] [PubMed] [Google Scholar]
- Wu X., Liu H., and Yan A., “X-ray phase-attenuation duality and phase retrieval,” Opt. Lett. 30, 379–381 (2005). 10.1364/OL.30.000379 [DOI] [PubMed] [Google Scholar]
- Yan A., Wu X., and Liu H., “Performance analysis of the attenuation-partition based iterative phase retrieval algorithm for in-line phase-contrast imaging,” Opt. Express 18, 16074–16089 (2010). 10.1364/OE.18.016074 [DOI] [PMC free article] [PubMed] [Google Scholar]
- Hammonds J. C., Price R. R., Pickens D. R., and Donnelly E. F., “In-line phase shift tomosynthesis,” Med. Phys. 40, 081911 (5pp.) (2013). 10.1118/1.4813295 [DOI] [PubMed] [Google Scholar]
- Momose A., Kawamoto S., Koyama I., Hamaishi Y., Takai H., and Suzuki Y., “Demonstration of x-ray Talbot interferometry,” Jpn. J. Appl. Phys. 42, L866–L868 (2003). 10.1143/JJAP.42.L866 [DOI] [Google Scholar]
- Weitkamp T., Diaz A., David C., Pfeiffer F., Stampanoni M., Cloetens P., and Zeigler E., “X-ray phase imaging with a grating interferometer,” Opt. Express 13, 6296–6304 (2005). 10.1364/OPEX.13.006296 [DOI] [PubMed] [Google Scholar]
- Pfeiffer F., Weitkamp T., Bunk O., and David C., “Phase retrieval and differential phase-contrast imaging with low-brilliance x-ray sources,” Nat. Phys. 2, 258–261 (2006). 10.1038/nphys265 [DOI] [Google Scholar]
- Zambelli J., Bevins N., Qi Z., and Chen G.-H., “Radiation dose efficiency comparison between differential phase contrast CT and conventional absorption CT,” Med. Phys. 37, 2473–2479 (2010). 10.1118/1.3425785 [DOI] [PMC free article] [PubMed] [Google Scholar]
- Chen G., Zambelli J., Li K., Bevins N., and Qi Z., “Scaling law for noise variance and spatial resolution in differential phase contrast computed tomography,” Med. Phys. 38, 584–588 (2011). 10.1118/1.3533718 [DOI] [PMC free article] [PubMed] [Google Scholar]
- Born M. and Wolf E., Principles of Optics (Pergamon, New York, 1993). [Google Scholar]
- Sato G., Kondoh T., Itoh H., Handa S., Yamaguchi K., Nakamura T., Nagai K., Ouchi C., Teshima T., Setomoto Y., and Den T., “Two-dimensional gratings-based phase-contrast imaging using a conventional x-ray tube,” Opt. Lett. 36, 3551–3553 (2011). 10.1364/OL.36.003551 [DOI] [PubMed] [Google Scholar]
- Bevins N., Zambelli J., Li K., Qi Z., and Chen G.-H., “Multicontrast x-ray computed tomography imaging using Talbot-Lau interferometry without phase stepping,” Med. Phys. 39, 424–428 (2012). 10.1118/1.3672163 [DOI] [PMC free article] [PubMed] [Google Scholar]
- Lauritsch G. and Haerer W., “Theoretical framework for filtered back projection in tomosynthesis,” Proc. SPIE 3338, 1127–1137 (1998). 10.1117/12.310839 [DOI] [Google Scholar]
- Wu T., Moore R., Rafferty E., and Kopans D., “A comparison of reconstruction algorithms for breast tomosynthesis,” Med. Phys. 31, 2636–2647 (2004). 10.1118/1.1786692 [DOI] [PubMed] [Google Scholar]
- J. T.DobbinsIII and Godfrey D. J., “Digital x-ray tomosynthesis: Current state of the art and clinical potential,” Phys. Med. Biol. 48, R65–R106 (2003). 10.1088/0031-9155/48/19/R01 [DOI] [PubMed] [Google Scholar]
- Galigekere R., Wiesent K., and Holdsworth D., “Cone-beam reprojection using projection-matrices,” IEEE Trans. Med. Imaging 22, 1202–1214 (2003). 10.1109/TMI.2003.817787 [DOI] [PubMed] [Google Scholar]
- Chen G. H. and Qi Z., “Image reconstruction for fan-beam differential phase contrast computed tomography,” Phys. Med. Biol. 53, 1015–1025 (2008). 10.1088/0031-9155/53/4/013 [DOI] [PMC free article] [PubMed] [Google Scholar]
- del Rio M. S. and Dejus R. J., X-ray Oriented Programs (XOP), Version 2.3 (European Synchrotron Radiation Facility (ESRF), Grenoble, France, 2009). [Google Scholar]
- Sechopoulos I. and Ghetti C., “Optimization of the acquisition geometry in digital tomosynthesis of the breast,” Med. Phys. 36, 1199–1207 (2009). 10.1118/1.3090889 [DOI] [PubMed] [Google Scholar]
- Stutman D. and Finkenthal M., “Glancing angle Talbot-Lau grating interferometers for phase contrast imaging at high x-ray energy,” Appl. Phys. Lett. 101, 091108 (2012). 10.1063/1.4748882 [DOI] [PMC free article] [PubMed] [Google Scholar]
- Stutman D., Stayman J. W., Finkenthal M., and Siewerdsen J. H., “High energy x-ray phase-contrast imaging using glancing angle grating interferometers,” Proc. SPIE 8668, 866814 (2013). 10.1117/12.2007930 [DOI] [PMC free article] [PubMed] [Google Scholar]
- Li K., Bevins N., Zambelli J., and Chen G.-H., “Fundamental relationship between the noise properties of grating-based differential phase contrast CT and absorption CT: Theoretical framework using a cascaded system model and experimental validation,” Med. Phys. 40, 021908 (15pp.) (2013). 10.1118/1.4788647 [DOI] [PMC free article] [PubMed] [Google Scholar]
- Li K., Zambelli J., Bevins N., Ge Y., and Chen G.-H., “Spatial resolution characterization of differential phase contrast CT systems via modulation transfer function (MTF) measurements,” Phys. Med. Biol. 58, 4119–4135 (2013). 10.1088/0031-9155/58/12/4119 [DOI] [PMC free article] [PubMed] [Google Scholar]


