Abstract
In-situ x-ray absorption spectroscopy (XAS) is a powerful technique that can be applied to electrochemical systems, with the ability to elucidate the chemical nature of electrocatalysts under reaction conditions. In this study, we perform in-situ XAS measurements on a bifunctional manganese oxide (MnOx) catalyst with high electrochemical activity for the oxygen reduction reaction (ORR) and the oxygen evolution reaction (OER). Using x-ray absorption near edge structure (XANES) and extended x-ray absorption fine structure (EXAFS), we find that exposure to an ORR-relevant potential of 0.7 V vs. RHE produces a disordered Mn3II,III,IIIO4 phase with negligible contributions from other phases. After the potential is increased to a highly anodic value of 1.8 V vs. RHE, relevant to the OER, we observe an oxidation of approximately 80% of the catalytic thin film to form a mixed MnIII,IV oxide, while the remaining 20% of the film consists of a less oxidized phase, likely corresponding to unchanged Mn3II,III,IIIO4. XAS and electrochemical characterization of two thin film catalysts with different MnOx thicknesses reveals no significant influence of thickness on the measured oxidation states, at either ORR or OER potentials, but demonstrates that the OER activity scales with film thickness. This result suggests that the films have porous structure, which does not restrict electrocatalysis to the top geometric layer of the film. As the portion of the catalyst film that is most likely to be oxidized at the high potentials necessary for the OER is that which is closest to the electrolyte interface, we hypothesize that the MnIII,IV oxide, rather than Mn3II,III,IIIO4, is the phase pertinent to the observed OER activity.
INTRODUCTION
The development of catalytic materials for the oxygen reduction reaction (ORR) and the oxygen evolution reaction (OER) is one of the major challenges in electrochemical energy conversion and storage technologies such as fuel cells, metal-air batteries, electrolysis cells, and solar fuel synthesis reactors. To implement strategies for the rational design of catalysts for the ORR and the OER, it is important to improve understanding of the chemical state and structure of active surfaces under reaction conditions. X-ray absorption spectroscopy (XAS) can be combined with electrochemistry to elucidate the properties of catalytic materials in-situ. X-ray absorption near edge structure (XANES) probes the electronic structure of the catalyst, while the extended x-ray absorption fine structure (EXAFS) probes the bond geometry and coordination of the catalysts. In the past, in-situ XAS measurements have been applied to a variety of ORR and OER catalyst systems. For example, in-situ XAS measurements have been used to track the oxidation state of platinum as a function of potential in the ORR region,1 correlate d-band vacancies on platinum alloy catalysts to oxygen reduction activity,2 and link higher MnIVO2 content to better ORR performance in MnOx catalysts.3,4 The method has also been used to understand the valency and structure of cobalt phosphate and nickel borate OER catalysts5,6 and investigate photochemical oxygen evolution on a tetranuclear manganese cluster.7
Only a few in-situ XAS studies, however, have described changes in the active catalyst phase between the ORR and OER regimes using the same material.8 The significant overpotentials associated with these two reactions make it unlikely that the same surface phase will form under both reductive and oxidative potentials.9 Because of the large number of MnOx phases that may be associated with high ORR4,10-13 and OER activities,14-16 it could be possible for MnOx-based catalysts to change surface structure as a function of potential and still exhibit high activity for both reactions. In our work, we performed in-situ XAS measurements on a bifunctional manganese oxide (MnOx) catalyst with high electrochemical activity for both the ORR and the OER. To prepare a bifunctional MnOx catalyst, we adopted a synthesis procedure previously developed for the deposition of MnOx on glassy carbon (GC)13 to deposition on a gold-coated silicon nitride (Au-Si3N4) window. Using information from in situ XANES and EXAFS we found that the switch from ORR to OER potentials results in a structural change in the MnOx/Au-Si3N4 catalyst and characterized the MnOx phases present under each set of conditions. We also studied samples with two different thicknesses of the catalytic layer to investigate the porosity and electrochemical accessibility of the MnOx films. Our results link specific Mn oxide phases to ORR and OER conditions, thus increasing understanding of oxygen electrocatalysis on MnOx electrodes.
EXPERIMENTAL SECTION
Electrodeposition of Manganese Oxide Catalyst
Prior to manganese oxide (MnOx) electrodeposition, silicon nitride membrane (Si3N4) windows (1000 nm membrane, Silson Ltd.) were sputter coated with a 10 nm binding layer of titanium and a 100 nm layer of gold to produce a suitable electrode substrate (Au Si3N4). The catalyst was synthesized via a previously reported procedure.13,17 The electrolyte used for deposition was prepared by dissolving 0.71 g of sodium sulfate (Sigma-Aldrich, >99.0%) and 1.23 g of manganous acetate (Aldrich, 99.99%) in 50 mL of Millipore water at room temperature, yielding a solution with pH of 7.4. The solution was then aged for 6 days, until the pH dropped to approximately 7. Manganese oxide was electrodeposited in a three electrode electrochemical cell using the Au-Si3N4 substrate contacted by copper tape as the working electrode, a Ag∣AgCl reference electrode, and a graphite foil counter electrode. Before performing electrodeposition, the resistance between the working and reference electrodes was measured to ensure proper electrical contact between copper tape and the gold layer of Au-Si3N4. After establishing a proper contact and achieving a resistance of 30-60 Ω, the potential was iR compensated to 85% and cycled nine times between 0.0 and 0.6 V vs Ag∣AgCl at a sweep rate of 20 mV·s−1. The Au-Si3N4 membrane coated with the resulting thin film was placed in a ceramic boat (Fisher Scientific) and heat treated in air at 480°C for 10 hours in a tube furnace (Mellen Company SC13).
Electrochemical Characterization
The electrochemical activity of the electrodeposited MnOx thin film was first evaluated using cyclic voltammetry in a three-electrode electrochemical cell. All cyclic voltammograms (CVs) were iR-compensated to 85% and measured in 0.1 M KOH electrolyte at 23°C with a sweep rate of 20 mV·s−1, using a carbon rod counter electrode and a Ag∣AgCl reference electrode. The electrolyte (0.1 M KOH) was prepared from high purity KOH pellets (Sigma-Aldrich, 99.99%) by adding 5.60 g of pellets to 1 L of Millipore water. The potential scale was calibrated to a reversible hydrogen electrode (RHE) at the end of the catalyst characterization in a hydrogen saturated electrolyte with platinum nanoparticles as the working electrode (20-wt.% Pt on Vulcan XC-72, Etek). The potential of 0.960 V at which the current crossed zero was taken to be the thermodynamic potential for the hydrogen electrode reactions. All potentials during electrochemical characterization are reported vs. RHE. To characterize the activity of the catalyst for the oxygen evolution reaction (OER) and the oxygen reduction reaction (ORR), CVs were performed over a potential range of 0.05 V to 1.8 V in an oxygen saturated environment. Additional CVs were performed from 0.05 to 1.1 V in oxygen and nitrogen saturated environments to confirm the electro-catalytic activity of the catalyst for the ORR.
Physical Characterization
The morphology of the MnOx catalyst was studied using scanning electron microscopy (SEM, FEI Magellan 400 XHR). A 25 pA beam current of 5 kV and a secondary electron detector were used. The crystal structure of MnOx catalyst was investigated using x-ray diffraction with Cu Kα1 radiation and λ=1.54 Å, operated at 45 kV and 40 mA (XRD, Phillips X’Pert 2). 2θ scans from 10° to 90° were performed on the catalyst and the bare Au-Si3N4 substrate, at a scan speed of 0.02°·s−1.
Ex-situ XPS Characterization
The manganese oxidation state and potassium intercalation were studied by x-ray photoelectron spectroscopy using monochromated Al Kα 1486.6 eV x-rays (XPS, PHI 5000 VersaProbe). Three samples were investigated: an as-prepared sample, an ORR relevant sample, and an OER relevant sample. To prepare the ORR and OER relevant samples, MnOx on Au-Si3N4 was cycled from 0.05 V vs. RHE to a vertex potential of either 0.70 or 1.8 V vs. RHE, held at the vertex potential for 10 minutes, extracted from the electrochemical cell under potential control, and characterized using XPS. During the ex-situ XPS characterization, the high resolution spectra in Mn 2p, Mn 3s, and C 1s/K 2p regions were obtained on the MnOx catalysts, and four powder standards: MnIIO, Mn3II,III,III, Mn2IIIO3, and MnIVO2 (Sigma-Aldrich). Mn3II,III,III IIIO4, Mn2IIIO3, and MnIVO2 powders were used as received, while MnIIO powder was sputtered prior to collecting XPS spectra to remove the oxidized surface known to form on MnIIO in air.18 All spectra were collected using a pass energy of 23.5 eV, an energy step of 0.1 eV, and a time of 20 ms per step and were calibrated to the position of adventitious carbon at 285.0 eV.19 The specific energy windows and the number of scans used to acquire each high resolution spectrum are provided in Table S1. Details describing XPS data analysis are provided in Supporting Information (SI). To monitor changes in the Mn oxidation state of MnOx catalyst, we looked at the distance between Mn 2p1/2 peak and its satellite (Δ2p1/2) and the magnitude of the Mn 3s multiplet splitting (ΔE3s), which have been previously shown to either increase (Δ2p1/2) or decrease (ΔE3s) with increasing Mn oxidation state in powder standards.20,21 This trend is especially clear when using MnIIO, Mn2IIIO3, and MnIVO2 powders, representing MnII, MnIII, and MnIV oxidation states, while inclusion of additional phases, such as Mn3II,III,IIIO4, does not offer a greater ability to discriminate between the oxidation states.21,22 The Mn 2p and the Mn 3s spectra of Mn3II,III,IIIO4 are characterized by broader peaks and its 2p1/2 satellite position falls between Mn2IIIO3 and MnIVO2, despite its lower oxidation state than that of either Mn2IIIO3 or MnIVO2.20,21 For comparison we collected the spectra of Mn3II,III,IIIO4 powder and present it alongside the other standards. In agreement with previous reports, we find that for our catalyst samples, XPS alone is not sufficient to distinguish between the Mn2IIIO3 and Mn3II,III,IIIO4 phases.
In-situ Mn K-edge XAS
X-ray absorption spectra (XAS) were collected at the Advanced Light Source (ALS) on beamline 10.3.223 with an electron energy of 1.9 GeV and an average current of 500 mA. The radiation was monochromatized by a Si (111) double-crystal monochromator. The intensity of the incident X-ray was monitored by an N2-filled ion chamber (I0) in front of the sample. Fluorescence spectra were recorded using a seven-element Ge solid-state detector. For electrochemical experiments, no transmission data could be collected. The energy was therefore calibrated using a glitch in the I0 relative to the absorption edge of Mn foil, as is commonly employed in XAS experiments. All data were collected at room temperature. Data reduction of the XAS spectra was performed using custom-made software. Pre-edge and post-edge contributions were subtracted from the XAS spectra, and the results were normalized with respect to the edge jump. Background removal in k-space was achieved through a five-domain cubic spline. Curve fitting was performed with Artemis and IFEFFIT software using ab initio-calculated phases and amplitudes from the program FEFF 8.2.24,25 The details of curve fitting are discussed in SI. A schematic of the in-situ setup is shown in Figure 1. In this setup, the back side of the Si3N4 window was exposed to x-rays, while the front side of the Si3N4 window with electrodeposited MnOx on Au/Ti layer faced into the interior of the electrochemical cell. Electrochemistry was performed using a Ag∣AgCl reference electrode, a platinum wire counter electrode, and 0.1 M KOH electrolyte exposed to ambient air. Although RHE calibration was not performed during in-situ XAS characterization, we assumed the same shift of 0.960 V for the Ag∣AgCl reference electrode and report all potentials vs. RHE. After preparing the electrochemical cell for in-situ XAS measurements, the resistance between the working and reference electrodes was measured to ensure proper electrical contact between the potentiostat and MnOx on Au-Si3N4. After achieving a resistance of 150 Ω, a CV was performed from 0.05 to 1.1 V to record the electrochemical features of the working electrode. During in-situ XAS at ORR relevant conditions, the potential was held at 0.7 V for 3.4 hours. After the completion of the measurement, the resistance between the working and reference electrodes was measured to be 73 Ω and iR-compensated cyclic voltammetry was performed from 0.05 V to 1.8 V to record bi-functional OER/ORR activity of the working electrode. During in-situ XAS at OER relevant conditions, the iR-compensated potential was held at 1.8 V for 5 hours. The solutions were not stirred during the measurements. After each potential change, the system was allowed to equilibrate for 5 min. Spectra were acquired in Quick-EXAFS (QXAS) mode. For the thick (9 cycles) samples, 4 sets of 20 spectra each lasting 3 minutes were recorded. For the thin samples (1 cycle), 20 sets of 20 spectra that lasted 3 minutes each were recorded. No spectral changes were observed between the first and last spectrum of a series of 20 scans or between the first and last sets of spectra, as shown in Figures S1 and S2. Typical EXAFS spectra demonstrating the signal to noise for each electrochemical condition are provided in Figure S3.
Figure 1.
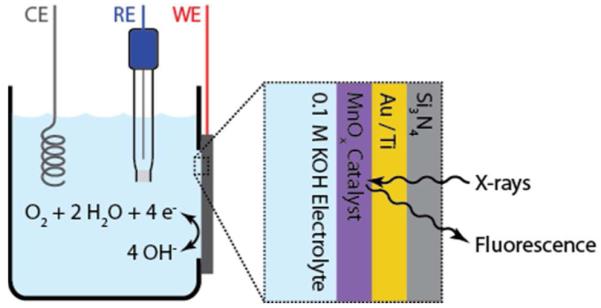
In-situ XAS set-up, with the back-side of Si3N4 window facing the x-rays and the front side of the window, with electrodeposited MnOx on a layer of Au/Ti facing the electrolyte. CE, RE and WE stand for counter, reference and working electrode, respectively.
The collected XAS spectra of MnOx on Au-Si3N4 were compared to ex-situ XAS spectra of model MnOx compounds, including MnIIO, Mn3II,III,IIIO4, alpha-Mn2IIIO3, gamma-MnIIIOOH, beta-MnIVO2, and Mg2+ birnessite. MnIIO and Mn3II,III,IIIO4 powders were obtained from Sigma-Aldrich and used as purchased. Beta-MnIVO2 and alpha-Mn2IIIO3 phases were prepared by dissolving Mn(NO3)2·H2O in water, drying the solution at 60 °C for 24 hours, and calcining the powder for 3 hours at 200 °C or 500 °C, respectively. Gamma-MnIIIOOH powder was synthesized by preparing a solution consisting of 8 mM MnSO4 and 8 mM NH4S2O8, adjusting it to pH10 using 1 M NaOH, and heating it in a sealed autoclave at 120°C for 10 hours; the resulting powder was then washed and dried under vacuum. Powder XRD was used to confirm the phase of each synthesized compound (Figure S4). The details of Mg2+ birnessite syn- for deposition of MnOx catalyst onto a glassy carbon (GC) support.13 The resulting electrode, MnOx/Au-Si3N4, exhibited the expected bifunctional activity for both oxygen evolution reaction (OER) and oxygen reduction reaction (ORR) in alkaline electrolyte. The OER activity was confirmed by the formation of visible oxygen bubbles on the electrode surface at high oxidizing potentials, while the ORR activity was confirmed by performing additional characterization in both nitrogen and oxygen thesis and powder XRD characterization are described in a previously published study by Webb and co-workers.26 Table S2 in the SI provides a summary of all the standards used in this work as well as other MnOx phases mentioned in the text.
RESULTS AND DISCUSSION
MnOx/Au-Si3N4 Catalyst
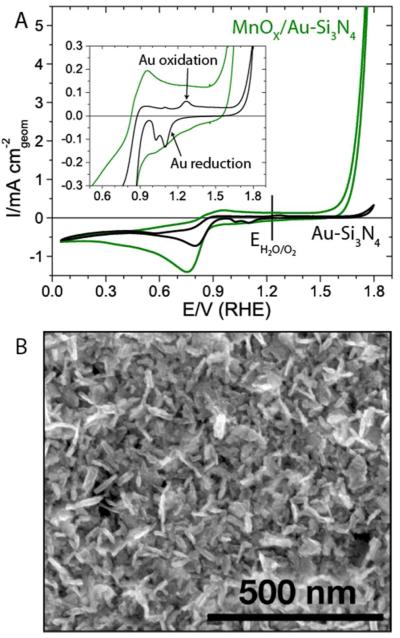
To investigate the material properties of an active manganese oxide (MnOx) catalyst under reaction conditions, we prepared MnOx on a gold-coated silicon nitride membrane (Au-Si3N4) following a previously developed procedure saturated electrolytes, which showed a significant increase in the reductive current in the presence of oxygen (Figure S5). To verify that MnOx is the active species responsible for the OER and the ORR, we compared the catalytic activity of MnOx/Au-Si3N4 to that of the bare support, Au-Si3N4 (Figure 2A). The catalyst clearly out-performs the bare gold support for the OER, but demonstrates similar ORR activity to Au-Si3N4. To deconvolute the contributions from MnOx and Au in the observed ORR activity of the MnOx/Au-Si3N4 catalyst, we examined the cyclic voltammograms of MnOx/Au-Si3N4 and bare Au-Si3N4 in the potential region from 1.0 V to 1.4 V, where gold oxidation and reduction features are prominent.27 The electrochemical behavior of the electrodes, plotted in the inset of Figure 2A, demonstrates that the surface in MnOx/Au-Si3N4 catalyst does not display significant redox features characteristic to gold, indicating that the Au is electrochemically inaccessible. This finding links the observed ORR activity of MnOx/Au-Si3N4 to the MnOx surface. Comparison of the bifunctional oxygen electrode activity of MnOx/Au-Si3N4 to the previously reported activity of MnOx/GC (Figure S6) demonstrates that the two catalysts have similar catalytic activity when normalized to the geometric surface area.
Figure 2.
A. Cyclic voltammetry of the MnOx catalyst in O2 showing bifunctional ORR/OER activity and the background activity of the Au-Si3N4 support. Inset shows the disappearance of Au redox features after addition of MnOx; B. Scanning electron microscopy image illustrating needle-like morphology of MnOx.
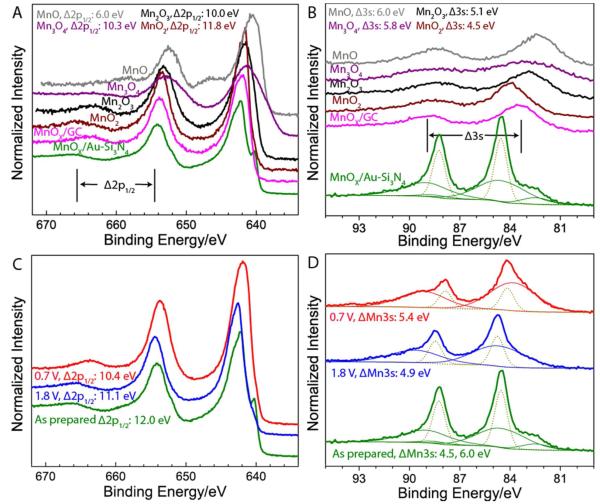
ex-situ XPS characterization of MnOx/GC determined that the catalyst deposits as Mn(III) oxide13 and that the possible changes to the surface oxidation state after an application of the ORR or the OER relevant potentials are too small to be detected by ex-situ XPS.28 Similar ex-situ XPS characterization of MnOx/Au-Si3N4 surface shown in Figure 3 reveals important differences between MnOx deposited Au-Si3N4 and GC. In Figure 3A, we compare the Mn 2p spectra of MnOx/Au-Si3N4 and MnOx/GC to the spectra of powder controls. Unlike the spectrum of MnOx/GC, which has similarities to the spectrum of Mn2IIIO3, the spectrum of MnOx/Au-Si3N4 has characteristics of two different spectra corresponding to MnIIO and MnIVO2. The MnIIO characteristics are established by the peak at 640 eV, a corresponding shoulder at 651 eV, and small satellite features illustrated more clearly in Figure S8, while the MnIVO2 characteristics are demonstrated by the peak at 658 eV and the satellite feature approximately 12.0 eV on the high binding energy side of the 2p1/2 peak. To confirm that as-prepared MnOx/Au-Si3N4 consists of two different phases, we also compare the Mn 3s spectrum of MnOx/Au-Si3N4 to the spectra of MnOx/GC and four powder controls in Figure 3B. We find that in addition to gold 4f peaks, which overlap with Mn 3s features, the Mn 3s spectrum contains two separate multiplets with Δ3s values similar to those of MnIIO and MnIVO2, providing strong evidence that the catalyst deposits as a mixture of two phases.
Figure 3.
A, B. Comparison of Mn 2p and Mn 3s spectra of MnOx on Au-Si3N4 and glassy carbon supports to the spectra of MnO2, Mn2O3, Mn3O4, and MnO powder standards. C, D. Comparison of Mn 2p and Mn 3s spectra of MnOx on Au-Si3N4 support to the spectra of the same sample after exposure to ORR or OER relevant potentials.
Analysis of the effect of applied potential on the surface oxidation properties of MnOx/Au-Si3N4 shown in Figures Although the MnOx/Au-Si3N4 exhibits similar activity to the MnOx/GC studied previously, physical and chemical characterization illustrate that these materials have different properties. MnOx/GC formed a nanostructured morphology with α-Mn2IIIO3 crystallinity.13 MnOx/Au-Si3N4, on the other hand, consists of densely packed needles, shown in Figure 2B, and has no long range atomic order as demonstrated by the absence of the x-ray diffraction peaks in Figure S7.
Ex-situ XPS
The observed differences in the morphology and crystallinity of MnOx/GC and MnOx/Au-Si3N4 suggest that MnOx/Au-Si3N4 might assume a different surface oxidation state than MnOx/GC despite identical preparation conditions. Previous 3C and 3D demonstrates that XPS can detect changes in the MnOx/Au-Si3N4 surface after it is exposed to reaction conditions. Specifically, application of an ORR relevant potential of 0.7 V results in the elimination of MnIIO features and leads to Δ2p1/2 and Δ3s values that are consistent with the formation of either MnIII oxide or Mn3II,III,IIIO4. Conclusive assignment to either phase is not possible using purely XPS because of the similarity between the Δ2p1/2 and Δ3s of Mn2IIIO3 and Mn3II,III,IIIO4 shown in Figure S9. Application of an OER relevant potential of 1.8 V also results in the elimination of MnIIO features and leads to slight changes in Δ2p1/2 and Δ3s values previously attributed to MnIVO2 phase, indicating that the surface oxidation state under the OER conditions is likely a mixed valent MnIII,IVO2 oxide. These results provide further evidence that the MnOx/Au-Si3N4 surface is unlike the surface of MnOx/GC. While in both cases the oxidation state changes were expected upon exposure to the reaction conditions, these changes could not be detected with the MnOx/GC catalyst using the same characterization procedure.28 To monitor the oxidation state changes in-situ and gain structural information about the catalyst both before and after exposure to reaction conditions, we performed in-situ XAS experiments on a MnOx/AuSi3N4 catalyst.
In-situ XAS under Electrochemical Reaction Conditions
XAS data were collected using a setup illustrated in Figure 1. Prior to collecting in-situ XAS measurements, cyclic voltammetry characterization of the catalyst was performed in air in ORR and OER potential windows of 0.05 V to 1.1 V and 0.05 V to 1.8 V. The resulting cyclic voltammetry behavior shown in Figure 4A is similar to the result obtained under standard laboratory conditions in oxygen saturated electrolyte (Figure 2A). The smaller magnitude of the ORR current obtained at beamline 10.3.2 can be explained by the smaller oxygen concentration in the air saturated electrolyte than the O2 saturated electrolyte. The increase in the ORR current after exposure of the catalyst to OER potentials is attributed to the formation of oxygen bubbles on the surface of the catalyst and the resulting increase in local oxygen concentration. To acquire steady-state in-situ XAS data, the MnOx/Au-Si3N4 catalyst was held at an ORR relevant potential of 0.7 ± 0.007 V or at an OER relevant potential of 1.8 ± 0.001 V in 0.1 M KOH. The resulting chronoamperometry curves are shown in Figures 4B and 4C. The smaller instability in the potential during the OER hold and the corresponding decreased level of noise in measured current density was due to a smaller ohmic resistance during the OER experiment. The occasional drops and recovery observed in the OER chronoamperometry data were likely due to formation and disappearance of oxygen bubbles from the surface. For comparison, XAS measurements were also performed on an as-prepared (dry) catalyst.
Figure 4.

A. Cyclic voltammetry of the catalyst performed prior to in-situ XAS measurements; B. Chronoamperometry at 0.7 V during in-situ XAS measurements at ORR relevant electrochemical conditions in air; C. Chronoamperometry at 1.8 V during in-situ XAS measurements at OER relevant electrochemical conditions in air.
In-situ XANES
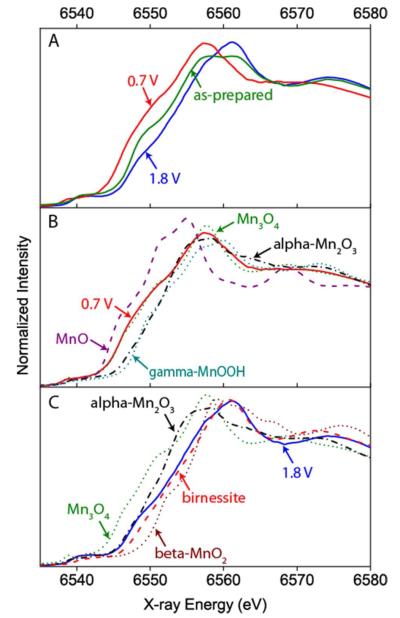
In-situ XANES measurements, shown in Figure 5A, follow the trend observed with ex-situ XPS characterization. When the dry electrode was set in the electrochemical cell and an ORR relevant potential of 0.7 V was applied, a negative shift was observed in the XANES spectrum (Figure 5A), showing a reduction in the Mn oxidation state. On the other hand, a subsequent change to OER conditions led to a shift in the edge position to a higher energy, indicating an increase in the Mn oxidation state. Figure 5B compares the XANES spectrum obtained under the ORR conditions to the spectra of MnIIO, Mn3II,III,IIIO4, MnIIIOOH, and alpha-Mn2IIIO3 standards. The observed Mn valence in the catalyst during the ORR is less than 3, but greater than 2, closely matching the Mn valence of 2.7 observed in Mn3II,III,IIIO4. Analysis of the MnOx/Au-Si3N4 catalyst after exposure to an OER potential of 1.8 V, shown in Figure 5C, reveals that the MnOx catalyst is more oxidized than the alpha-Mn2IIIO3 phase, more reduced than beta-MnIVO2, and exhibits strong similarity to the birnessite phase. Birnessite is a naturally occurring Mn mineral with a layered structure, which accommodates cations and water in the interlayer space. Its synthetic forms, such as triclinic Mg2+ birnessite whose spectrum is shown in Figure 5C, usually have 20-40% MnIII in MnIVO2,29-32 with an average oxidation state of 3.6-3.8. In addition to birnessite, the XANES spectrum of the MnOx/Au-Si3N4 catalyst poised at the OER potential also shows similarities to other MnIII,IV oxide phases that accommodate cations into the structure (Figure S10), such as todorokite and hollandite. We will consider the birnessite phase in our subsequent analysis of the OER catalyst, as several groups have shown that birnessite can be accessed electrochemically at room temperature,33,34 while the formation of todorokite and hollandite requires additional thermal treatment or high pressure.32,35
Figure 5.
A. Comparison of XANES data collected on as prepared MnOx/Au-Si3N4 film and on MnOx/Au-Si3N4 film after in-situ exposure to ORR and OER relevant conditions. B. MnOx /Au-Si3N4 film poised at 0.7 V overlayed with MnO, Mn3O4, alpha-Mn2O3, and gamma-MnOOH. C. MnOx /Au-Si3N4 film poised at 1.8 V overlayed with Mn3O4, alpha-Mn2O3, birnessite, and beta-MnO2.
Examination of the rising edge position of MnOx/Au-Si3N4 catalyst under OER condition reveals that it is slightly lower than the rising edge position of the birnessite phase, indicating that the oxidation state of the OER catalyst is approximately 3.6. The lower oxidation state in the sample than in the birnessite standard can be attributed to the contribution of some electrochemically isolated domains of Mn3II,III,IIIO4 that are not oxidized under OER conditions or to a higher percentage of MnIII sites in the OER catalyst as compared to the standard. The XANES spectra of the OER catalyst was best fit with ~ 80% birnessite and ~ 20% Mn3II,III,IIIO4 spectra, although it is difficult to specify the detailed composition of the minority species (Table S3 in SI). The presence of up to 20% Mn3II,III,IIIO4 at potentials significantly beyond the thermodynamic potential at which Mn3O4 is expected to oxidize36 can be explained either by Mn3II,III,IIIO4 particles electronically isolated from the rest of the sample37 or by Mn3II,III,IIIO4 located in the interior of the film, away from solid-liquid interface.22 More detailed discussion of these two possibilities is presented in the SI.
In-situ EXAFS
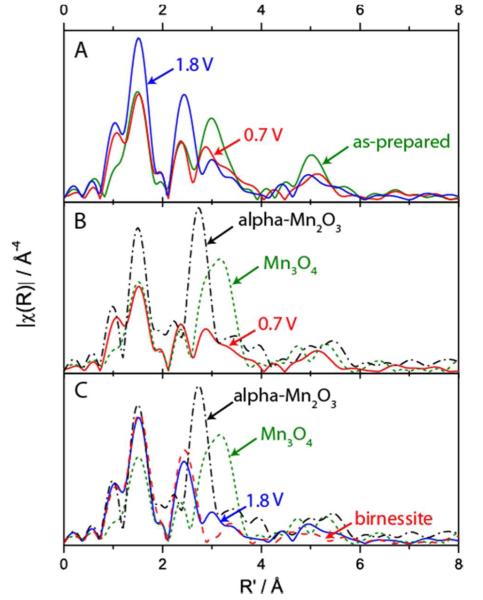
The EXAFS spectra of MnOx/Au-Si3N4 shown in Figure 6A provide further information about the relevant phases. Accompanied by the oxidation state changes observed in the XANES spectra (Figure 5A), substantial changes were observed in the EXAFS spectra among as-prepared, 0.7 V, and 1.8 V MnOx samples. The presence of significant peak intensity in the R’ = 5Å region of the as-prepared MnOx but not in the R’ = 5Å region of 0.7 V and 1.8 V samples, likely originated from the Mn--Mn--Mn multiple scattering, suggesting that the as-prepared MnOx has a more extended structure. The exact atomic arrangement in the as-prepared catalyst could not be identified because its EXAFS spectrum, which did not match any of the considered MnOx standards, likely corresponded to a mixture of MnOx phases. The presence of a mixture of phases is consistent with the results of the XPS analysis, which identified two different oxidation states on the surface of the as-prepared catalyst. EXAFS of MnOx under ORR conditions was compared with reference spectra of Mn3II,III,IIIO4 and alpha-Mn2IIIO3 in Figure 6B. The MnOx/Au-Si3N4 shows much weaker EXAFS peak intensity than the Mn3II,III,IIIO4 in the R’ = 3Å region, despite the similarity in the XANES region. However, the EXAFS curve fitting results show that the ORR spectrum can be fit well with the Mn3II,III,IIIO4 atomic distances with smaller N (coordination) numbers, when the Debye-Waller factors were fixed to those of Mn3II,III,IIIO4 (Table S4 in SI). This can be explained by a smaller particle size as opposed to an extended crystalline material or by a distortion of the phase due to an increased amount of MnII as compared to a pure Mn3II,III,IIIO4 phase. A change to the oxidative potential of 1.8 V leads to a structural rearrangement of the MnOx catalyst and the emergence of similarities in the peak positions between the MnOx OER catalyst and a birnessite phase as shown in Figure 6C. EXAFS curve fitting of the MnOx OER catalyst was carried out using birnessite fit result as starting parameters (Table S4 in SI). This approach generated a good fit, but required smaller N values than those found for the reference birnessite compound. The smaller N values indicate the presence of non-diffracting, small particle domains as opposed to an extended crystalline material and suggest the presence of a minority phase, such as Mn3II,III,IIIO4, in agreement with the XANES analysis. We note that based purely on EXAFS spectra, a todorokite tunnel structure, could have also generated a good fit.7,38 As mentioned in the discussion of XANES, however, we considered the birnessite phase in our analysis because it can form electrochemically,33,34 while the formation of todorokite requires an additional high temperature treatment.32
Figure 6.
A. Comparison of in-situ EXAFS collected on as-prepared MnOx/Au-Si3N4 film and on MnOx/Au-Si3N4 film after in-situ exposure to ORR andOER potentials. B MnOx/Au-Si3N4 film poised at 0.7 V overlayed with Mn3O4 and alpha-Mn2O3. C. MnOx/Au-Si3N4 film poised at 1.8 V overlayed with Mn3O4, alpha-Mn2O3, and birnessite.
In-situ XANES to Assess Film Porosity
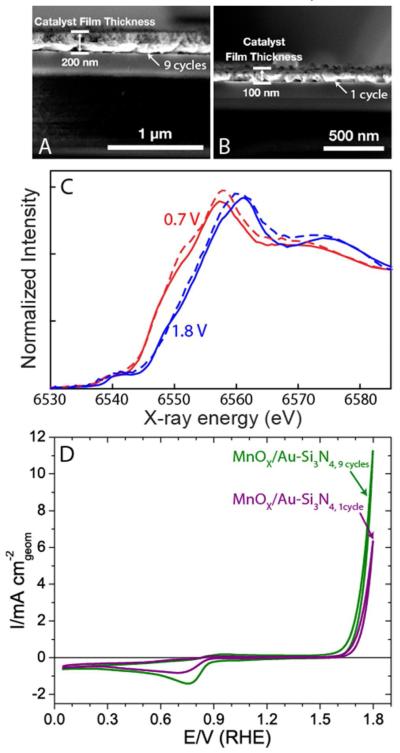
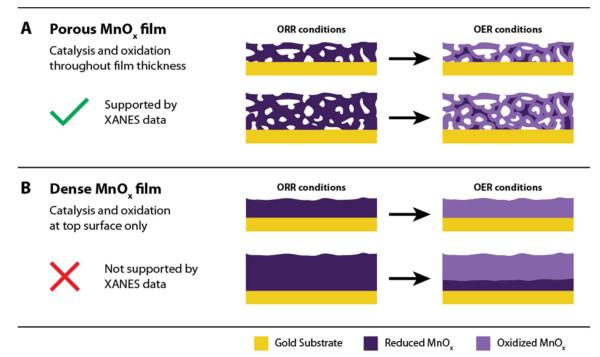
To understand if OER catalysis is limited to the top geometric layer of a dense film, or if it occurs throughout the catalyst layer of a porous film, we prepared a second MnOx/Au-Si3N4 catalyst. The catalyst was synthesized by reducing the number of deposition cycles from nine to one, yielding a sample half as thick as measured using cross-sectional scanning electron microscopy (SEM), Figures 7A and 7B. Despite the factor of 2 difference in film thickness, the samples exhibit similar XANES spectra under both the ORR and the OER conditions (Figure 7C). As the spectra were collected by fluorescence, providing information on the entirety of these relatively thin films, the similarity in the spectra suggests that the catalytic film is porous enough for both samples to have the same fraction of the electrochemically accessible material, as illustrated in Figure 8. Comparison of the OER current at 1.8 V, presented in Figure 7D, reveals about a factor of two higher current for the thicker sample, indicating a direct relationship between the thickness of the catalytic film and the OER activity. This result provides further evidence that the catalyst film is highly porous, allowing the reaction to occur throughout the entire catalyst structure. In this structure, we expect the more oxidized MnIII,IV oxide to be in contact with electrolyte and participate in OER, and the more reduced Mn3II,III,IIIO4 to be located in the interior of the catalyst, away from the solid-liquid interface, with no opportunity to participate in electrocatalysis. It is also possible, however, that Mn3II,III,IIIO4 may remain un-oxidized at the surface of the catalyst, due to poor contact between Mn3II,III,IIIO4 particles and the rest of the film, as discussed in the SI. Because the electronically isolated Mn3II,III,IIIO4 would also be unable to participate in OER electrocatalysis, we can link the oxidized MnIII,IV oxide to the observed OER current.
Figure 7.
A. Scanning electron microscopy (SEM) image of 200 nm MnOx on Au-Si3N4 after 9 cyclic voltammetry (CV) cycles of deposition. B. SEM image of 100 nm MnOx on AuSi3N4, demonstrating a 2 fold reduction in the thickness of MnOx after the number of CV deposition cycles is lowered from 9 to 1. C. Comparison of XANES for 9 (solid lines) and 1 (dashed lines) cycle samples after exposure to ORR (red) and OER (blue) potentials. D. CV characterization of the ORR and the OER activities, illustrating that the OER activity scales with the thickness of MnOx catalyst.
Figure 8.
A. Schematic of oxidation within a porous thin film, illustrating the same ratio of oxidized to reduced MnOx for both thick and thin catalytic layers. B. Schematic of oxidation within a dense thin film, illustrating a higher ratio of oxidized to reduced MnOx for a thinner film. The porous structure is consistent with XANES measurements presented in Figure 6C.
Analysis of K+ Intercalation
Because birnessite MnOx has layered structure that accommodates ions, it was important to consider potassium intercalation into the catalyst during the characterization in potassium hydroxide electrolyte. Previously, potassium intercalation into MnOx has been reported both under ORR39,40 and OER conditions.41,42 A recent study has also demonstrated that potassium may have a favorable effect on OER by stabilizing the layered structure of MnOx43 To monitor possible intercalation we used ex-situ XPS measurements, which provided the ratio of potassium to Mn on the surface of MnOx/Au-Si3N4 catalyst after its exposure to 0.7 V and 1.8 V. Measurements were also performed on the as-prepared catalyst, in which no potassium cations could be present. Our results, shown in Figure S11, indicate that a small amount of -potassium, corresponding to one K+ for every hundred Mn, intercalates into the catalyst after exposure to the OER conditions, while intercalation under ORR conditions is negligible. This amount is less than what is expected for the synthetic birnessites,29,30,32 indicating that the MnOx/Au-Si3N4 catalyst under the OER conditions is composed of Mn sites with and without intercalated K+. Further investigation is necessary to determine the role of K+ in OER catalysis.
Structural Transformations as a Function of Applied Potential
The in-situ XAS characterization of the MnOx/Au-Si3N4 catalyst identified a structural transformation of the catalyst with changes in the applied potential. These results indicate that different phases form under the ORR and OER conditions. ORR potentials favor the formation of a disordered Mn3II,III,IIIO4 phase with spinel-like structure shown in Figure 9A, while the OER potentials favor the formation of an oxidized MnOx phase, bearing similarities to birnessite structure shown in Figure 9B, along with a less oxidized phase, likely corresponding to unchanged Mn3II,III,IIIO4.
Figure 9.
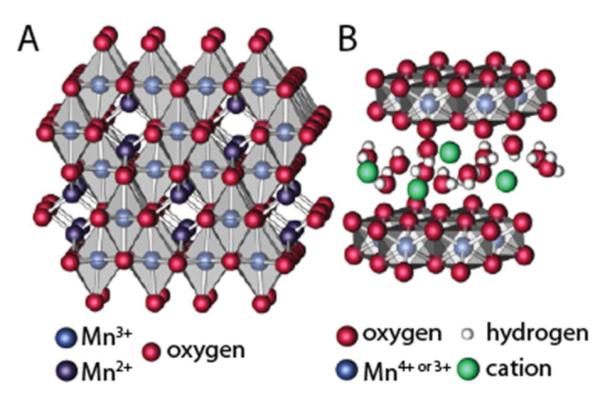
Schematic showing the crystal structures of A. Mn3O4, which consists of octahedral (light blue) and tetragonal (dark blue) Mn sites, and B. Mn+-birnessite, which consists of sheets of edge-sharing MnO6 octahedra with cations and water intercatalated into the interlayer space.
The presence of a highly disordered Mn3II,III,IIIO4 phase at 0.7 V links Mn3II,III,IIIO4 to the high activity for the ORR. Formation of the Mn3II,III,IIIO4 phase at 0.7 V is expected based on thermodynamics,36,44 but experiments show that this phase is not very kinetically accessible. Specifically, in base, the reduction of MnIVO2 to Mn3II,III,IIIO4 has been previously demonstrated only in highly concentrated KOH electrolytes45,46 and has been characterized by poor electrochemical reversibility and conductivity.45,47,48 Mechanistic studies in low concentration KOH electrolytes by Kozawa and Yeager, more applicable to the present investigation, have identified Mn(III) oxide as the final reduction product of MnIVO2.46In-situ XAS characterization by Lima et al. of another ORR catalyst consisting of MnOx dispersed in Vulcan carbon detected the presence of some Mn3II,III,IIIO4 at a similar cathodic potential during the cathodic sweep, but in a mixture with a more oxidized Mn(III) phase, likely corresponding to MnIIIOOH.4 The scarcity of reports of complete reduction of MnOx to Mn3II,III,IIIO4 under potentials relevant for ORR at pH 13 warrants further investigation of the reductive behavior of MnOx/Au-Si3N4 and identification of the precise voltage at which the phase transition to Mn3II,III,IIIO4 begins.
Electrochemical oxidation of the Mn3II,III,IIIO4 phase to a phase similar to birnessite is not expected based on the early studies of MnOx as battery electrodes, which have suggested that Mn3II,III,IIIO4 is electrochemically inactive and cannot be oxidized.4,45,47-49 Recent studies of MnOx supercapacitors, however, have not only identified Mn3II,III,IIIO4 as a phase with excellent electrochemical conductivity and redox properties,50-53 but have also shown that it can transform into a layered structure of birnessite after 100-1000 of electrochemical cycles.33,34,54 The ability of our catalyst to transform from Mn3II,III,IIIO4 phase formed at 0.7 V to greater than 80% of birnessite-like phase after a single cycle to an OER relevant potential of 1.8 V, is likely explained by the small domain size of the crystallites in the catalyst and the disordered structure of the starting Mn3II,III,IIIO4 phase. Our study provides the first evidence of the formation of MnOx with a birnessite-like structure during the OER in alkaline environment. Considering that previous studies have also linked a mixed MnIII,IV oxide phase with similarities to birnessite to high OER activity in acidic nafion membrane7 and neutral electrolytes,16,55,56 our results suggest that the OER activity of the mixed MnIII,IV oxide may be independent of the pH environment. Further studies are necessary to determine the exact active site and the reaction mechanism.
CONCLUSIONS
Identifying the active sites in catalysis, one of the most challenging endeavors to undertake in the field, is critical to understanding and improving catalytic materials. In-situ X-ray absorption spectroscopy (XAS) studies were employed to investigate the active phases of a manganese oxide (MnOx) catalyst supported onto Au-Si3N4 (MnOx/Au-Si3N4) during electrochemical reaction conditions for the oxygen reduction reaction (ORR) and the oxygen evolution reaction (OER). The investigations identified a disordered Mn3II,III,IIIO4 as a phase under ORR conditions, and a mixture of two MnOx phases under OER conditions: an oxidized phase with a structure similar to that of birnessite and a more reduced phase, likely corresponding to unchanged Mn3II,III,IIIO4. By studying catalyst films of different thicknesses, it was shown that OER catalysis must occur throughout the catalyst structure and not just at the top most geometric layer of the film, indicating excellent porosity of the films. Although we identify a mixture of a more oxidized phase and Mn3II,III,IIIO4 under OER conditions, due to the oxidizing potentials necessary for the OER we expect the more reduced Mn3II,III,IIIO4 to be located away from the solid-liquid interface with no opportunity to turn over the reaction and the more oxidized phase to be in contact with the electrolyte and be important to the observed OER catalysis. As the electrochemical properties of MnOx are highly dependent on the starting MnOx phase45,57 and underlying support, it is important to continue in-situ investigations of different MnOx materials under ORR and OER conditions to advance understanding of structural parameters and surface conditions that contribute to the high activity observed for the two reactions.
Supplementary Material
ACKNOWLEDGMENT
Catalyst development and electrochemical characterization were supported as part of the Center on Nanostructuring for Efficient Energy Conversion (CNEEC) at Stanford University, an Energy Frontier Research Center funded by the U.S. Department of Energy, Office of Science, Office of Basic Energy Sciences under Award Number DE SC0001060. SEM, XPS, and XRD were performed at the Stanford Nanocharacterization Laboratory (SNL) part of the Stanford Nano Shared Facilities. In situ XAS experiments were supported by the Joint Center for Artificial Photosynthesis, a DOE Energy Innovation Hub, supported through the Office of Science of the U.S. Department of Energy under Award Number DE-SC0004993, and performed at the Advanced Light Source (BL 10.3.2), Berkeley, under Contract DE-AC02-05CH11231. Portions of this research were carried out at the Stanford Synchrotron Radiation Lightsource, a Directorate of SLAC National Accelerator Laboratory and an Office of Science User Facility operated for the U.S. Department of Energy Office of Science by Stanford University. The SSRL Structural Molecular Biology Program is supported by the DOE Office of Biological and Environmental Research, and by the National Institutes of Health, National Institute of General Medical Sciences (including P41GM103393) and the National Center for Research Resources (P41RR001209). The authors thank Dr. Sung-Hyeon Baeck for providing beta-MnO2 and alpha-Mn2O3 powders and Dr. Jakob Kibsgaard for assistance with Figure 9.
Footnotes
Supporting Information. X-ray photoelectron spectroscopy analysis, x-ray absorption spectroscopy fitting details, Figures S1-S8. This material is available free of charge via the Internet at http://pubs.acs.org.
REFERENCES
- (1).Peuckert M, Yoneda T, Betta RAD, Boudart M. J. Electrochem. Soc. 1986;133:944. [Google Scholar]
- (2).Mukerjee S, Srinivasan S, Soriaga MP, McBreen J. J. Electrochem. Soc. 1995;142:1409. [Google Scholar]
- (3).Lima FHB, Calegaro ML, Ticianelli EA. J. Electroanal. Chem. 2006;590:152. [Google Scholar]
- (4).Lima FHB, Calegaro ML, Ticianelli EA. Electrochim. Acta. 2007;52:3732. [Google Scholar]
- (5).Kanan MW, Yano J, Surendranath Y, Dinca M, Yachandra VK, Nocera DG. J. Am. Chem. Soc. 2010;132:13692. doi: 10.1021/ja1023767. [DOI] [PubMed] [Google Scholar]
- (6).Bediako DK, Lassalle-Kaiser B, Surendranath Y, Yano J, Yachandra VK, Nocera DG. J. Am. Chem. Soc. 2012;134:6801. doi: 10.1021/ja301018q. [DOI] [PubMed] [Google Scholar]
- (7).Hocking RK, Brimblecombe R, Chang LY, Singh A, Cheah MH, Glover C, Casey WH, Spiccia L. Nature Chem. 2011;3:461. doi: 10.1038/nchem.1049. [DOI] [PubMed] [Google Scholar]
- (8).Haas O, Holzer F, Müller S, McBreen JM, Yang XQ, Sun X, Balasubramanian M. Electrochim. Acta. 2002;47:3211. [Google Scholar]
- (9).Yeager E. J. Mol. Catal. 1986;38:5. [Google Scholar]
- (10).Mao LQ, Sotomura T, Nakatsu K, Koshiba N, Zhang D, Ohsaka T. J. Electrochem. Soc. 2002;149:A504. [Google Scholar]
- (11).Cao YL, Yang HX, Ai XP, Xiao LF. J. Electroanal. Chem. 2003;557:127. [Google Scholar]
- (12).Cheng FY, Su Y, Liang J, Tao ZL, Chen J. Chem. Mat. 2010;22:898. [Google Scholar]
- (13).Gorlin Y, Jaramillo TF. J. Am. Chem. Soc. 2010;132:13612. doi: 10.1021/ja104587v. [DOI] [PubMed] [Google Scholar]
- (14).Morita M, Iwakura C, Tamura H. Electrochim. Acta. 1979;24:357. [Google Scholar]
- (15).El-Deab MS, Awad MI, Mohammad AM, Ohsaka T. Electrochem. Commun. 2007;9:2082. [Google Scholar]
- (16).Zaharieva I, Najafpour MM, Wiechen M, Haumann M, Kurz P, Dau H. Energy Environ. Sci. 2011;4:2400. [Google Scholar]
- (17).Tench D, Warren LF. J. Electrochem. Soc. 1983;130:869. [Google Scholar]
- (18).Gilbert B, Frazer BH, Belz A, Conrad PG, Nealson KH, Haskel D, Lang JC, Srajer G, De Stasio G. J. Phys. Chem. A. 2003;107:2839. [Google Scholar]
- (19).Barr TL, Seal S. J. Vac. Sci. Technol., A. 1995;13:1239. [Google Scholar]
- (20).Dicastro V, Polzonetti G. J. Electron. Spectrosc. Relat. Phenom. 1989;48:117. [Google Scholar]
- (21).Oku M, Hirokawa K, Ikeda S. J. Electron. Spectrosc. Relat. Phenom. 1975;7:465. [Google Scholar]
- (22).Djurfors B, Broughton JN, Brett MJ, Ivey DG. J. Electrochem. Soc. 2006;153:A64. [Google Scholar]
- (23).Marcus MA, MacDowell AA, Celestre R, Manceau A, Miller T, Padmore HA, Sublett RE. J. Synchrotron Radiat. 2004;11:239. doi: 10.1107/S0909049504005837. [DOI] [PubMed] [Google Scholar]
- (24).Newville M. J. Synchrotron Radiat. 2001;8:96. doi: 10.1107/s0909049500016290. [DOI] [PubMed] [Google Scholar]
- (25).Rehr JJ, Albers RC. Rev. Mod. Phys. 2000;72:621. [Google Scholar]
- (26).Webb SM, Tebo BM, Bargar JR. Am. Mineral. 90:1342. [Google Scholar]
- (27).Burke LD, Osullivan JF. Electrochim. Acta. 1992;37:585. [Google Scholar]
- (28).Gorlin Y, Jaramillo TF. J. Electrochem. Soc. 2012;159:H782. [Google Scholar]
- (29).Post JE, Heaney PJ, Hanson J. Powder Diffr. 2002;17:218. [Google Scholar]
- (30).Post JE, Veblen DR. Am. Mineral. 1990;75:477. [Google Scholar]
- (31).Ching S, Petrovay DJ, Jorgensen ML, Suib SL. Inorg. Chem. 1997;36:883. [Google Scholar]
- (32).Golden DC, Chen CC, Dixon JB. Clays Clay Miner. 1987;35:271. [Google Scholar]
- (33).Dubal DP, Jagadale AD, Lokhande CD. Electrochim. Acta. 2012;80:160. [Google Scholar]
- (34).Dai Y, Wang K, Xie J. Appl. Phys. Lett. 2007;90:104102. [Google Scholar]
- (35).Shen YF, Zerger RP, DeGuzman RN, Suib SL, McCurdy L, Potter DI, O’Young CL. Science. 1993;260:511. doi: 10.1126/science.260.5107.511. [DOI] [PubMed] [Google Scholar]
- (36).Pourbaix M. Atlas of Electrochemical Equilibria in Aqueous Solutions. Pergamon Press; 1966. [Google Scholar]
- (37).Lowe MA, Gao J, Abruna HD. Journal of Materials Chemistry A. 2013;1:2094. [Google Scholar]
- (38).Manceau A, Gorshkov AI, Drits VA. Am. Mineral. 1992;77:1144. [Google Scholar]
- (39).Minakshi M. J. Electroanal. Chem. 2008;616:99. [Google Scholar]
- (40).Athouel L, Moser F, Dugas R, Crosnier O, Belanger D, Brousse T. J. Phys. Chem. C. 2008;112:7270. [Google Scholar]
- (41).Chigane M, Ishikawa M. J. Electrochem. Soc. 2000;147:2246. [Google Scholar]
- (42).Chigane M, Ishikawa M. J. Chem. Soc., Faraday Trans. 1998;94:3665. [Google Scholar]
- (43).Boppana VBR, Yusuf S, Hutchings GS, Jiao F. Adv. Funct. Mater. 2013;23:878. [Google Scholar]
- (44).Su H-Y, Gorlin Y, Man IC, Calle-Vallejo F, Norskov JK, Jaramillo TF, Rossmeisl J. Phys. Chem. Chem. Phys. 2012;14:14010. doi: 10.1039/c2cp40841d. [DOI] [PubMed] [Google Scholar]
- (45).McBreen J. Electrochim. Acta. 1975;20:221. [Google Scholar]
- (46).Kozawa A, Yeager JF. J. Electrochem. Soc. 1965;112:959. [Google Scholar]
- (47).Boden D, Venuto CJ, Wisler D, Wylie RB. J. Electrochem. Soc. 1967;114:415. [Google Scholar]
- (48).Boden D, Venuto CJ, Wisler D, Wylie RB. J. Electrochem. Soc. 1968;115:333. [Google Scholar]
- (49).Nam KW, Kim MG, Kim KB. J. Phys. Chem. C. 2007;111:749. [Google Scholar]
- (50).Jiang J, Kucernak A. Electrochim. Acta. 2002;47:2381. [Google Scholar]
- (51).Djurfors B, Broughton JN, Brett MJ, Ivey DG. J. Mater. Sci. 2003;38:4817. [Google Scholar]
- (52).Zhang F, Zhang X-G, Hao L. Mater. Chem. Phys. 2011;126:853. [Google Scholar]
- (53).Lin Y-H, Wei T-Y, Chien H-C, Lu S-Y. Adv. Eng. Mater. 2011;1:901. [Google Scholar]
- (54).Dubal DP, Dhawale DS, Salunkhe RR, Lokhande CD. J. Electroanal. Chem. 2010;647:60. [Google Scholar]
- (55).Zaharieva I, Chernev P, Risch M, Klingan K, Kohlhoff M, Fischer A, Dau H. Energy Environ. Sci. 2012;5:7081. [Google Scholar]
- (56).Iyer A, Del-Pilar J, King’ondu CK, Kissel E, Garces HF, Huang H, El-Sawy AM, Dutta PK, Suib SL. J. Phys. Chem. C. 2012;116:6474. [Google Scholar]
- (57).Desai BD, Fernandes JB, Dalal VNK. J. Power Sources. 1985;16:1. [Google Scholar]
Associated Data
This section collects any data citations, data availability statements, or supplementary materials included in this article.


