
. 2013 Dec 23;2:687. doi: 10.1186/2193-1801-2-687
© Abdallah et al.; licensee Springer. 2013
This article is published under license to BioMed Central Ltd. This is an Open Access article distributed under the terms of the Creative Commons Attribution License (http://creativecommons.org/licenses/by/2.0), which permits unrestricted use, distribution, and reproduction in any medium, provided the original work is properly cited.
Figure 2.
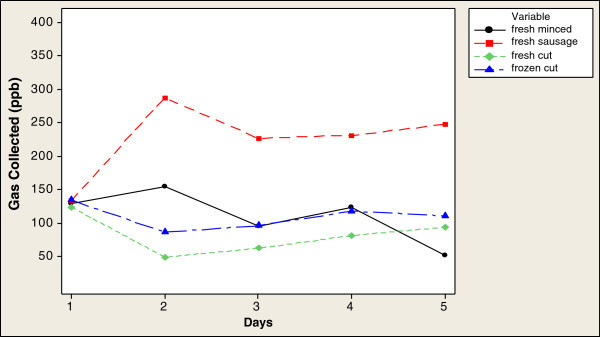
Time series plot of gas concentrations detected by e-nose over 4 h.