

Summary
In our primate model of maternal high fat diet exposure, we have described fetal epigenomic modifications to the peripheral circadian Npas2 are associated with persistent alterations in fetal hepatic metabolism and non-alcoholic fatty liver. As the interaction of circadian response with metabolism is not well understood, we employed a murine knockout model to characterize the molecular mechanisms with which Npas2 reprograms the fetal hepatic metabolic response. cDNA was generated from Npas2 -/- and +/+ (wild type) livers at day 2 (newborn) and at 25 weeks (adult) of life. Newborn samples were analyzed by exon array (n=3/cohort). Independent pathway analysis software determined that the primary dysregulated pathway(s) in the Npas2 -/- animals uniformly converged on lipid metabolism. Of particular interest, Ppargc1a, which integrates circadian and metabolism pathways, was significantly (p<.01) over expressed in newborn (1.7 fold) and adult (1.8 fold) Npas2-/- animals. These findings are consistent with an essential role for Npas2 in programming the peripheral circadian response and hepatic metabolism, which has not been previously described.
INTRODUCTION
The circadian pathway regulates the 24-hour cyclical gene expression in mammals and rhythmic gene expression in other organisms. Disruptions of the circadian pathway are implicated in common complex traits such as obesity, cardiovascular disease, diabetes, metabolic and sleep disorders, and infertility (Miller et al., 2004; Oishi et al., 2006; Turek et al., 2005; Wijnen and Young, 2006). It is estimated that 10% of all genes are regulated by the circadian pathway, with one study reporting as many as 43% of hepatic genes demonstrating circadian cyclic (oscillatory phase and anti-phase) expression patterning (Ptitsyn et al., 2006). Circadian rhythms are found both in central brain and peripheral (liver, heart, adipose) tissues, being entrained primarily by the circadian pacemaker located in the suprachiasmatic nuclei (SCN) of the hypothalamus (Akhtar et al., 2002). Entrainment of these peripheral circadian rhythms is determined by sensory input such as light, sleep, food availability, and nutrition. Although the circadian pathway is active in diverse tissues, very few similarities in gene expression are evident between tissues (Panda et al., 2002; Storch et al., 2002). For example, Panda et al. reported that among genes demonstrating circadian expression patterns in the SCN (337 genes) and liver (335 genes), only 28 genes were concomitantly regulated (Panda et al., 2002). This is consistent with a complex phase-antiphase networked pattern of gene expression. However, what generates or modifies both the set point and programming of this complex network has yet to be fully described.
A recent clinical study has demonstrated an association of genomic variants of the neuronal PAS 2 domain gene 2 (Npas2) with the occurrence of metabolic syndrome (Englund et al., 2009). Npas2 was originally characterized in the forebrain, but has since been shown to be expressed in key metabolic peripheral tissues such as the liver (Ptitsyn et al., 2006; Reick et al., 2001; Zhou et al., 1997). NPAS2 operates as a transcription factor by forming an obligate heterodimer with BMAL1. NPAS2:BMAL1 are activators of several of the core components of the circadian pathway including Cry, Per, Rev-erbα, and Rorα (Crumbley et al., 2010; Kondratov et al., 2006; Preitner et al., 2002). CRY and PER proteins co-localize in the cytoplasm to form heterodimers which inhibit the activity of the NPAS2:BMAL1 forming a negative feedback loop. REV-ERBα, RORα, and RORγ assist in regulating the circadian pathway by modulating Npas2 transcription. REV-ERBα inhibits the transcription of Npas2 while RORα and RORγ activate transcription (Crumbley et al., 2010; Takeda et al., 2011). NPAS2:BMAL1 DNA binding efficiency is attenuated by the binding of NAD and NADP cofactors, in which NPAS2:BMAL1 act as redox state sensors (Rutter et al., 2001). Binding efficiency of NPAS2 to BMAL1 is similarly affected by the status of NPAS2 bound to heme groups (Dioum et al., 2002). This establishes NPAS2 as an integral part of the circadian pathway through regulation of the negative feedback loop as well as demonstrating the role of NPAS2:BMAL1 as sensors of changing physiological conditions. CLOCK, a paralog of NPAS2, is also an obligate heterodimer with BMAL1. While NPAS2 and CLOCK have distinctive roles in entraining peripheral circadian rhythms, additional studies suggest overlap of NPAS2 and CLOCK in both the adult liver and the SCN (Bertolucci et al., 2008; DeBruyne et al., 2007). However, it remains to be determined whether Npas2 plays a uniquely deterministic role in establishing (or programming) fetal and later in life circadian and metabolic function.
Our recent work discovery-based work in a nonhuman primate model of maternal high-fat diet exposure led us to initially identify Npas2 as a epigenomically modified regulator of fetal hepatic metabolism (Aagaard-Tillery et al., 2008; Suter et al., 2011). Fetuses exposed to a high-fat diet (HFD) in utero demonstrated a significant increase in acetylation of histone H3 at lysine 14 (H3K14ac) (Aagaard-Tillery et al., 2008). Using differential display ChIP approaches to determine where this modification was enriched throughout the fetal hepatic genome, we found differential occupancy of the Npas2 promoter region by H3K14ac H3 between control and HFD exposed offspring (Aagaard-Tillery et al., 2008). Further analysis using chromatin immunoprecipitation followed by site-specific transcriptional assays revealed an increase of H3K14ac occupancy in the Npas2 promoter in animals exposed to a HFD in utero (Suter et al., 2011). This alteration in promoter occupancy associated with differential Npas2 transcription between the control and HFD exposed groups (Suter et al., 2011). While these studies suggested that the circadian rhythm is entrained in utero by the maternal diet, likely through epigenetically reprogramming of Npas2 (Seron-Ferre et al., 2007), it failed to fully define the mechanistic underpinnings. Specifically, our non-human primate studies could not allow for either a clear delineation of the role of Npas2 in regulating fetal gene expression at a transcriptome wide level, nor provide the mechanistic underpinnings as to how Npas2 may be playing a pivotal role in fetal programming. Such studies would require genetic models, such as murine gene-specific knock outs.
Based on our observations in the NHP fetal liver, we hypothesized that Npas2 regulates gene transcription of key metabolic pathways in the liver. Although characterizations of Npas2 expression in the SCN and forebrain have been extensive, very little information is available on the role of Npas2 in peripheral tissues, as well as its role in circadian regulation of gene expression during development. The aim of this study was to employ a previously phenotypically characterized Npas2 knock out (-/-) mouse model to examine the role of Npas2 in peripheral hepatic tissue (Garcia et al., 2000). Specifically, we robustly examine the role of Npas2 in altering the neonatal (day 2) and adult (week 25) transcriptome utilizing Npas2 -/-, +/-, and +/+ littermates. In the early neonatal interval, mice are not yet receiving phototropic cues from the environment, thus the sleep and feeding schedule of the mouse has not yet been entrained by the light/dark cycle. This model provides an opportunity to study the peripheral circadian pathway before light entrainment is established and thus gives insight into the role of Npas2 in establishing both early and later in life hepatic transcriptome profiles.
RESULTS
Npas2 KO Liver Gene Expression Analysis
Extensive studies have shown Npas2 -/- mice to exhibit impaired memory as well as modified behavior when deprived of food (Dudley et al., 2003; Garcia et al., 2000). Specifically, when Npas2 -/- mice are restricted to food access during only four hours of the 12 hour light cycle, they ultimately succumb to wasting (consistent with a mortal misadaptation of light/dark sensory input with satiety). However, Npas2 -/- mice demonstrate perception of changes in the light: dark cycle, indicating Npas2 is not solely regulated by light sensory stimuli (Dudley et al., 2003). In our experiments, hepatic RNA/cDNA from Npas2 knock out mice (-/-, n=3), Npas2 heterozygotes (+/-, n=3) and wild type littermates (+/+, n=3)) was run on Affymetrix Mouse Exon 1.0 Arrays. A supervised hierarchical cluster analysis (squared Euclidean with centroid linkage) indicated that the Npas2 +/- gene expression is closely related to the +/+ (Figure 1). Cluster analysis resulted in two major groupings with +/+ and +/- samples on one branch and Npas2 -/- on the other, indicating that livers from Npas2 -/- mice have a significant different gene expression profile as compared to +/+ and +/- mice.
Figure 1. Significant Differences by Genotype in Gene Expression Profile Identified Through Clustering in Fetal Liver.
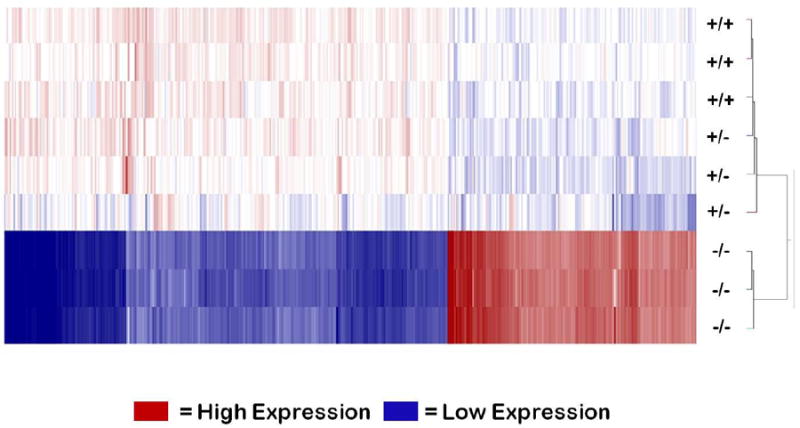
Supervised hierarchical cluster analysis of cDNA samples of wild type (+/+), heterozygous (+/-), and knock out (-/-) mice (n=3 per group), converted from whole liver RNA extraction, was run on an Affymetrix Mouse Exon 1.0 Array. Cluster map was generated using input gene list filtered by fold change of 2.0 and adjusted p-value of <0.05. All -/- mice found in a single cluster, while +/+ and +/- are contained in the other major branch of the cluster demonstrating a defined phenotypic difference between -/- compared to both +/+ and +/- in overall gene expression in the liver. (See also Table S1).
Statistical analysis identified 3229 genes dysregulated in Npas2 -/- mice compared to +/+ mice (p<.05, fold-change >1.5 or <-1.5; Table S1). The gene list generated identified 1486 (46%) up-regulated genes and 1743 (54%) down-regulated genes in the Npas2 -/- mouse as compared to +/+. Normalized filtered expression data was subjected to pathway analysis using both Ingenuity IPA (IPA) and Gene Set Enrichment Analysis (GSEA) software to identify differentially regulated canonical pathways of Npas2 -/- in liver tissue. IPA and GSEA both use curated databases incorporating information from the literature of primary research; however they vary on the approach to filter the data. We selected two pathway prediction algorithms to ensure more confidence in the analysis generated. Converged data sets demonstrated that the primary dysregulated pathway in the Npas2 -/- animals was the lipid and fatty acid metabolism pathway, with significant alterations in the molecular transport and oxidoreductase/ small molecule biochemistry pathways (Table 1).
Table 1.
Top Molecular Pathways Altered in Liver by Loss of Npas2.
| Pathways | Genes |
|---|---|
| Lipid/Fatty Acid Metabolism*ˆ | Angptl3, Apoa4, Apoc1, Crot, Fads1, Fads2, Ldlr, Lpl, Ppargc1a, Sphk1 |
| Molecular Transport*ˆ | Abcb11, Abcc3, Abcc6, Abcd3, Aqp9, Kcnn4, Slc10a1, Slc25a10 |
| Oxidoreductase/ Small Molecule Biochemistry*ˆ | Acadm, Acadvl, Acox2, Aldh1a1, Decr1, Hadh, Hadha, Hadhb, Hsd17b4, Por |
| Cell Growth and Proliferation* | Ccnd1, Cxcl12, Cxcr2, Il1b, Met, Mt2a, Myc, Nr1l3, Slc7a5, Tnfrsf12a |
| Cell Death* | C4bp, Cyp7a1, Gadd45b, Gstz1, Igf1, Krt8, Met, Myc, Nr1l3, Scd |
Genes from the exon array (p<.05 and fold-change ±1.5) were analyzed by
IPA (Ingenuity Pathway Analysis (https://analysis.ingenuity.com/pa/)) and
GSEA (Gene Set Enrichment Analysis (http://www.broadinstitute.org/gsea/index.jsp)) pathway prediction software. Top modified pathways identified by the prediction softwares and selected associated genes are displayed in the table above.
The fatty acid metabolism pathway consists of genes involved in the regulation of fatty acid synthesis, desaturation, beta oxidation, transport, and glyceride (mono-, di-, and tri-) synthesis in the liver. The molecular transport pathway refers to genes whose roles are to regulate the location of molecules within the cell as well as transport and uptake of various molecules into and out of the cell and organelles. Oxidoreductase/ small molecule biochemistry pathway entails genes responsible for biochemical reactions such as esterification, oxidation, and desaturation. We were interested to understand if any molecular interactions of these three pathways occurred. We show through IPA Pathway Designer that multiple mediators and molecular targets specifically arising from these pathways demonstrate direct and indirect molecular interactions (Figure S1). These molecular interactions reiterated our canonical pathways findings, and underscore a role for Npas2 primarily in regulation of lipid metabolism in early (neonatal) development.
Altered gene expression in adult (week 25) animals
We hypothesized that the altered gene expression in the Npas2 -/- liver present at birth would persist throughout life. To test this hypothesis, fetal liver samples were collected from day 2 mice (newborn, -/-, n=3; +/+, n=3) and from 25 week mice (adult, -/-, n=3; control, n=4). As shown in Figure 2, mRNA expression of Lpin1 (9.8 fold, p <0.001), Scd1 (18.2 fold, p = 0.001), Sds (18.3 fold, p = 0.001), Upp2 (38.5 fold, p <0.0001) demonstrated significant elevated fetal expression with significant decreased expression in adult life (week 25, Figure 2A-D). Conversely, Ppargc1a is significantly elevated in neonatal life with persistent reprogramming into adult life (1.7 fold (day 2) to 1.8 fold (week 25), p<.01, Figure 3E). Fgf1 (0.11 fold, p <0.001), Gpd1 (0.06 fold, p <0.001), Grb14 (0.12 fold, p <0.001), Gulo (0.19 fold, p = 0.001), and Hmgcs1 (0.11 fold, p = 0.001) demonstrate significant neonatal alterations that do not persist into adult life and increased compared to +/+ levels (Figure 2F-J).
Figure 2. Metabolic Gene Expression Alterations from Newborn and Adult Mice.
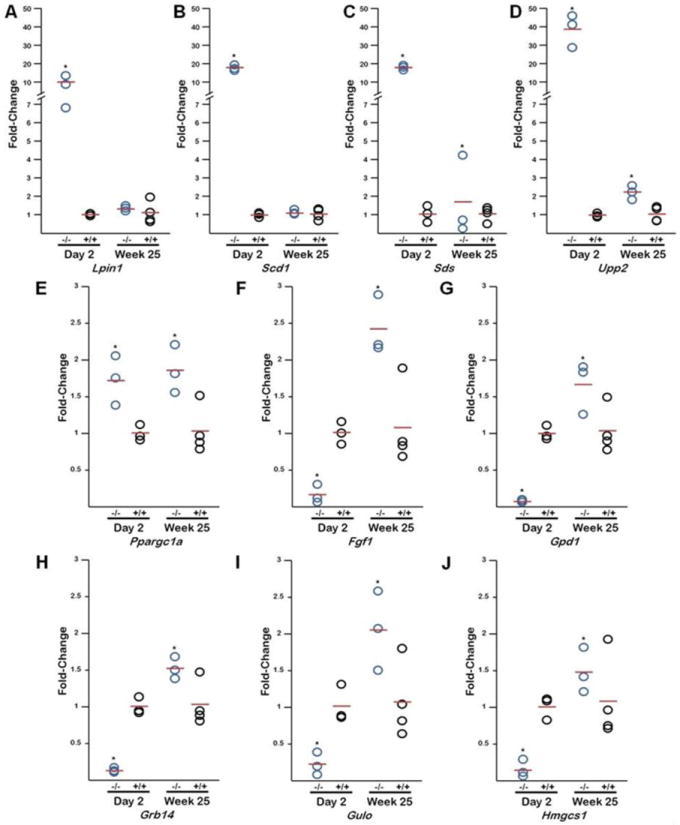
qPCR analysis of ten genes from wild type (+/+) and Npas2 knock out (-/-) mouse livers at day 2 post natal and 25 weeks post natal. Lpin1, Scd1, Sds, and Upp2 (A-D) are up-regulated in -/- at day 2, compared to week 25 which demonstates a significant decrease in gene expression. Ppargc1 (E) shows no significant change between gene expression in -/- mice at day 2 and week 25, samples at both time points are up-regulated compared to +/+. Fgf1, Gpd1, Grb14, Gulo, and Hmgcs1 (F-J) are down-regulated at day 2, compare to week 25 mice, with a significant increase in expression.
Figure 3. Circadian Gene Expression Alterations from Newborn and Adult Mice.
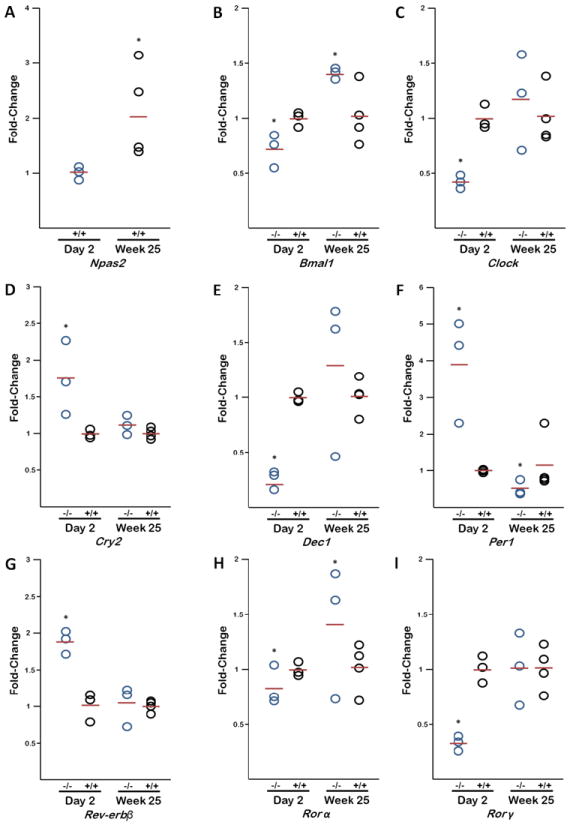
qPCR analysis of nine circadian genes from wild type (+/+) and Npas2 knock out (-/-) mouse livers at day 2 post natal and 25 weeks post natal. Npas2 (A) gene expression (from +/+ mice) is increased in adult liver compared to newborn livers. Gene expression for newborn and adult liver tissue samples are shown for Bmal1 (B), Clock (C), Cry2 (D), Dec1 (E), Per1 (F), Rev-erbβ (G), Rorα (H), and Rorγ (I).
Array findings were validated through qPCR analysis of seven genes (Inhbe, Inmt, Lpin, Scd, Sds, and Upp2) (Table 2), selected because they represent the highest measure of up or down gene expression generated by the exon array. Although variation in expression levels between exon microarray and qPCR is well known, the values and the direction of the fold changes validate the results of our exon arrays in these experiments (Table 2).
Table 2.
Exon array data is validated through qrtPCR.
| Gene | Exon Array (Fold-change) | rtPCR (Fold-change) |
|---|---|---|
| Adra2 | +7.4 | +28.1±.2 |
| Inhbe | -14.8 | -47.9±.2 |
| Inmt | -15.2 | -46.2±.2 |
| Lpin1 | +11.7 | +9.8±.3 |
| Scd | +9.4 | +18.2±.1 |
| Sds | +11.3 | +18.3±.1 |
| Upp2 | +26.2 | +38.5±.2 |
Gene expression is represented as fold change of Npas2 -/- compared to +/+ controls and measured by both Exon Array and rt PCR. Values are significant with p< .05 and rtPCR values are represented as fold change ± SEM.
Altered gene expression of circadian genes
We identified that metabolic gene expression changes from newborn to adult in Npas2 -/- mice, therefore we wanted to understand if similar changes occured in the circadian pathway (Figure 3B-I). At day 2, Bmal1, which forms heterodimers with either NPAS2 or CLOCK, and Clock, a paralog of Npas2, were under expressed (0.73 fold and 0.43 fold respectively, p<.01). Cry2 and Per1, function as part of the negative arm of the feedback loop which regulates the cyclical expression of the circadian pathway, were over expressed by 1.75 fold (p<.01) and 3.9 fold (p<.01) respectively. Additional genes of the circadian pathway were significantly altered in their gene expression: Dec (0.25 fold, p<.01), Rev-erbβ (1.9 fold, p<.01), Rorα (0.83 fold, p<.05) and Rorγ (0.33 fold, p<.01).
At week 25, Bmal1 is overexpressed (1.41 fold, p<.01) while Clock gene expression aproximates +/+ levels (1.17 fold, p>.05). Cry2 gene expression is also not significantly different from +/+ (1.12 fold, p>.05) however Per1 gene expression is underexpressed (.52 fold, p<.01). Dec1 (1.29 fold), Rev-erbβ (1.05 fold), Rorα (1.41 fold), and Rorγ (1.01 fold) gene expression in week 25 Npas2 -/- mice show no significant change from controls (p>.05). Additionally, Npas2 gene expression changes over time (2.12 fold increase in adults compared to newborn, p<.05) in the +/+ mouse liver (Figure 3A). Clock gene expression also increases over time (2.66 fold, p<.05, Figure S2B) while Bmal1 expression does not significantly change between neonatal and adult +/+ liver samples (p=.27, Figure S2A).
Candidate genes for direct regulation by NPAS2
We have identified genes whose transcriptional regulation is associated with Npas2. However, our current strategy does not have the power to identify which genes are regulated by NPAS2 binding to their associated promoter regions. Since transcription regulation through NPAS2 hinges upon NPAS2 forming an obligate heterodimer with BMAL1, we hypothesized that by utilizing a BMAL1 ChIP-Seq data set we could identify an initial set of candidate genes directly regulated by Npas2. To identify candidate genes directly regulated by NPAS2 (3229 genes), we compared the genes with altered expression in liver tissue driven by the deletion of Npas2 with genes bound by BMAL1 in the proximal promoter region in mouse liver (1997 genes) (Rey et al., 2011). We identify 352 intersecting genes (10.9% of Npas2 -/- altered genes, 17.6% of BMAL1 associated genes, Table S2) that are candidates for direct regulation by the NPAS2/BMAL1 complex (Figure 4A). DAVID analysis of the intersecting genes showed enrichment for seven Gene Ontology (GO) terms and were visualized as a graph (Figure 4C-D), the edge thickness represents the overlaping genes between GO terms while the node size represents the number of genes found in each GO term. Triglyceride, acylclycerol, neutral lipid, glycerol ether, and organic ether metabolic processes GO terms contain the same nine genes, while the glycerolipid metabolic process GO term contains three aditional genes (Chka, Pnpla7, Pi4kai) not shared by the others. These gene function designations in conjunction with the steroid metabolic process provide a more detailed delination of the role of Npas2 in regulating the metabolic function in the early developmental stages of the liver.
Figure 4. Candidate Genes Directly Regulated by NPAS2 by Overlap of Npas2 -/- Gene Set with BMAL1 and CLOCK Gene Targets.
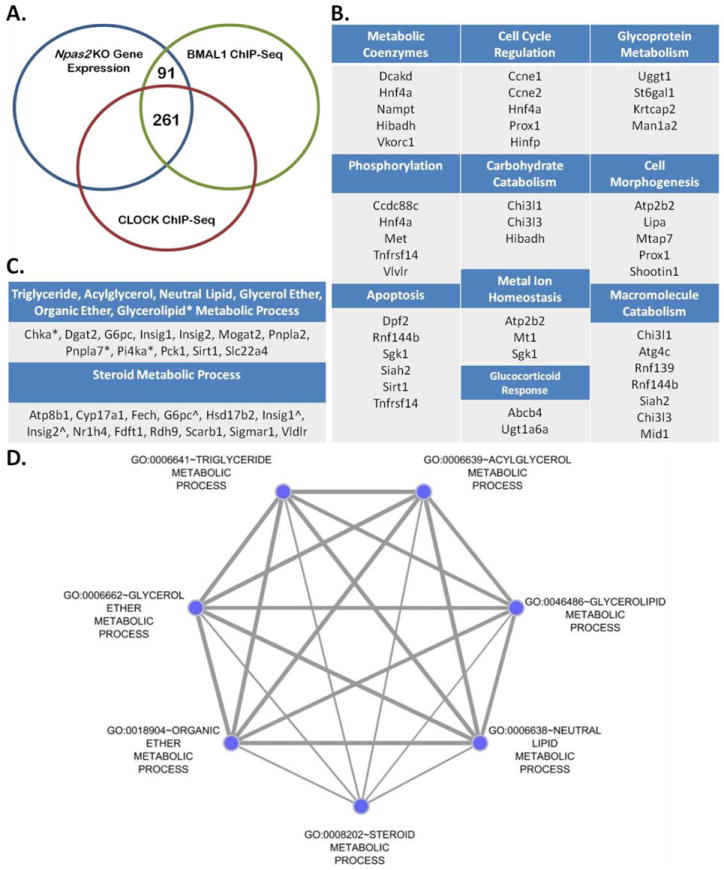
(A) Differentially expressed genes (3229) in Npas2 -/- liver (compared to +/+ control) (blue) compared with BMAL1 target genes (1997) from C57Bl/6 liver (green) (Rey et al., 2011) and CLOCK target genes (3201) from C57Bl/6J liver (red) (Koike et al., 2012). (B) 91 genes identified from BMAL1 ChIP-Seq, CLOCK ChIP-Seq and Npas2 -/- Exon Array overlap were analyzed by DAVID. 34 genes clustered into 10 GO terms. (C) List of genes represented in (D); * represents genes contained only in glycerolipid metabolic process GO term, ˆ represents genes shared by all seven GO terms. (D) Genes that intersected between BMAL1 and Npas2 -/- were analyzed using DAVID identifying seven GO terms. The graph was generated by visualizing the clustered GO terms using the Cytoscape Enrichment Map plugin, the edge thickness represents the overlaping genes between GO terms while the node size represents the number of genes found in each GO term.
Since the differential roles of NPAS2:BMAL1 and CLOCK:BMAL1 are unclear, some of the 352 genes may also be regulated by CLOCK. To distuguish between genes regulated by just NPAS2:BMAL1 we compared the 352 genes to genes associated with CLOCK binding generated through a CLOCK ChIP-Seq by Koike et al (Koike et al., 2012). From the 352 genes a sub-set of 91 genes (Table S2) were identified that are uniquely associated with Npas2 regulation. DAVID was used to sort the 91 genes by function. 34 of the 91 genes were found to cluster into ten distinct gene functional groups (Figure 4B), indicating that although Npas2 has a distinct role in regulating lipid metabolism its function is diverse.
DISCUSSION
Circadian genes, such as Npas2, have long been described as regulating gene expression through approximate 24-hour oscillations in gene expression. Historically, these phase-antiphase mechanisms have been described in association with signals received by exposure to light and dark cycles and regulated through the SCN. However, we and other investigators are describing other mechanisms of entraining the circadian response (Aagaard-Tillery et al., 2008; Dudley et al., 2003; Garcia et al., 2000; Seron-Ferre et al., 2007; Suter et al., 2011). Our interest arises from our aim to understand what entrains the fetal circadian response in the absence of light and dark exposure. In rats, other investigators have demonstrated that hepatic circadian gene oscillation starts is established by embryonic day (E) 20 (Sladek et al., 2007), while in mice there is evidence of early (E10) expression, albeit non-cyclic (Dolatshad et al., 2010). Moreover, while it has been suggested that Npas2 plays a key role in response to light/dark entrainment, we have shown that Npas2 may be entrained in primates by the maternal diet (Dudley et al., 2003; Suter et al., 2011). Ergo, we reasoned that pathway analysis in an embryonic genomic deletion model may help us resolve these apparent conflicts and reveal the underlying molecular mediators enabling both entrainment and long term reprogramming. In this study, we have demonstrated that by comparing the transcriptome of neonatal liver of Npas2 -/- to wild type mice, we have identified the fatty acid metabolic pathway (a subset of the lipid metabolism pathway) as being significantly altered (Table 1). We wish to emphasize that at day 2 these mice are not yet perceiving nor responding to cues from the light/dark cycle. Nevertheless, with deletion of both copies of Npas2, we observe a significant change of the metabolic molecular profile in both neonatal and adult life; this is consistent with suggestion by other investigators working with melanocortins (Johnson et al., 2010), as well as our prior findings in our non-human primates (Aagaard-Tillery et al., 2008; Suter et al., 2011).
Fatty acids are diverse molecules which are used by cells for energy, signaling, and lipid structures. Most cells utilize fatty acids for energy when available. A majority of the fatty acids uptake by the liver is synthesized into triglycerides, which are then transported through the blood stream to the adipose tissue for storage. Disruption of fatty acid metabolism in the liver which allows for accumulation of excess fatty acids can lead to fatty liver disease (Di Minno et al., 2012). In this study we identified the fatty acid metabolism pathway as disrupted in hepatic tissue. These genes with modified expression, found in table 1 in the results section, have diverse functions such as the desaturation of fatty acids, including the formation of essential fatty acids from dietary sources (Fads1, Fads2), regulating triglyceride levels (Angptl3), fatty acid transport (Crot) as well as some not well defined (Apoc1) (Devlin et al., 2007; Fan et al., 2012; Farrell et al., 1984; Inaba et al., 2003; Le Borgne et al., 2011; Liu et al., 2010; Stroud et al., 2009; Westerterp et al., 2007). Fads1, Fads2, Angptl3, Crot and Apoc1 have significantly reduced gene expression in the Npas2 -/- mice. In human studies, reduction of Fads1 gene expression is associated with increased hepatic lipid content (Mirkov et al., 2012). Angptl3 encodes an enzyme that inhibits lipoprotein lipase (LPL) which drives the lipolysis of triglycerides. A decrease in the expression of Angptl3 may increase the activity of LPL generating an increase in free fatty acids in hepatocytes. Crot is essential for the transport of conjugated fatty acids from peroxisomes into the cytoplasm. In human hepatocytes, decrease in CROT activity causes an increase in fatty acid transport out of the peroxisome (Le Borgne et al., 2011). Mice with over-expressed Apoc1 are protected from obesity and insulin resistance, implying an important role in metabolic activity (Westerterp et al., 2007). The expression profile of these genes in the Npas2 -/- mice indicate a potential loss of function for the hepatocytes to properly regulate fatty acid accumulation and conjugation which may lead to increased accumulation of lipid and changes in lipid signaling.
A network molecular interaction analysis allowed us to identify several molecular interactions among genes from the top three molecular pathways altered by loss of Npas2 (Table 1). We show that molecules of the molecular transport and oxidoreductase/ small molecule biochemistry pathways interact with molecules of the fatty acid metabolic pathway. Although not all genes identified from these molecular pathways intersect with lipid metabolism, the interactions that are highlighted indicate a much broader disruption of fatty acid metabolism than found solely in the canonical pathway. Genes identified in the molecular transport pathway have functions in transport of key initiating molecules of fatty acid metabolism, specifically the exchange of malate for citrate, essential in initiating step of fatty acid synthesis (Slc25a10), peroxisome import of very long chain fatty acids (VLCFA) which undergo fatty acid β-oxidation (Abcd3), and glycerol uptake, which is essential for the synthesis of triglycerides (Aqp9) (Calamita et al., 2012; Hillebrand et al., 2012; Hillebrand et al., 2007; Hirai et al., 2007; Jelen et al., 2011; Mizuarai et al., 2005). Oxidoreductase/ small molecule biochemistry pathway genes function in the fatty acid metabolic pathway through catalyzing the first step fatty acid β-oxidation of VLCFA (Acadvl), lipid transport (Por), β-oxidation of unsaturated fatty acids (Decr1), and β-oxidation of long chain fatty acids (LCFA) (Hadha) (Ibdah et al., 2005; Miinalainen et al., 2009; Mutch et al., 2007; Porter et al., 2011; Tucci et al., 2010a; Tucci et al., 2010b). Deficiencies in mitochondrial β-oxidation in the liver induce oxidative stress and correlates with hepatic steatosis. Ultimately, loss of Npas2 is associated with a diverse modification of fatty acid metabolism that could potentially induce fatty liver disease through accumulation of fatty acids and oxidative stress.
In addition to characterizing the role of Npas2 in hepatic neonatal functions, we also observed hepatic metabolic gene expression during both neonatal and adult life. We hypothesized that Npas2 deletion would correlate with a gene expression profile that was similar in direction, but not magnitude when comparing neonatal and adult liver tissue. Evidence for our hypothesis is found in that circadian genes in hepatic tissue demonstrate an increased expression from fetal to adult stages in development (Li et al., 2012). Only two of the ten genes we analyzed, Sds and Upp2, demonstrated gene expression that confirmed our hypothesis, while the other eight did not follow this pattern.
Taken as a whole, Fgf1, Gpd1, Grb14, Gulo, Hmgcs1, Lpin1, and Scd1, demonstrate a reversal in gene expression from day 2 to week 25. Such a change may indicate that the Npas2 gene expression alters through developmental stages, which is not surprising. In addition to the development of the body, the ability of mice to receive signals from and respond to light stimuli dramatically shifts from birth to adulthood (Hannibal and Fahrenkrug, 2004; Johnson et al., 2010). Introduction of light/ dark cycles adds additional stimuli to the circadian pathway and may naturally cause changes in Npas2 expression. Our neonatal mice may serve to provide insight into fetal regulation of circadian rhythms by Npas2, as at day 2 of life, the mice have yet to open their eyes and circadian rhythms are not yet entrained by the SCN due to light stimuli. Although essential in neonatal metabolic regulation, Npas2 may play a lesser role in adult functions. However, in the case of Lpin1 and Scd1, we report a change in gene expression from day 2 to week 25 that returns these genes to wild type expression levels. This indicates that a mechanism may exist that compensates for the loss of Npas2 in adult mice. One such mechanism could be CLOCK, a paralog of NPAS2.
Various reports have suggested that CLOCK and NPAS2 overlap in their role in the liver and the SCN (Bertolucci et al., 2008; DeBruyne et al., 2007). One study compared circadian rhythms and behavior in Clock -/- mice, in which alterations of some circadian regulated genes occur but most persist with normal expression, meanwhile no debilitating behavioral phenotype is observed (Debruyne et al., 2006). In a follow up study, a double knock out mouse (Clock-/-; Npas2-/-), resulted in a loss circadian gene rhythmic expression (Bmal1, Per1, Per2, Rev-erbα) as well as an inability of the mice to adapt to constant darkness. Additionally, Clock was confirmed to have a more prominent role in the SCN, however Npas2 can compensate for the loss of Clock (DeBruyne et al., 2007). In our current study we have demonstrated that although Clock expression is decreased in neonatal Npas2 -/- mice, the level of Clock expression normalizes to +/+ expression levels in adult mice. Further studies are required; however CLOCK is a candidate for compensation of metabolic regulation in the adult mouse liver when Npas2 is absent or under expressed.
We report that the upregulation of one gene, Ppargc1a (PGC1α), is persistently altered in both neonatal and adult life. Ppargc1a is a transcriptional co-activator which integrates the circadian pathway with metabolism, notably with mitochondrial biogenesis (Liu et al., 2007). Ppargc1a -/- mice are resistant to obesity on a high fat diet, while susceptible to hepatic steatosis under fasting conditions (Leone et al., 2005; Lin et al., 2004). Of interest to our work on the effects of the maternal high fat diet (MHFD), Ppargc1a gene expression is reduced under the exposure of a MHFD (Burgueno et al., 2013). Only rats exposed to MHFD then continued on a high fat diet after weaning developed abnormal lipid accumulation in the liver and the abdominal cavity (Burgueno et al., 2013). Not only does Npas2 have a unique role in neonatal development, but it may regulate the gene expression of Ppargc1a which integrates circadian signaling and metabolic regulation.
NPAS2 forms an obligate heterodimer with BMAL1 to drive the circadian gene regulation pathway. The interconnected role of NPAS2 and BMAL1 allowed us to utilize data generated by a BMAL1 ChIP on adult mouse liver to identify genes directly regulated by the NPAS2:BMAL1 heterodimer complex (Rey et al., 2011). We identified 352 gene candidates of NPAS2:BMAL1 direct regulation. In addition to BMAL1 forming a heterodimer with NPAS2, it also dimerizes with CLOCK, another transcription factor which drives the circadian gene regulation pathway. No studies to date comprehensively characterize the relative role of NPAS2 and CLOCK. However, when overlaping the 352 gene candidates for NPAS2:BMAL1 regulation with genes associated with CLOCK direct regulation (Koike et al., 2012) we were able to identify genes associated with NPAS2:BMAL1 regulation but not CLOCK:BMAL1 regulation. We report 91 genes which are candidates for Npas2 direct regulation. Comparing day 2 gene expression data with adult ChIP data did not provide a definitive list of genes directly regulated by Npas2, however it provides a preliminary list of candidate genes of Npas2 direct regulation. We anticipated that greater than half of the genes regulated by BMAL1 would associate with genes regulated by NPAS2, however only 21.7% of the gene promoter regions bound by BMAL1 overlap with genes with modified gene expression in the Npas2 -/- model. These results may be explained by the differences between fetal and adult circadian gene expression (Li et al., 2012). However, our study demonstrates that Npas2 is integral to regulating lipid metabolism in fetal hepatic development.
We have sought to answer a key question concerning the role of circadian genes during fetal development, specifically the role of Npas2 in regulating metabolism. It was not previously known if Npas2 had any function in fetal development since circadian cyclic signaling is not fully established until after birth (Sladek et al., 2007). Pathway analysis established a significant change in gene expression in the hepatic fatty acid metabolism molecular pathway due to a loss of Npas2. In seeking to understand a role of Npas2 not only in fetal development, but also in adult life we discovered that Ppargc1a expression remains constant over time. As Ppargc1a integrates both circadian gene regulation and metabolism, we speculate that Npas2 plays an important role in adapting to high fat diet exposure not only from maternal sources but throughout all developmental stages. Taken together, our data in non-human primate and murine genetic models suggest that circadian genes have a vital and previously not described role in fetal development and metabolic programming, with Npas2 notably and specifically regulating lipid metabolism.
Experimental Procedures
Animals
All animal procedures were in accordance with the guidelines of Institutional Animal Care and Use Committee (IACUC) with protocols from the University of Texas Southwestern Medical Center and Baylor College of Medicine. Npas2 knockout mice (-/-) in this study were provided by Dr. McKnight (University of Texas Southwestern Medical Center, Dallas, Texas). Briefly, targeted disruption in 129S6/SvEvTac-embryonic stem cells of the Npas2 allele was employed to generate the Npas2 -/- mice. These mice were then backcrossed to the C57BL/6J mouse strain (Dudley et al., 2003; Garcia et al., 2000). Each mouse genotype was determined by PCR amplification (Garcia et al., 2000). Mice were housed in cages located in a temperature-controlled room (25 °C), with a 12:12 hr light: dark cycle, and maintained on standard rodent chow (5001, Purina Mills, LLC, Gray Summit, MO) and tap water, available ad libitum.
RNA Isolation
Npas2 knock out mice (-/-), Npas2 heterozygous mice (+/-) and Npas2 wild type mice (+/+) were euthanized at day 2 of life (newborn) and littermates at 25 weeks of life (adult). Total RNA was extracted from hepatic tissue according to the NucleoSpin standard protocol (Clontech, Mountain View, CA) and then quantified. Isolated RNA was processed for sample quality control (SAQC) utilizing the Nanodrop spectrophotometer ND-1000 (Thermo Fisher Scientific Inc., Wilmington, DE) and Agilent Bioanalyzer 2100 (Agilent Technologies, Inc., Santa Clara, CA).
Exon Microarray
The Affymetrix Genechip® Microarray System (Affymetrix, Santa Clara, CA) was followed specifically using the Affymetrix Exon protocol (Affymetrix). The process was as follows: (WT Target labeling and Control Reagents were used throughout) Ambion WT Expression Kit (Life Technologies, Grand Island, NY) protocol and reagents were used to convert total RNA into sense-strand cDNA. The cDNA was then fragmented and labeled using the Affymetrix GeneChip® WT Terminal Labeling Kit (PN 900671, Affymetrix). As per the Ambion WT Expression Kit (Life Technologies) protocol, samples of 100ng of total RNA were added to T7 primers and used as a template to synthesize cDNA. The cDNA was then in vitro transcribed to create a complement RNA (cRNA) template. Per sample, 10ug of cRNA was combined with random primers and synthesized to produce cDNA once again. The resulting 5.5ug of cDNA per sample was fragmented and biotin-labeled following the Affymetrix GeneChip® WT Terminal Labeling Kit (PN 900671, Affymetrix). A 200 uL hybridization cocktail containing Affymetrix spike-in controls (Affymetrix) and the fragmented, labeled cDNA was loaded onto the GeneChip® Mouse Exon 1.0 ST array (Affymetrix). The arrays were hybridized for 17 hours at 45°C with rotation at 60 rpm on the GeneChip® Hybridization Oven 640 (Affymetrix). The arrays were then washed and stained with a streptavidin, R-phycoerythrin conjugate stain on the GeneChip® Fluidics Station 450 (Affymetrix). Signal amplification was assessed using biotinylated anti-streptavidin. The stained arrays were scanned on the Affymetrix GeneChip® Scanner 3000 (Affymetrix). The images were analyzed and quality control metrics recorded using Affymetrix Expression Console software version 3.0 (Affymetrix).
Gene Expression Analysis
Gene expression analysis was performed to identify genes of interest. First pass analysis was performed using the Partek Genomics Suite software (Partek Inc., St Louis, MO) and GeneSpring GX 11.5 (Agilent Technologies, Inc., Santa Clara, CA). Raw Genechip expression data was imported from .CEL files. The sample treatment information (animal pool, age, and genotype) was imported from .EXP files. Raw data was normalized in Genespring GX using the ExonR RMA 16 summarization algorithm followed by quantile normalization and baseline transformation to median of all samples. The exon array contains 17,831 probe sets. Expression values were further denoised by filtering on raw expression levels below the 20th percentile level thereby reducing the number of probe sets to 13,564. All further analysis was performed using this filtered list of probe sets (genes).
Unsupervised Hierarchical cluster analysis was performed in GeneSpring GX 11.5 (Agilent Technologies, Santa Clara, CA). Hierarchical clustering using a squared Euclidean similarity measure and centroid linkage generated dendrogram distance metrics of 0.26 between two major branches containing either all three -/- samples or the +/+ and +/- samples (data not shown). Distance metrics between the -/- samples were 0.02 and ranged from 0.02 to 0.11 for the +/+ and +/- samples. PCA analysis also resulted in similar groupings (data not shown), indicating that +/+ and +/- samples were comparable, therefore these samples were grouped together for all subsequent analyses. Differential gene expression was investigated by ANOVA and t-test algorithms with the following filtering criteria: fold change of 1.5 (-/- vs. +/+ or +/-) and an adjusted p-value < .05, unless otherwise noted. The Benjamin Hochberg (Hochberg and Benjamini, 1990) algorithm was applied for multiple testing correction.
Normalized and filtered data was entered into Ingenuity Pathway Analysis (IPA) (Ingenuity Systems, Redwood City, CA), and GSEA (Broad Institute, Cambridge, MA) pathway analysis with the same filtering criteria described previously. Genes identified in the pathway analysis above were selected and then analyzed for molecular interaction networks utilizing the Pathway Designer tool in IPA.
Quantitative Real-time PCR
Relative transcription levels were quantified through real time-polymerase chain reaction (rtPCR). cDNA was synthesized from RNA isolated from liver tissue (day 2 and week 25) following the manufacturer’s protocol for the High Capacity cDNA Reverse Transcription Kit (Life Technologies, Grand Island, NY). cDNA samples were mixed with commercially available primers (Life Technologies) and run on the ABI 7900 HT (Life Technologies) for rtPCR analysis. Commercially available primers for the following genes were selected: Bmal1, Clock, Cry2, Dec1, Fgf1, Gpd1, Grb14, Gulo, Hmgcs1, Inhbe, Inmt, Lpin1, Npas2, Per1, Ppargc1a, Rev-erbβ, Rorα, Rorγ, Scd1, Sds, and Upp2. Gapdh was used as internal control. rtPCR for each sample was repeated each time with each run performed in quadruplicate. mRNA levels of respective genes in independent samples were quantified for fold difference using the ΔΔCT method as described by others (Livak and Schmittgen, 2001; Pfaffl, 2001; Suter et al., 2012). Statistical significance was determined by ANOVA and significance set at p <0.05.
BMAL1 ChIP Comparison
A set of BMAL1 and CLOCK gene promoter region targets in mouse liver tissue was compiled by Rey et al and Koike et al respectively (Koike et al., 2012; Rey et al., 2011). Briefly, mice used in the BMAL1 study were between 12-16 weeks old. Animals were housed for three weeks under a regimen of 12-h light/ 12-h dark (LD 12:12) with unrestricted access to food and water. Mice were sacrificed at six time points over a 24-h period (Zeitgeiber Time (ZT) 2, 6, 10, 14, 18, 22, ZT 0 is defined as when the lights are turned on). Mice used in the CLOCK study were between 9-13 weeks old at time of sacrifice. Animals were housed for at least seven day in LD 12:12 conditions then transferred to total darkness conditions for 36 hours. BMAL1 and CLOCK ChIP was conducted with a BMAL1 and CLOCK polyclonal antibody applied to liver extracts. Sequencing of the co-immunoprecipitated DNA was carried out by Illumina sequencing (BMAL1, Illumina Genome Analyzer 2) and by SOLiD sequencing (CLOCK, Applied Biosystems SOLiD4 or 5500xl). Sequenced DNA reads were mapped to the mouse genome (NCBI m37 genome assembly) using Bowtie (BMAL1) and Applied Biosystems BioScope v1.3(CLOCK). All genomic sites identified were compiled and the complete annotated list is found at: doi:10.1371/journal.pdbio.1000595.s019 (BMAL1) and http://www.sciencemag.org/content/338/6105/349/suppl/DC1 (CLOCK). We compared these gene sets (BMAL1: 1636 genes; CLOCK: 3201 genes) to the set of genes with differential gene expression levels in the Npas2 -/- mouse liver (3229 genes) identifying genes represented in all data sets. Genes that intersected between BMAL1 and Npas2 -/- were analyzed using the Database for Annotation, Visualization and Integrated Discovery (DAVID) (Huang da et al., 2009) and seven Gene Ontology (GO) terms were identifed as enriched at p < 0.05 (Benjamini Multiple Testing Corrected). Enriched GO terms were visualized using the Cytoscape (Smoot et al., 2011) Enrichment Map plugin (Merico et al., 2010). Additionally genes that intersected between all data sets were analyzed by DAVID for 10 unique functional groups were identified by GO terms enriched at p<0.05 (Fisher Exact Test).
Supplementary Material
Highlights.
In utero, fetal circadian rhythms are established in the absence of light and dark cues.
We have previously demonstrated in a primate model that the fetal peripheral circadian regulator, Npas2, is entrained by the maternal diet.
As the interaction of circadian response with metabolism is not well understood, we employed a murine knockout model and transcriptomics and characterized the molecular mechanisms with which Npas2 reprograms the fetal hepatic metabolic response.
Ppargc1a, which integrates circadian and metabolism pathways, was significantly (p<.01) over expressed in newborn (1.7 fold) and adult (1.8 fold) Npas2-/- animals.
These findings are consistent with an essential role for Npas2 in programming the peripheral circadian response and hepatic metabolism.
Acknowledgments
This work was supported by the NIH Director New Innovator Award (DP2120OD001500-01 K.M.A.), Reproductive Scientist Development Program, NIH (5K12HD00849 K.M.A.), NIH R01 (R01DK079194 K.M.A and R.H.L) and National Institute of General Medical Sciences (T32 GM088129-01 D.O.). The authors wish to acknowledge the contributions from Dr. Min Hu, Cynthia Shope, and helpful comments of members of the Aagaard and Hawkins laboratory at Baylor College of Medicine, and Dr. Steven McKnight for the tissue samples from the Npas2 -/- mouse.
Footnotes
The authors have no conflicts of interest to disclose.
Publisher's Disclaimer: This is a PDF file of an unedited manuscript that has been accepted for publication. As a service to our customers we are providing this early version of the manuscript. The manuscript will undergo copyediting, typesetting, and review of the resulting proof before it is published in its final citable form. Please note that during the production process errors may be discovered which could affect the content, and all legal disclaimers that apply to the journal pertain.
References
- Aagaard-Tillery KM, Grove K, Bishop J, Ke X, Fu Q, McKnight R, Lane RH. Developmental origins of disease and determinants of chromatin structure: maternal diet modifies the primate fetal epigenome. J Mol Endocrinol. 2008;41:91–102. doi: 10.1677/JME-08-0025. [DOI] [PMC free article] [PubMed] [Google Scholar]
- Akhtar RA, Reddy AB, Maywood ES, Clayton JD, King VM, Smith AG, Gant TW, Hastings MH, Kyriacou CP. Circadian cycling of the mouse liver transcriptome, as revealed by cDNA microarray, is driven by the suprachiasmatic nucleus. Curr Biol. 2002;12:540–550. doi: 10.1016/s0960-9822(02)00759-5. [DOI] [PubMed] [Google Scholar]
- Bertolucci C, Cavallari N, Colognesi I, Aguzzi J, Chen Z, Caruso P, Foa A, Tosini G, Bernardi F, Pinotti M. Evidence for an overlapping role of CLOCK and NPAS2 transcription factors in liver circadian oscillators. Mol Cell Biol. 2008;28:3070–3075. doi: 10.1128/MCB.01931-07. [DOI] [PMC free article] [PubMed] [Google Scholar]
- Burgueno AL, Cabrerizo R, Gonzales Mansilla N, Sookoian S, Pirola CJ. Maternal high-fat intake during pregnancy programs metabolic-syndrome-related phenotypes through liver mitochondrial DNA copy number and transcriptional activity of liver PPARGC1A. J Nutr Biochem. 2013;24:6–13. doi: 10.1016/j.jnutbio.2011.12.008. [DOI] [PubMed] [Google Scholar]
- Calamita G, Gena P, Ferri D, Rosito A, Rojek A, Nielsen S, Marinelli RA, Fruhbeck G, Svelto M. Biophysical assessment of aquaporin-9 as principal facilitative pathway in mouse liver import of glucogenetic glycerol. Biol Cell. 2012;104:342–351. doi: 10.1111/boc.201100061. [DOI] [PubMed] [Google Scholar]
- Crumbley C, Wang Y, Kojetin DJ, Burris TP. Characterization of the core mammalian clock component, NPAS2, as a REV-ERBalpha/RORalpha target gene. J Biol Chem. 2010;285:35386–35392. doi: 10.1074/jbc.M110.129288. [DOI] [PMC free article] [PubMed] [Google Scholar]
- Debruyne JP, Noton E, Lambert CM, Maywood ES, Weaver DR, Reppert SM. A clock shock: mouse CLOCK is not required for circadian oscillator function. Neuron. 2006;50:465–477. doi: 10.1016/j.neuron.2006.03.041. [DOI] [PubMed] [Google Scholar]
- DeBruyne JP, Weaver DR, Reppert SM. CLOCK and NPAS2 have overlapping roles in the suprachiasmatic circadian clock. Nat Neurosci. 2007;10:543–545. doi: 10.1038/nn1884. [DOI] [PMC free article] [PubMed] [Google Scholar]
- Devlin AM, Singh R, Wade RE, Innis SM, Bottiglieri T, Lentz SR. Hypermethylation of Fads2 and altered hepatic fatty acid and phospholipid metabolism in mice with hyperhomocysteinemia. J Biol Chem. 2007;282:37082–37090. doi: 10.1074/jbc.M704256200. [DOI] [PubMed] [Google Scholar]
- Di Minno MN, Russolillo A, Lupoli R, Ambrosino P, Di Minno A, Tarantino G. Omega-3 fatty acids for the treatment of non-alcoholic fatty liver disease. World J Gastroenterol. 2012;18:5839–5847. doi: 10.3748/wjg.v18.i41.5839. [DOI] [PMC free article] [PubMed] [Google Scholar]
- Dioum EM, Rutter J, Tuckerman JR, Gonzalez G, Gilles-Gonzalez MA, McKnight SL. NPAS2: a gas-responsive transcription factor. Science. 2002;298:2385–2387. doi: 10.1126/science.1078456. [DOI] [PubMed] [Google Scholar]
- Dolatshad H, Cary AJ, Davis FC. Differential expression of the circadian clock in maternal and embryonic tissues of mice. PLoS One. 2010;5:e9855. doi: 10.1371/journal.pone.0009855. [DOI] [PMC free article] [PubMed] [Google Scholar]
- Dudley CA, Erbel-Sieler C, Estill SJ, Reick M, Franken P, Pitts S, McKnight SL. Altered patterns of sleep and behavioral adaptability in NPAS2-deficient mice. Science. 2003;301:379–383. doi: 10.1126/science.1082795. [DOI] [PubMed] [Google Scholar]
- Englund A, Kovanen L, Saarikoski ST, Haukka J, Reunanen A, Aromaa A, Lonnqvist J, Partonen T. NPAS2 and PER2 are linked to risk factors of the metabolic syndrome. J Circadian Rhythms. 2009;7:5. doi: 10.1186/1740-3391-7-5. [DOI] [PMC free article] [PubMed] [Google Scholar]
- Fan YY, Monk JM, Hou TY, Callway E, Vincent L, Weeks B, Yang P, Chapkin RS. Characterization of an arachidonic acid-deficient (Fads1 knockout) mouse model. J Lipid Res. 2012;53:1287–1295. doi: 10.1194/jlr.M024216. [DOI] [PMC free article] [PubMed] [Google Scholar]
- Farrell SO, Fiol CJ, Reddy JK, Bieber LL. Properties of purified carnitine acyltransferases of mouse liver peroxisomes. J Biol Chem. 1984;259:13089–13095. [PubMed] [Google Scholar]
- Garcia JA, Zhang D, Estill SJ, Michnoff C, Rutter J, Reick M, Scott K, Diaz-Arrastia R, McKnight SL. Impaired cued and contextual memory in NPAS2-deficient mice. Science. 2000;288:2226–2230. doi: 10.1126/science.288.5474.2226. [DOI] [PubMed] [Google Scholar]
- Hannibal J, Fahrenkrug J. Melanopsin containing retinal ganglion cells are light responsive from birth. Neuroreport. 2004;15:2317–2320. doi: 10.1097/00001756-200410250-00003. [DOI] [PubMed] [Google Scholar]
- Hillebrand M, Gersting SW, Lotz-Havla AS, Schafer A, Rosewich H, Valerius O, Muntau AC, Gartner J. Identification of a new fatty acid synthesis-transport machinery at the peroxisomal membrane. J Biol Chem. 2012;287:210–221. doi: 10.1074/jbc.M111.272732. [DOI] [PMC free article] [PubMed] [Google Scholar]
- Hillebrand M, Verrier SE, Ohlenbusch A, Schafer A, Soling HD, Wouters FS, Gartner J. Live cell FRET microscopy: homo- and heterodimerization of two human peroxisomal ABC transporters, the adrenoleukodystrophy protein (ALDP, ABCD1) and PMP70 (ABCD3) J Biol Chem. 2007;282:26997–27005. doi: 10.1074/jbc.M702122200. [DOI] [PubMed] [Google Scholar]
- Hirai T, Fukui Y, Motojima K. PPARalpha agonists positively and negatively regulate the expression of several nutrient/drug transporters in mouse small intestine. Biol Pharm Bull. 2007;30:2185–2190. doi: 10.1248/bpb.30.2185. [DOI] [PubMed] [Google Scholar]
- Hochberg Y, Benjamini Y. More powerful procedures for multiple significance testing. Stat Med. 1990;9:811–818. doi: 10.1002/sim.4780090710. [DOI] [PubMed] [Google Scholar]
- Huang da W, Sherman BT, Lempicki RA. Systematic and integrative analysis of large gene lists using DAVID bioinformatics resources. Nat Protoc. 2009;4:44–57. doi: 10.1038/nprot.2008.211. [DOI] [PubMed] [Google Scholar]
- Ibdah JA, Perlegas P, Zhao Y, Angdisen J, Borgerink H, Shadoan MK, Wagner JD, Matern D, Rinaldo P, Cline JM. Mice heterozygous for a defect in mitochondrial trifunctional protein develop hepatic steatosis and insulin resistance. Gastroenterology. 2005;128:1381–1390. doi: 10.1053/j.gastro.2005.02.001. [DOI] [PubMed] [Google Scholar]
- Inaba T, Matsuda M, Shimamura M, Takei N, Terasaka N, Ando Y, Yasumo H, Koishi R, Makishima M, Shimomura I. Angiopoietin-like protein 3 mediates hypertriglyceridemia induced by the liver X receptor. J Biol Chem. 2003;278:21344–21351. doi: 10.1074/jbc.M213202200. [DOI] [PubMed] [Google Scholar]
- Jelen S, Wacker S, Aponte-Santamaria C, Skott M, Rojek A, Johanson U, Kjellbom P, Nielsen S, de Groot BL, Rutzler M. Aquaporin-9 protein is the primary route of hepatocyte glycerol uptake for glycerol gluconeogenesis in mice. J Biol Chem. 2011;286:44319–44325. doi: 10.1074/jbc.M111.297002. [DOI] [PMC free article] [PubMed] [Google Scholar]
- Johnson J, Wu V, Donovan M, Majumdar S, Renteria RC, Porco T, Van Gelder RN, Copenhagen DR. Melanopsin-dependent light avoidance in neonatal mice. Proc Natl Acad Sci U S A. 2010;107:17374–17378. doi: 10.1073/pnas.1008533107. [DOI] [PMC free article] [PubMed] [Google Scholar]
- Koike N, Yoo SH, Huang HC, Kumar V, Lee C, Kim TK, Takahashi JS. Transcriptional architecture and chromatin landscape of the core circadian clock in mammals. Science. 2012;338:349–354. doi: 10.1126/science.1226339. [DOI] [PMC free article] [PubMed] [Google Scholar]
- Kondratov RV, Kondratova AA, Lee C, Gorbacheva VY, Chernov MV, Antoch MP. Post-translational regulation of circadian transcriptional CLOCK(NPAS2)/BMAL1 complex by CRYPTOCHROMES. Cell Cycle. 2006;5:890–895. doi: 10.4161/cc.5.8.2684. [DOI] [PubMed] [Google Scholar]
- Le Borgne F, Ben Mohamed A, Logerot M, Garnier E, Demarquoy J. Changes in carnitine octanoyltransferase activity induce alteration in fatty acid metabolism. Biochem Biophys Res Commun. 2011;409:699–704. doi: 10.1016/j.bbrc.2011.05.068. [DOI] [PubMed] [Google Scholar]
- Leone TC, Lehman JJ, Finck BN, Schaeffer PJ, Wende AR, Boudina S, Courtois M, Wozniak DF, Sambandam N, Bernal-Mizrachi C, et al. PGC-1alpha deficiency causes multi-system energy metabolic derangements: muscle dysfunction, abnormal weight control and hepatic steatosis. PLoS Biol. 2005;3:e101. doi: 10.1371/journal.pbio.0030101. [DOI] [PMC free article] [PubMed] [Google Scholar]
- Li C, Yu S, Zhong X, Wu J, Li X. Transcriptome comparison between fetal and adult mouse livers: implications for circadian clock mechanisms. PLoS One. 2012;7:e31292. doi: 10.1371/journal.pone.0031292. [DOI] [PMC free article] [PubMed] [Google Scholar]
- Lin J, Wu PH, Tarr PT, Lindenberg KS, St-Pierre J, Zhang CY, Mootha VK, Jager S, Vianna CR, Reznick RM, et al. Defects in adaptive energy metabolism with CNS-linked hyperactivity in PGC-1alpha null mice. Cell. 2004;119:121–135. doi: 10.1016/j.cell.2004.09.013. [DOI] [PubMed] [Google Scholar]
- Liu C, Li S, Liu T, Borjigin J, Lin JD. Transcriptional coactivator PGC-1alpha integrates the mammalian clock and energy metabolism. Nature. 2007;447:477–481. doi: 10.1038/nature05767. [DOI] [PubMed] [Google Scholar]
- Liu J, Afroza H, Rader DJ, Jin W. Angiopoietin-like protein 3 inhibits lipoprotein lipase activity through enhancing its cleavage by proprotein convertases. J Biol Chem. 2010;285:27561–27570. doi: 10.1074/jbc.M110.144279. [DOI] [PMC free article] [PubMed] [Google Scholar]
- Livak KJ, Schmittgen TD. Analysis of relative gene expression data using real-time quantitative PCR and the 2(-Delta Delta C(T)) Method. Methods. 2001;25:402–408. doi: 10.1006/meth.2001.1262. [DOI] [PubMed] [Google Scholar]
- Merico D, Isserlin R, Stueker O, Emili A, Bader GD. Enrichment map: a network-based method for gene-set enrichment visualization and interpretation. PLoS One. 2010;5:e13984. doi: 10.1371/journal.pone.0013984. [DOI] [PMC free article] [PubMed] [Google Scholar]
- Miinalainen IJ, Schmitz W, Huotari A, Autio KJ, Soininen R, Ver Loren van Themaat E, Baes M, Herzig KH, Conzelmann E, Hiltunen JK. Mitochondrial 2,4-dienoyl-CoA reductase deficiency in mice results in severe hypoglycemia with stress intolerance and unimpaired ketogenesis. PLoS Genet. 2009;5:e1000543. doi: 10.1371/journal.pgen.1000543. [DOI] [PMC free article] [PubMed] [Google Scholar]
- Miller BH, Olson SL, Turek FW, Levine JE, Horton TH, Takahashi JS. Circadian clock mutation disrupts estrous cyclicity and maintenance of pregnancy. Curr Biol. 2004;14:1367–1373. doi: 10.1016/j.cub.2004.07.055. [DOI] [PMC free article] [PubMed] [Google Scholar]
- Mirkov S, Myers JL, Ramirez J, Liu W. SNPs affecting serum metabolomic traits may regulate gene transcription and lipid accumulation in the liver. Metabolism. 2012;61:1523–1527. doi: 10.1016/j.metabol.2012.05.004. [DOI] [PMC free article] [PubMed] [Google Scholar]
- Mizuarai S, Miki S, Araki H, Takahashi K, Kotani H. Identification of dicarboxylate carrier Slc25a10 as malate transporter in de novo fatty acid synthesis. J Biol Chem. 2005;280:32434–32441. doi: 10.1074/jbc.M503152200. [DOI] [PubMed] [Google Scholar]
- Mutch DM, Klocke B, Morrison P, Murray CA, Henderson CJ, Seifert M, Williamson G. The disruption of hepatic cytochrome p450 reductase alters mouse lipid metabolism. J Proteome Res. 2007;6:3976–3984. doi: 10.1021/pr0700448. [DOI] [PubMed] [Google Scholar]
- Oishi K, Atsumi G, Sugiyama S, Kodomari I, Kasamatsu M, Machida K, Ishida N. Disrupted fat absorption attenuates obesity induced by a high-fat diet in Clock mutant mice. FEBS Lett. 2006;580:127–130. doi: 10.1016/j.febslet.2005.11.063. [DOI] [PubMed] [Google Scholar]
- Panda S, Antoch MP, Miller BH, Su AI, Schook AB, Straume M, Schultz PG, Kay SA, Takahashi JS, Hogenesch JB. Coordinated transcription of key pathways in the mouse by the circadian clock. Cell. 2002;109:307–320. doi: 10.1016/s0092-8674(02)00722-5. [DOI] [PubMed] [Google Scholar]
- Pfaffl MW. A new mathematical model for relative quantification in real-time RT-PCR. Nucleic Acids Res. 2001;29:e45. doi: 10.1093/nar/29.9.e45. [DOI] [PMC free article] [PubMed] [Google Scholar]
- Porter TD, Banerjee S, Stolarczyk EI, Zou L. Suppression of cytochrome P450 reductase (POR) expression in hepatoma cells replicates the hepatic lipidosis observed in hepatic POR-null mice. Drug Metab Dispos. 2011;39:966–973. doi: 10.1124/dmd.111.038562. [DOI] [PMC free article] [PubMed] [Google Scholar]
- Preitner N, Damiola F, Lopez-Molina L, Zakany J, Duboule D, Albrecht U, Schibler U. The orphan nuclear receptor REV-ERBalpha controls circadian transcription within the positive limb of the mammalian circadian oscillator. Cell. 2002;110:251–260. doi: 10.1016/s0092-8674(02)00825-5. [DOI] [PubMed] [Google Scholar]
- Ptitsyn AA, Zvonic S, Conrad SA, Scott LK, Mynatt RL, Gimble JM. Circadian clocks are resounding in peripheral tissues. PLoS Comput Biol. 2006;2:e16. doi: 10.1371/journal.pcbi.0020016. [DOI] [PMC free article] [PubMed] [Google Scholar]
- Reick M, Garcia JA, Dudley C, McKnight SL. NPAS2: an analog of clock operative in the mammalian forebrain. Science. 2001;293:506–509. doi: 10.1126/science.1060699. [DOI] [PubMed] [Google Scholar]
- Rey G, Cesbron F, Rougemont J, Reinke H, Brunner M, Naef F. Genome-wide and phase-specific DNA-binding rhythms of BMAL1 control circadian output functions in mouse liver. PLoS Biol. 2011;9:e1000595. doi: 10.1371/journal.pbio.1000595. [DOI] [PMC free article] [PubMed] [Google Scholar]
- Rutter J, Reick M, Wu LC, McKnight SL. Regulation of clock and NPAS2 DNA binding by the redox state of NAD cofactors. Science. 2001;293:510–514. doi: 10.1126/science.1060698. [DOI] [PubMed] [Google Scholar]
- Seron-Ferre M, Valenzuela GJ, Torres-Farfan C. Circadian clocks during embryonic and fetal development. Birth Defects Res C Embryo Today. 2007;81:204–214. doi: 10.1002/bdrc.20101. [DOI] [PubMed] [Google Scholar]
- Sladek M, Jindrakova Z, Bendova Z, Sumova A. Postnatal ontogenesis of the circadian clock within the rat liver. Am J Physiol Regul Integr Comp Physiol. 2007;292:R1224–1229. doi: 10.1152/ajpregu.00184.2006. [DOI] [PubMed] [Google Scholar]
- Smoot ME, Ono K, Ruscheinski J, Wang PL, Ideker T. Cytoscape 2.8: new features for data integration and network visualization. Bioinformatics. 2011;27:431–432. doi: 10.1093/bioinformatics/btq675. [DOI] [PMC free article] [PubMed] [Google Scholar]
- Storch KF, Lipan O, Leykin I, Viswanathan N, Davis FC, Wong WH, Weitz CJ. Extensive and divergent circadian gene expression in liver and heart. Nature. 2002;417:78–83. doi: 10.1038/nature744. [DOI] [PubMed] [Google Scholar]
- Stroud CK, Nara TY, Roqueta-Rivera M, Radlowski EC, Lawrence P, Zhang Y, Cho BH, Segre M, Hess RA, Brenna JT, et al. Disruption of FADS2 gene in mice impairs male reproduction and causes dermal and intestinal ulceration. J Lipid Res. 2009;50:1870–1880. doi: 10.1194/jlr.M900039-JLR200. [DOI] [PMC free article] [PubMed] [Google Scholar]
- Suter M, Bocock P, Showalter L, Hu M, Shope C, McKnight R, Grove K, Lane R, Aagaard-Tillery K. Epigenomics: maternal high-fat diet exposure in utero disrupts peripheral circadian gene expression in nonhuman primates. Faseb J. 2011;25:714–726. doi: 10.1096/fj.10-172080. [DOI] [PMC free article] [PubMed] [Google Scholar]
- Suter MA, Sangi-Haghpeykar H, Showalter L, Shope C, Hu M, Brown K, Williams S, Harris RA, Grove KL, Lane RH, et al. Maternal high-fat diet modulates the fetal thyroid axis and thyroid gene expression in a nonhuman primate model. Mol Endocrinol. 2012;26:2071–2080. doi: 10.1210/me.2012-1214. [DOI] [PMC free article] [PubMed] [Google Scholar]
- Takeda Y, Kang HS, Angers M, Jetten AM. Retinoic acid-related orphan receptor gamma directly regulates neuronal PAS domain protein 2 transcription in vivo. Nucleic Acids Res. 2011;39:4769–4782. doi: 10.1093/nar/gkq1335. [DOI] [PMC free article] [PubMed] [Google Scholar]
- Tucci S, Primassin S, Spiekerkoetter U. Fasting-induced oxidative stress in very long chain acyl-CoA dehydrogenase-deficient mice. Febs J. 2010a;277:4699–4708. doi: 10.1111/j.1742-4658.2010.07876.x. [DOI] [PubMed] [Google Scholar]
- Tucci S, Primassin S, Ter Veld F, Spiekerkoetter U. Medium-chain triglycerides impair lipid metabolism and induce hepatic steatosis in very long-chain acyl-CoA dehydrogenase (VLCAD)-deficient mice. Mol Genet Metab. 2010b;101:40–47. doi: 10.1016/j.ymgme.2010.05.005. [DOI] [PubMed] [Google Scholar]
- Turek FW, Joshu C, Kohsaka A, Lin E, Ivanova G, McDearmon E, Laposky A, Losee-Olson S, Easton A, Jensen DR, et al. Obesity and metabolic syndrome in circadian Clock mutant mice. Science. 2005;308:1043–1045. doi: 10.1126/science.1108750. [DOI] [PMC free article] [PubMed] [Google Scholar]
- Westerterp M, Berbee JF, Delsing DJ, Jong MC, Gijbels MJ, Dahlmans VE, Offerman EH, Romijn JA, Havekes LM, Rensen PC. Apolipoprotein C-I binds free fatty acids and reduces their intracellular esterification. J Lipid Res. 2007;48:1353–1361. doi: 10.1194/jlr.M700024-JLR200. [DOI] [PubMed] [Google Scholar]
- Wijnen H, Young MW. Interplay of circadian clocks and metabolic rhythms. Annu Rev Genet. 2006;40:409–448. doi: 10.1146/annurev.genet.40.110405.090603. [DOI] [PubMed] [Google Scholar]
- Zhou YD, Barnard M, Tian H, Li X, Ring HZ, Francke U, Shelton J, Richardson J, Russell DW, McKnight SL. Molecular characterization of two mammalian bHLH-PAS domain proteins selectively expressed in the central nervous system. Proc Natl Acad Sci U S A. 1997;94:713–718. doi: 10.1073/pnas.94.2.713. [DOI] [PMC free article] [PubMed] [Google Scholar]
Associated Data
This section collects any data citations, data availability statements, or supplementary materials included in this article.