Abstract
Low-grade glial neoplasms (astrocytomas) represent one of the most common brain tumors in the pediatric population. These tumors frequently form in the optic pathway (optic pathway gliomas; OPGs), especially in children with the Neurofibromatosis Type 1 (NF1) inherited tumor predisposition syndrome. To model these tumors in mice, we have previously developed several Nf1 genetically-engineered mouse (GEM) strains that form optic gliomas. However, there are three distinct macroglial cell populations in the optic nerve (astrocytes, NG2+ cells and oligodendrocytes). The presence of NG2+ cells in the optic nerve raises the intriguing possibility that these cells could be the tumor-initiating cells, as has been suggested for adult glioma. In this report, we used a combination of complementary in vitro and novel GEM strains in vivo to determine whether NG2+ cells could give rise to Nf1 optic glioma. First, we show that Nf1 inactivation results in a cell-autonomous increase in GFAP+, but not NG2+, cell proliferation in vitro. Second, similar to the GFAP-Cre transgenic strain that drives Nf1 optic gliomagenesis, NG2-expressing cells also give rise to all three macroglial lineages in vivo. Third, in contrast to the GFAP-Cre strain, Nf1 gene inactivation in NG2+ cells is not sufficient for optic gliomagenesis in vivo. Collectively, these data demonstrate that NG2+ cells are not the cell of origin for mouse optic glioma and support a model in which gliomagenesis requires Nf1 loss in specific neuroglial progenitors during embryogenesis.
Keywords: genetically-engineered mice, NG2, optic glioma, neurofibromatosis type 1
Introduction
Brain tumors are the most common solid tumor in the pediatric population, with low-grade glial neoplasms (pilocytic astrocytoma; PA) representing the major histologic subtype in children between the ages of five and fifteen (Central Brain Tumor Registry of the United States (CBTRUS), 2012; www.cbtrus.org). In contrast to adults, low-grade gliomas tend to arise in distinct brain regions, including the cerebellum, brainstem and optic pathway. This unique geographic predilection is nicely illustrated by the pattern of glioma formation in individuals with the neurofibromatosis type 1 (NF1) inherited tumor syndrome. Fifteen to twenty percent of children with NF1 will develop a low-grade glioma, the majority of which arise in the optic pathway (optic pathway glioma; OPG) (1, 2). These OPGs can arise anywhere along the optic pathway, from the retro-orbital optic nerve to the post-chiasmatic optic tract (3, 4). Most OPGs are slow-growing tumors composed of glial fibrillary acidic protein (GFAP)-immunoreactive cells with low proliferative indices (<1%). While death from these tumors is rare, there is significant associated morbidity, including hypothalamic dysfunction and visual loss. In this regard, nearly half of children with NF1-associated OPGs will have visual impairment at initial presentation (5).
To gain insights into the molecular and cellular pathogenesis of NF1-associated optic glioma, we and others have developed Nf1 GEM strains. Based on their glial histology, Nf1 loss in GFAP-immunoreactive cells has been modeled using GFAP-Cre mouse lines. In these experiments, Nf1+/− mice with GFAP-Cre-mediated Nf1 inactivation develop optic glioma (6, 7). Careful analysis of the GFAP-Cre strains used in these studies has revealed that Cre expression first occurs in GFAP+ neuroglial progenitor cells either at E11.5 (7) or E14.5 (8), rather than in differentiated astrocytes. These findings support a model in which Nf1 loss must occur in specific neuroglial progenitors during embryonic development in order for gliomagenesis to ensue.
In the optic nerve and relevant ventricular (germinal) zones, there are two types of potential neuroglial progenitors, GFAP+ (9, 10) and NG2+ cells (11). This latter population has been shown to represent a potential cell of origin for rat malignant gliomas (12, 13), suggesting that NG2+ progenitors may represent the initiating cell for Nf1 optic glioma. To determine whether NG2+ neuroglial progenitors could serve as the cell of origin for Nf1 GEM optic glioma, we employed a combination of in vitro and in vivo strategies. In this report, we demonstrate that Nf1 loss in NG2+ cells in vitro does not increase glial cell proliferation and that Nf1 loss in NG2+ progenitor cells in vivo is insufficient for optic gliomagenesis. Together, these data exclude NG2+ cells as the likely cell of origin for NF1-associated optic glioma and establish a model of gliomagenesis in which Nf1 loss occurs in specific progenitors during embryonic development.
Results
The mouse optic nerve is composed of three distinct types of macroglial cells
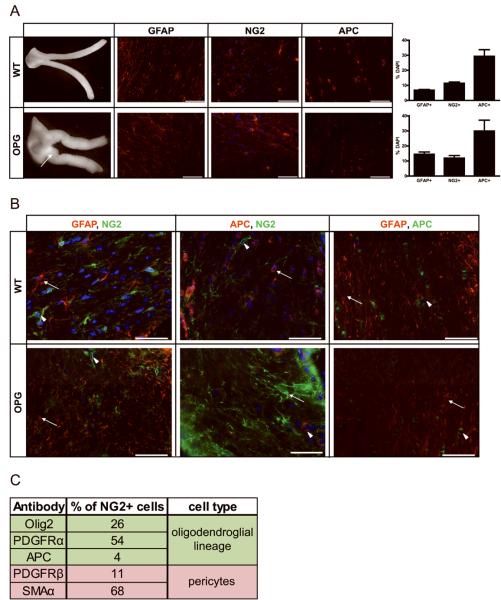
In order to better characterize the macroglial compartment that contributes to optic gliomagenesis, we performed immunostaining with antibodies that recognize glial fibrillary acidic protein (GFAP; astrocytes), nerve/glial antigen 2 (NG2 cells) and adenomatous polyposis coli (APC; oligodendrocytes). We found that the majority of macroglia in both wild-type (WT) and optic glioma-bearing (Nf1flox/mut; GFAP-Cre; OPG-mice) mouse optic nerves are APC+ oligodendrocytes at both 3 weeks and 3 months of age. In contrast, GFAP+ and NG2+ cells compromise a smaller percentage of optic nerve macroglial cells (Fig. 1A and Supplemental Fig. 1). Importantly, upon Nf1 loss, we observed a two-fold increase in the number of GFAP+ astrocytes in the optic nerves of OPG-mice relative to their WT counterparts. The number of NG2+ cells and oligodendrocytes did not change after Nf1 inactivation (Fig. 1A).
Figure 1. Optic nerve astroglial cell populations in wild-type and Nf1 OPG mice.
(A) Nf1flox/mut; GFAP-Cre (OPG) mice develop optic nerve gliomas. Representative images of the optic nerves from 3-month old wild-type (WT) and OPG mice are shown. The arrow denotes an enlarged optic nerve and chiasm in one representative OPG mouse, not seen in WT mice. Histological comparison of cell type-specific markers demonstrates that ~30% of the cells are APC+, 11% of the cells are NG2+ and 7% of the cells are GFAP+. Increased numbers of GFAP-positive astroglial cells are found in the optic nerves of OPG mice compared to WT mice. Each error bar represents mean ± SEM. (B) Double-labeling of 3-month-old WT and OPG nerves shows that these three glial cell populations are distinct. APC/NG2 double-positive cells account for fewer than 5% of the cells in the optic nerve. Representative images are shown. Scale bar, 50μm. DAPI (blue) was used as a counterstain to identify all cells in the sections. (C) NG2 double-labeling experiments revealed that 68% and 11% of the NG2 cells are SMAα+ or PDGFRβ+, respectively (pericyte markers), whereas 26% and 54% of the NG2+ cells are Olig2+ and PDGFRα+, respectively (oligodendroglial lineage markers).
To establish that these macroglia represent distinct cell types, we performed double-labeling immunohistochemistry. In these experiments, there were no GFAP+/APC+ or GFAP+/NG2+ cells, and fewer than 5% of the APC+ cells were NG2-immunopositive (Fig. 1B and 1C). Next, we demonstrated that nearly 100% of GFAP+ cells also co-expressed aldehyde dehydrogenase 1 family, member L1 (ALDH1L1), previously reported as a marker of adult rat astrocytes (14). Similar to the GFAP immunostaining, we did not detect ALDH1L1+/NG2+ double-positive cells (Supplemental Fig. 2).
To better characterize the NG2+ cell population in the optic nerve, we performed additional experiments based on previous studies on NG2+ cells from other brain regions suggesting that NG2+ cells can be either pericytes (15) or oligodendrocyte precursors (OPCs) (16). First, we demonstrated that the majority of NG2+ cells (68%) in the normal optic nerve co-label with smooth muscle actin α (SMAα; pericyte marker), while only 11% co-label with platelet-derived growth factor receptor β (PDGFRβ; pericyte progenitor marker). However, 26% of the NG2+ cells in the normal optic nerve co-labeled with Olig2, while 54% of the NG2+ cells were also PDGFRα+. Few of the NG2+ cells were APC-immunopositive (Figure 1C and Supplemental Fig. 3A). These findings highlight the issues related to confidently assigning a cellular identity to NG2+ cells using available antibodies.
Second, to determine the identity of the NG2+ cells in Nf1flox/mut; GFAP-Cre mouse optic gliomas, we performed NG2 and SMAα double labeling (Supplemental Fig. 3B). Nearly 100% of the NG2+ cells were SMAα-positive. A similar SMAα-staining pattern was also observed in a representative human NF1-associated OPG (Supplemental Fig. 3C); however, NG2/SMAα double-labeling could not be performed in human tissue due to technical limitations of available NG2 antibodies for human tissue.
Third, since pericytes are often clustered around blood vessels, we performed NG2/endoglin double-labeling to determine whether there was preferential clustering of NG2+ cells near endothelial cells in Nf1flox/mut; GFAP-Cre mouse optic gliomas (Supplemental Fig. 3D). In these experiments, we observed a uniform distribution of NG2+ cells in the optic nerve with no preferential association near endoglin+ blood vessels.
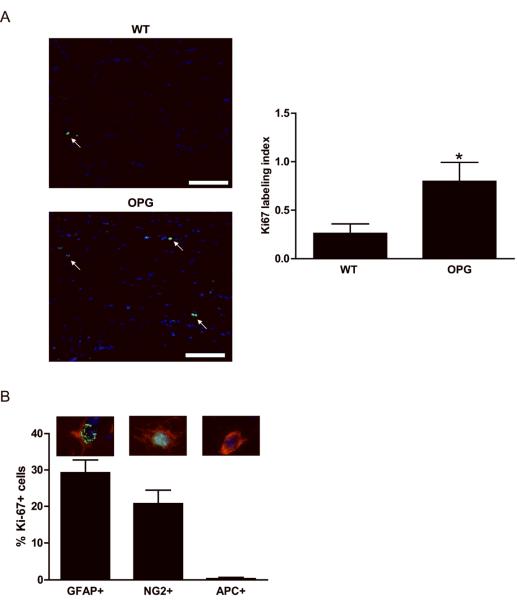
To define the populations of macroglial cells that increase their proliferation following Nf1 gene inactivation in OPG-mice, we performed Ki67 double-labeling experiments. Following GFAP-Cre mediated Nf1 loss, we observed a three-fold increase in cell proliferation (Ki67 labeling index) relative to WT mice (Fig. 2A). To determine which macroglial cells undergo GFAP-Cre mediated Nf1 inactivation, we performed lineage tracing experiments using the Rosa-GREEN reporter strain. We found that all three macroglial cells (APC+ oligodendrocytes, NG2+ glia, and GFAP+ astrocytes) exhibited Cre-mediated enhanced green fluorescent protein (EGFP) expression (Supplemental Fig. 4), and therefore could represent the Nf1-deficient preneoplastic/neoplastic cell population relevant to optic gliomagenesis in mice.
Figure 2. Neurofibromin loss results in increased NG2 and GFAP cell proliferation in vivo.
(A) Proliferation was measured by Ki-67 labeling. Nf1 inactivation results in a three-fold increase in the percent of Ki-67 positive cells (labeling index) in the optic nerves of OPG mice compared to WT mice at 3 months of age. Representative images are shown. Arrows denote representative Ki-67-immunopositive cells. Scale bar, 100μm. (B) The percentages of GFAP/Ki-67, NG2/Ki-67 and APC/Ki-67 cells in the optic nerves of OPG mice at 3 months of age are shown. The images above each bar in the graph depict representative GFAP/Ki-67 double-positive, NG2/Ki-67 double-positive, or APC-positive/Ki-67-negative cells, respectively. Each error bar represents mean ± SEM. Asterisks denote statistically significant differences (*) p= 0.0482.
Based on these findings, to determine which macroglial cell in the murine Nf1 optic gliomas had increased proliferation following Nf1 gene inactivation, double immunofluorescence studies were performed. Consistent with the designation of these tumors as astrocytomas, there were no proliferating APC+ cells (oligodendrocytes). However, both NG2+ and GFAP+ cells exhibited increased proliferation in the optic nerves of OPG-mice relative to littermate controls at 3 months of age (Fig. 2B). Similar results were obtained using ALDH1L1 as an additional astrocyte marker (Supplemental Fig. 5). The small number of proliferating cells in prechiasmatic optic nerve and chiasm of WT mice (<2 Ki67+ cells per specimen) precluded a meaningful comparison. Together, these findings demonstrate that only NG2+ and GFAP+, but not APC+, macroglial cells hyperproliferate following Nf1 loss in OPG mice in vivo.
Only GFAP+ optic nerve astrocytes exhibit increased proliferation in response to Nf1 inactivation in vitro
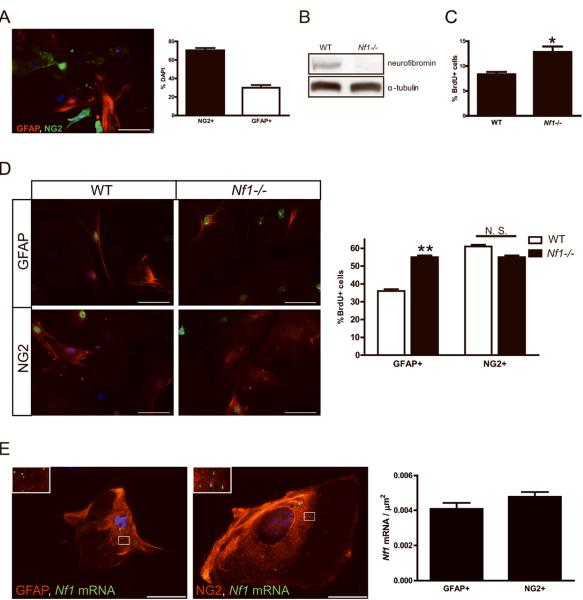
Previous studies from our laboratory revealed that astrocyte cultures from the optic nerve are cellularly- and molecularly-distinct macroglial cell populations (11). Whereas primary postnatal (PN) day 1 astrocyte cultures from the brainstem, neocortex, and cerebellum are composed of >98% GFAP+ cells with fewer than 5% NG2+ cells, optic nerve astrocyte cultures under the identical in vitro conditions are composed of ~30% GFAP+ and ~70% NG2+ cells (Fig. 3A). Similar to macroglial cells in the intact mouse optic nerve, there were no glial cells expressing both GFAP and NG2. Under these culture conditions, no O4+ oligodendrocytes were generated.
Figure 3. Neurofibromin loss results in increased optic nerve GFAP+ cell proliferation in vitro.
(A) Double-labeling immunocytochemistry reveals that 30% of the cells in optic nerve glial cell cultures are GFAP+, while 70% of the cells are NG2+. There are no GFAP/NG2 double-positive cells. Following Nf1 inactivation by Ad5-Cre expression, loss of neurofibromin expression was observed (B) coincident with an increase in proliferating (BrdU+) cells (C). α-tubulin is used as an internal control for protein loading. (D) Following Nf1 inactivation by Ad5-Cre expression, only the GFAP+ population of cells exhibited increased proliferation. Representative BrdU+ proliferating cells (green) and DAPI+ nuclei (blue) are shown. The percentage of BrdU+/NG2+ and BrdU+/GFAP+ cells are represented as the mean ± SEM. Scale bar, 100μm. N. S. = not significant, (**) p= 0.0055, (*) p= 0.0129. (E) FISH revealed comparable levels of Nf1 mRNA expression (green particles; inset) in GFAP+ and NG2+ cells. The number of signals is the average of 10 counted cells per area and is displayed in the graph. Nuclei were counterstained with DAPI (blue). Representative images are shown. Scale bar, 50μm.
To determine which glial cell population had the capacity to hyperproliferate in response to Nf1 gene inactivation, PN1 Nf1flox/flox optic nerve astroglial cultures were generated (passage 0) and infected with either Ad5-Cre or Ad5-LacZ virus to generate Nf1-deficient (Nf1-/-) and WT astroglial cells (passage 2), respectively. Following Cre-mediated Nf1 inactivation, neurofibromin was undetectable in these cultures (Fig. 3B) concomitant with an overall 1.5-fold increase in proliferation (Fig. 3C). Whereas Nf1 loss resulted in a ~1.5-fold increase in proliferation of GFAP+ cells, no increased proliferation was observed in the NG2+ cell population relative to Ad5-LacZ-infected cultures (Fig. 3D). It is possible that differences in Nf1 gene expression underlie the failure of NG2+ cells to increase their proliferation following Nf1 loss. To determine whether NG2+ and GFAP+ cells have different relative levels of Nf1 mRNA expression, we employed Nf1 RNA fluorescence in situ hybridization. In these experiments, GFAP+ cells and NG2+ cells had comparable levels of Nf1 mRNA expression (Fig. 3E). Collectively, these results demonstrate that GFAP+ astrocytes are the macroglial population with the greatest ability to hyperproliferate following neurofibromin loss in vitro.
NG2+ cells give rise to oligodendrocytes and astrocytes in vivo
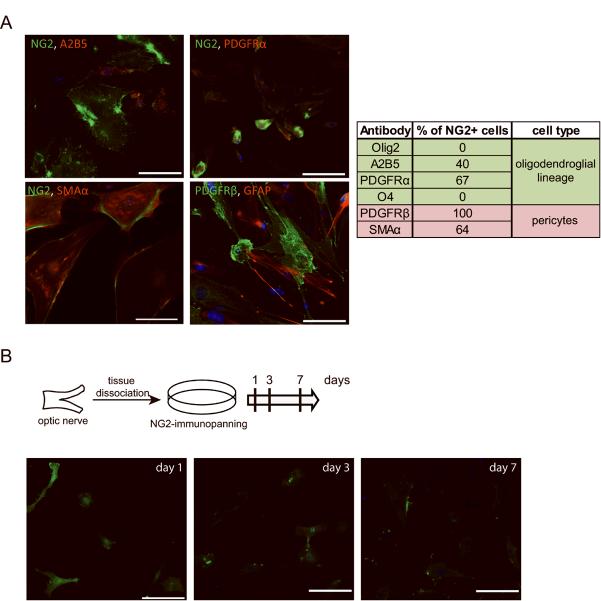
To further analyze the NG2+ cell population in mouse optic nerve glial cell cultures, we performed several additional experiments. First, we used double-labeling immunofluorescence to demonstrate that nearly all NG2+ cells co-label with PDGFRβ, while 64% of the NG2+ cells are SMAα-positive (pericyte markers). Moreover, 40% and 67% of the NG2+ cells are double-positive for A2B5 and PDGFRα, respectively (OPC markers) (Fig. 4A). Second, to determine the capacity of these NG2+ cells to differentiate into distinct glial cell populations, we employed immunopanning to obtain highly purified NG2+ cells from the optic nerve. This purified NG2+ cell population remained 100% NG2+ after one day in culture, without any contaminating GFAP+ astrocytes or O4+ oligodendrocytes, but did not generate either O4+ or GFAP+ cells under either serum or serum-free conditions after 3 and 7 days in culture (Fig. 4B). These findings again underscore the problems associated with confidently distinguishing NG2+ cell populations using cell type-specific antibodies, and demonstrate that NG2+ optic nerve cells are unlikely to be glial progenitors in vitro.
Figure 4. Characterization of NG2+ optic nerve cells in vitro.
(A) 64% of the NG2 cells are double-positive for SMAα and almost all are PDGFRβ+ (pericyte markers). None of the GFAP-positive cells are SMAα-positive or PDGFRβ-positive. In contrast, 40% and 67% of the NG2+ cells are A2B5+ or PDGFRα+, respectively (oligodendroglial lineage markers). (B) Following NG2 antibody immunopanning and replating, PN1 optic nerve NG2+ cells grown for 1, 3 and 7 days do not differentiate into either GFAP+ or O4+ cells in vitro. Nuclei were counterstained with DAPI (blue). Representative images are shown. Scale bar, 100μm.
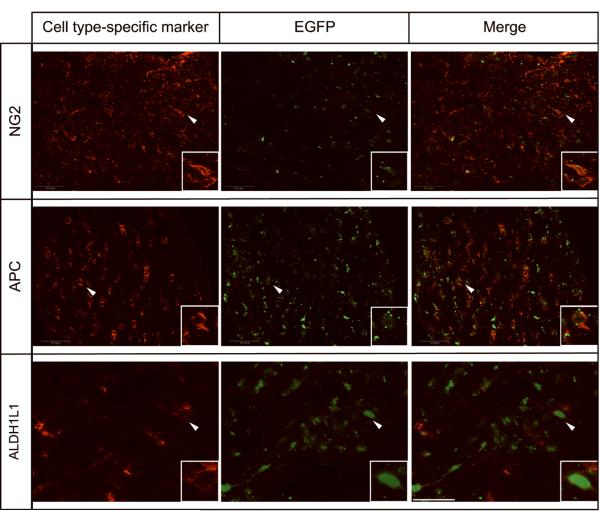
Third, to determine whether NG2+ cells could give rise to the three major macroglial populations in the optic nerve as has been reported for the forebrain (17), we leveraged a mouse strain in which Cre recombinase is expressed from the endogenous NG2 promoter (17). NG2-Cre mice were crossed with Rosa-GREEN reporter mice, and at 3 weeks of age, we detected EGFP expression in NG2+, APC+ and ALDH1L1+ cells (Fig. 5), similar to that observed with the GFAP-Cre strain used to generate Nf1 optic gliomas (Supplemental Fig. 4). Similar to the in vitro findings, we also found SMAα+ cells with NG2-mediated EGFP expression in the optic nerve (Supplemental Fig. 6A). Since A2B5 cannot be employed for immunohistochemistry, we derived optic nerve cultures from Rosa-GREEN × NG2-Cre mice to demonstrate that NG2+ cells can give rise to A2B5+ cells in the optic nerve (Supplemental Fig. 6B). Collectively, these results demonstrate that NG2+ cells give rise to all macroglial cell lineages in vivo.
Figure 5. NG2-Cre cells give rise to NG2+, ALDH1L1+, and APC+ glial cell populations in vivo.
Optic nerve sections from Rosa-GREEN × NG2-Cre mice reveal EGFP+/NG2+ cells, EGFP+/APC+ (oligodendrocytes) and EGFP+/ALDH1L1+ (astrocytes). Scale bar, 50μm. Representative images are shown with insets of immunopositive cells.
Nf1flox/mut; NG2-Cre mice do not develop optic glioma
To determine whether Nf1 loss in NG2+ progenitor cells is sufficient for optic gliomagenesis in mice, we generated Nf1+/− mice with NG2-specific Nf1 inactivation. This genetic configuration is similar to the Nf1 optic glioma mice in which Nf1+/− mice harbor neurofibromin loss in GFAP+ cells (6). Cohorts of ten Nf1flox/mut; NG2-Cre mice and ten control littermates (NG2-Cre and Nf1flox/wt; NG2-Cre mice; n=10 each) were collected. These mice were healthy and bred successfully.
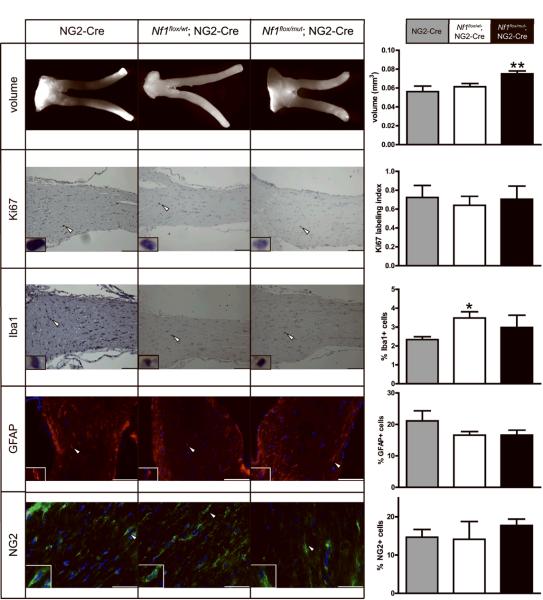
Analysis of the optic nerves from Nf1flox/mut; NG2-Cre mice revealed no evidence of optic glioma formation at 3 months of age. Specifically, we observed no gross morphological or histological differences and only a slight increase in optic nerve volume. There was no change in mitotic indices, microglia numbers, GFAP+ astrocyte numbers or NG2+ glial cell numbers (Fig. 6). Moreover, no optic gliomas were observed using the above criteria in a cohort of Nf1flox/mut; NG2-Cre mice at 6 months of age (data not shown; n=7).
Figure 6. Nf1flox/mut; NG2-Cre mice do not develop optic glioma.
Representative images of the optic nerves from all three genotypes are shown. Nf1flox/mut; NG2-Cre mice optic nerve volumes are slightly increased relative to control (NG2-Cre and Nf1flox/wt; NG2-Cre) mice. However, no increases in the Ki67 labeling index, percent of Iba1+ microglia, or percent of GFAP+ or NG2+ cells were found in Nf1flox/mut; NG2-Cre mice relative to control mice. Scale bar, 100μm; 50μm NG2 panel. Error bars represent mean ± SEM. Asterisks denote statistically significant differences (*) p= 0.0119, (**) p< 0.0052.
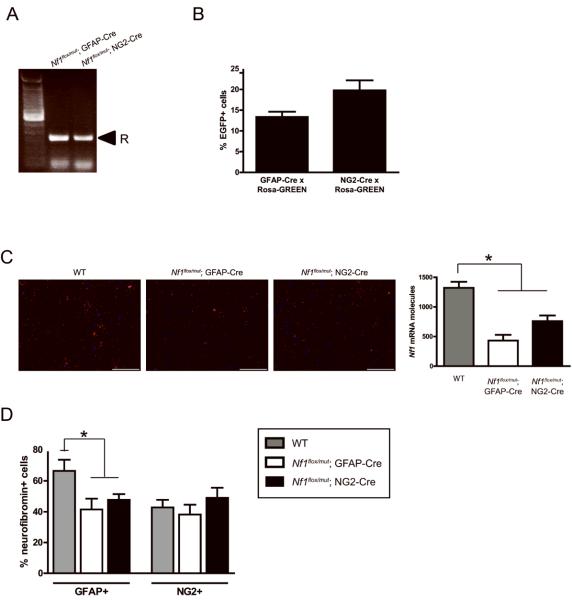
The failure to generate optic gliomas in Nf1flox/mut; NG2-Cre mice could reflect a number of possibilities, including the efficiency of Cre-mediated recombination as well as the timing and specific cell type in which Nf1 loss occurs. To demonstrate Nf1 inactivation in the optic nerve, we first employed recombination PCR on whole tissue (Fig. 7A). Both Nf1flox/mut; NG2-Cre and Nf1flox/mut; GFAP-Cre mouse optic nerves exhibited Nf1 gene inactivation. Second, we employed the Rosa-GREEN reporter mice to show that both NG2-Cre and GFAP-Cre mouse optic nerves had equivalent numbers of EGFP+ cells, indicative of Cre-mediated excision (Fig. 7B). Third, we used RNA fluorescence in situ hybridization (FISH) to measure Nf1 mRNA expression Nf1flox/mut; NG2-Cre and Nf1flox/mut; GFAP-Cre mouse optic nerves. There was a similar reduction in total Nf1 mRNA expression in these mice relative to their WT counterparts (42% decrease in Nf1flox/mut; NG2-Cre and 67% decrease in Nf1flox/mut; GFAP-Cre mouse optic nerves) (Fig. 7C). Since we could not confidently localize the Nf1 mRNA FISH signal to a specific cell type by double-labeling immunofluorescence, we performed GFAP/neurofibromin and NG2/neurofibromin double labeling. In optic nerve specimens from both Nf1flox/mut; NG2-Cre and Nf1flox/mut; GFAP-Cre mice, there was a 30-37% reduction in the percent of GFAP/neurofibromin double-positive cells relative to WT mice, with no change in the percent of NG2/neurofibromin double-positive cells (Fig. 7D and Supplemental Figure 7). These data exclude differences in Nf1 gene expression or inactivation as the likely reason for the failure of Nf1flox/mut; NG2-Cre mice to develop optic glioma.
Figure 7. Nf1 inactivation is observed in Nf1flox/mut; NG2-Cre mice.
(A) Recombination PCR demonstrates Cre-mediated Nf1 gene recombination (R) in both Nf1flox/mut; GFAP-Cre mice and Nf1flox/mut; NG2-Cre mice. (B) The efficiency of Cre-mediated recombination was determined following intercrossing of GFAP-Cre and NG2-Cre with Rosa-GREEN reporter mice. The percent of EGFP+ cells relative to the total number of cells in Rosa-GREEN × GFAP-Cre mice (13%) is similar to that observed in Rosa-GREEN × NG2-Cre mice (20%). (C) FISH analysis reveals similar reductions in Nf1 mRNA (red) expression in the optic nerves of Nf1flox/mut; GFAP-Cre mice (67%) and Nf1flox/mut; NG2-Cre mice (42%) compared to WT mice. Nuclei were counterstained with DAPI (blue). Representative images are shown. Scale bar, 50μm. (D) Nf1 deletion in Nf1flox/mut; NG2-Cre mice was determined by GFAP/neurofibromin and NG2/neurofibromin double-labeling using Nf1flox/flox mice as controls. Similar to Nf1flox/mut; GFAP-Cre mice with optic glioma, Nf1flox/mut; NG2-Cre mouse optic nerves exhibit a 30% reduction in the percentage of GFAP/neurofibromin double-positive cells. No change in the percent of NG2/neurofibromin double-positive was observed in Nf1flox/mut; NG2-Cre mice or Nf1flox/mut; GFAP-Cre mouse optic nerves. Each error bar represents mean ± SEM. Asterisks denote statistically significant differences (*) p= 0.044.
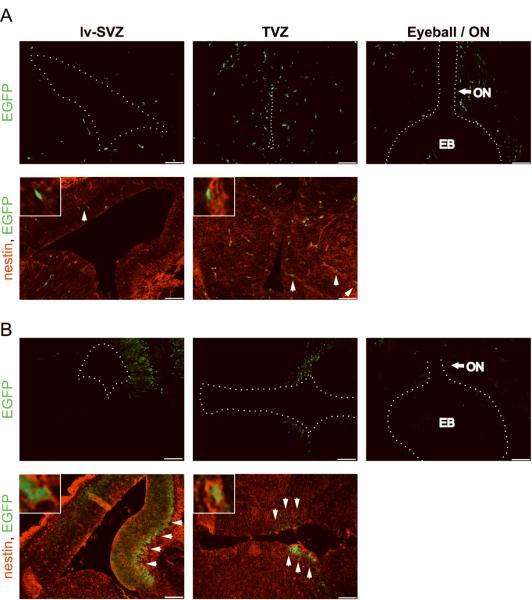
Next, to determine when and where the NG2-Cre transgene is first expressed relative to the GFAP-Cre transgene used to generate Nf1 optic glioma mice, NG2-Cre and GFAP-Cre mice were crossed to Rosa-GREEN reporter mice and their brains examined at various developmental times. In these experiments, Cre activity was first detected in the third (TVZ) and lateral ventricular zones (lv-SVZ) at embryonic day 14.5 (Fig. 8A), similar to the GFAP-Cre mouse strain (Fig. 8B), excluding differences in the timing of Nf1 loss.
Figure 8. NG2-Cre is first expressed at E14.5 in cells in the third and lateral ventricles.
(A) NG2-Cre- and (B) GFAP-Cre-mediated EGFP expression is first detected by embryonic day E14.5 in the lateral (lv-SVZ; dotted line) and third ventricle (TVZ; dotted line) of (A) Rosa-GREEN × NG2-Cre and (B) Rosa-GREEN × GFAP-Cre mice, respectively. Nestin/EGFP double-positive cells in Rosa-GREEN × NG2-Cre mice are randomly scattered in the areas around the lv-SVZ and TVZ, whereas nestin/EGFP double-positive cells in Rosa-GREEN × GFAP-Cre mice are preferentially localized to the TVZ, but not to the lv-SVZ, periventricular region. Representative images are shown with insets of immunopositive cells. Scale bar, 100μm. EB = eye ball, ON = optic nerve.
Finally, we sought to determine where the NG2-Cre transgene was expressed in the lateral and third ventricle germinal zones in vivo. While both NG2-Cre and GFAP-Cre mice generate EGFP+/nestin+ cells, the EGFP+/nestin+ cells in the NG2-Cre strain were not preferentially localized to the periventricular areas around the lv-SVZ and TVZ (Fig. 8A). Moreover, there were EGFP+/PDGFRα+ and EGFP+/PDGFRβ+ cells similarly distributed throughout the TVZ (Supplemental Fig. 6C). In contrast, EGFP+/nestin+ cells in the GFAP-Cre mouse were preferentially localized to the periventricular zones along the wall of the third ventricle (Fig. 8B), consistent with their designation as potential neural stem cells relevant to optic glioma (18). Collectively, these findings argue that NG2+ progenitor cells are not identical to GFAP-Cre optic glioma progenitors with respect to their ventricular location, and support a model in which Nf1 inactivation likely occurs in specific progenitors (GFAP-Cre-expressing stem cells) to result in optic gliomagenesis.
Discussion
Numerous studies have shown that oligodendrocytes, astrocytes, and NG2+ cells comprise the three types of macroglial cells in the mammalian central nervous system. In most brain regions, astrocytes are the major macroglial cell population, whereas NG2-glia comprise 8-9% of the total cell population in white matter regions, and 2-3% of the total cells in grey matter regions (19). Relevant to low-grade gliomas in children, similar macroglial cell populations exist in the optic nerve. The optic nerve is a heavily myelinated structure composed of axons carrying visual information from the retina to the lateral geniculate bodies. For this reason, oligodendrocytes constitute the majority of the macroglial cells in the optic nerve.
However, optic gliomas are not oligodendroglial neoplasms (oligodendrogliomas), and are instead composed of GFAP-immunoreactive cells. Consistent with observations in human tumors, we found that the majority of the proliferating cells in the Nf1 mouse optic glioma were GFAP+ or NG2+ cells, rather than APC+ cells (oligodendrocytes). In addition, we found that glial cell cultures from the normal optic nerve were composed of two distinct non-oligodendrocyte cell types that express either NG2 or GFAP, but not both markers (11), analogous to studies performed on cells from other regions of the central nervous system. For this reason, we focused on the relative contributions of GFAP+ and NG2+ cells to Nf1 murine optic gliomagenesis.
Early landmark studies examining rat optic nerve glia revealed two types of astrocytes (type-1 and type-2) (20). In contrast to type-1 astrocytes, type-2 astrocytes are defined by A2B5 expression (20, 21) and are thought to arise from A2B5+, but GFAP- and galactocerebrosidase-negative, oligodendrocyte-type-2 astrocyte (O-2A) precursor cells (20-22). Unfortunately, A2B5+ cells cannot be reliably detected in vivo due to antibody technical limitations. Based on the fact that some rat optic nerve NG2+ cells co-express A2B5 and are capable of generating GFAP+ astrocytes (23) and A2B5+ cells (24) in vitro, it has been postulated that a population of NG2+ cells+ may serve as O2A progenitors. The progenitor properties of NG2+ cells is reinforced by studies in the spinal cord in which some NG2+ cells express nestin or A2B5 and can give rise to oligodendrocytes and astrocytes (25, 26). Additionally, embryonic mouse forebrain neurospheres contain a small population of NG2/A2B5 double-positive cells (27). However, using NG2-Cre mice, none of the GFAP+ cells originated from NG2+ cells in white matter regions in vivo (17).
In support of a role for NG2+ cells as glial progenitors in the optic nerve, we found that 40% of the NG2+ cells in the mouse optic nerve express A2B5 in vitro, and that NG2+ cells give rise to astrocytes in vivo. Moreover, we found that 26% and 54% of the NG2+ cells in the optic nerve co-express either Olig2 or PDGFRα, respectively, markers of glial progenitor cells. The ability of NG2+ cells to function as progenitors for astrocytes in some regions of the central nervous system (optic nerve, spinal cord), but not in other locations (white matter regions), highlights the innate heterogeneity of this population of cells.
NG2 has also been shown to label pericytes, which function as vital integrators of the neurovascular unit and coordinate a variety of homeostatic functions, including angiogenesis, blood-brain-barrier integrity, and clearance of toxic cellular byproducts (28). To determine whether the NG2+ cells in the optic nerve were pericytes, we performed double-labeling experiments using two different pericyte markers (SMAα and PDGFRβ). Interestingly, NG2+ cells in the optic nerve and brain co-label with both of these markers. Consistent with this finding, our previous microarray studies similarly revealed increased expression of PDGFRβ in glial cell cultures from the optic nerve compared to other brain region primary astrocyte populations (11). In addition, we found that some of the NG2+ cells in the optic nerve were in close proximity to blood vessels, while others were uniformly distributed within the parenchyma. The fact that NG2+ cells express markers associated with pericytes as well as glial precursors highlights the difficulties associated with the use of currently available antibodies to distinguish between these NG2+ cell populations.
Support for the notion that NG2+ cells are potential glioma progenitor cells derives from immunohistochemical experiments demonstrating increased NG2 expression in invasive mouse glioma (29) and in the actively proliferating population of human high-grade glioma (30), correlating with increasing glioma malignancy grade (31). Similarly, we found robust SMAα immunolabeling in one representative NF1-associated optic glioma. Second, retroviral PDGF-induced rat gliomas arising in the spinal cord (32) and brainstem (13) contain a highly proliferative population of NG2+ progenitor cells. Third, overexpression of NG2 in mouse glioblastoma multiforme increases glioma growth, whereas NG2 knockdown decreases glioma growth in vivo (33). Fourth, A2B5+/CD133-cells freshly isolated from human high-grade gliomas form tumors when injected into immunocompromised nu/nu mice (34, 35). Fifth, introducing p53/Nf1 mutations directly into OPCs cause malignant gliomas in adult mice (36). These latter experiments were performed using the mosaic analysis with double markers (MADM) approach, and revealed that high-grade gliomas arose in 8-month-old mice following the inactivation of both the Nf1 and p53 genes in lateral ventricle SVZ (lv-SVZ) OPCs. Similar to elegant studies by the Parada laboratory using mice with conditional Nf1, p53, and Pten inactivation (37), SVZ progenitors serve as the putative cells of origin for malignant glioma in adult mice. In contrast to these adult malignant glioma studies, we have recently shown that low-grade Nf1 mouse optic gliomas likely arise from third ventricle progenitors, rather than lv-SVZ progenitors, during embryogenesis (18). Consistent with this unique progenitor origin, Nf1 loss in TVZ neural stem cells (NSCs) resulted in increased proliferation and glial differentiation, whereas Nf1 loss in lv-SVZ NSCs did not.
To experimentally define the role of NG2+ cells in Nf1 optic gliomagenesis, we employed a complementary series of in vitro and in vivo approaches. We initially demonstrated that NG2+ cells constitute a significant fraction of the non-oligodendrocyte glial cells in the normal optic nerve as well as in Nf1 optic glioma. In the optic nerve, NG2+ cells represent a distinct population of glial cells in vivo and in vitro, lacking GFAP expression. Upon acute Nf1 gene inactivation in vitro, NG2+ cells did not exhibit an increase in proliferation, whereas increased proliferation was observed in the GFAP+ glial cell population. Next, we showed that NG2+ cells from NG2-Cre mice in which Cre recombinase is expressed from the endogenous NG2 promoter can give rise to GFAP+ cells in the optic nerve in vivo. Similar to GFAP-Cre-driven Nf1 inactivation, we found that NG2-Cre-driven Nf1 inactivation resulted in reduced neurofibromin expression in GFAP+ cells in the optic nerve; however, in striking contrast to Nf1flox/mut; GFAP-Cre mice, Nf1+/− mice in which Nf1 loss occurs in NG2+ cells (Nf1flox/mut; NG2-Cre mice) do not form optic gliomas at 3 or 6 months of age in vivo. Further experiments are needed to clarify why the NG2+ cells in the Nf1flox/mut; NG2-Cre and Nf1flox/mut; GFAP-Cre mouse optic nerves retain Nf1 expression despite deriving from NG2-Cre- and GFAP-Cre-expressing progenitor cells.
The absence of optic gliomagenesis could reflect several differences between the GFAP-Cre and NG2-Cre mice used for these experiments. First, it is possible that NG2-Cre mice exhibit less efficient Cre-mediated Nf1 inactivation. This possibility was excluded using Rosa-GREEN reporter mice, in which the percentage of cells with Cre-mediated excision is actually slightly higher than that observed in GFAP-Cre mice. Moreover, optic nerves from both Nf1flox/mut; GFAP-Cre and Nf1flox/mut; NG2-Cre mice exhibited similar levels of Nf1 inactivation as assessed by recombination PCR as well as RNA fluorescence in situ hybridization. Second, optic nerve astrocytes might not arise from NG2+ progenitors. However, we showed that both GFAP-Cre and NG2-Cre mice are capable of generating astrocytes in the optic nerve. Third, it is possible that Cre-mediated Nf1 loss occurs at the wrong time point for glioma formation. Recent studies from our laboratory have shown that gliomas are only formed in Nf1+/− mice when Nf1 gene loss occurs during embryogenesis (18). Since NG2-Cre mediated recombination begins at E14.5, similar to GFAP-Cre mice, it is unlikely that temporal differences account for the lack of optic gliomas in Nf1flox/mut; NG2-Cre mice.
Fourth, it is possible that NG2+ cells are not located in a progenitor zone relevant to optic gliomagenesis. Recent studies from our laboratory have shown that Nf1 murine optic gliomas likely arise from progenitor cells lining the third ventricle, rather than the lateral ventricle (18). This ventricular zone has previously been shown to contain the progenitor cells that give rise to optic nerve oligodendrocyte precursors (38, 39). In addition, a recent gene expression study using human optic glioma specimen supported the third ventricle as likely germinal zone of origin for these tumors (40). We have previously shown in both human and mice that the third ventricle contains nestin+ radial glia-like cells (9), analogous to type B cells important for gliomagenesis in adult malignant glioma (10, 41-43). In this report, we demonstrate, using a Rosa-GREEN reporter mouse strain, that unlike the GFAP-Cre strain used to generate Nf1 murine optic gliomas, the EGFP+/nestin+ cells from NG2-Cre mice were not preferentially localized to the periventricular zone of the third ventricle.
This intriguing difference suggests that the failure of Nf1flox/mut; NG2-Cre mice to develop optic glioma may reflect the requirement for a specific population of susceptible progenitor cells (potential tumor-initiating cells) within the third ventricle germinal zone to expand following Nf1 inactivation and generate these common low-grade brain tumors in children.
Material and Methods
Mice
Nf1flox/flox (wild-type; WT) (44) and Nf1flox/mut; GFAP-Cre (6) mice were generated as previously described. For cell fate mapping experiments, NG2-Cre mice (B6;FVB-Tg(Cspg4-cre)1Akik/J; Jackson Laboratory; (17)) and GFAP-Cre mice (8) were intercrossed with Rosa-GREEN (B6.Cg-Gt(ROSA)26Sortm(CAGZsGreen1)Hze+/J; Jackson Laboratory) reporter mice (45), respectively. To establish Nf1+/− background mice with NG2-specific Nf1 inactivation, Nf1+/− mice (46) were bred with Nf1f/wt mice to produce Nf1flox/mut mice, which were subsequently intercrossed with Nf1flox/flox; NG2-Cre mice to generate Nf1flox/mut; NG2-Cre mice. Nf1flox/wt; NG2-Cre mice were generated by crossing Nf1flox/flox mice with NG2-Cre mice. All mice were maintained on a C57Bl/6 background and used in accordance with approved animal studies protocols at the Washington University School of Medicine.
Primary astrocyte cultures
Primary astrocyte cultures were established from the optic nerves of postnatal (PN) day 1-2 Nf1flox/flox pups (11). WT and Nf1-deficient (Nf1-/-) cultures were generated following infection with Adenovirus type 5 containing β-galactosidase (Ad5-LacZ) or Cre recombinase (Ad5-Cre) (University of Iowa Gene Transfer Vector Core, Iowa City, IA), respectively. Neurofibromin loss was confirmed by Western blot.
Cell proliferation
Approximately 50 000 astroglial cells were plated in 24-well dishes, allowed to adhere, and maintained in astrocyte growth medium for 24hrs before exposure to the thymidine analogue BrdU (5mM) for 4hrs.
NG2 immunopanning
Cell selection was based on the “panning” technique described by Stallcup and Beasley (23). Briefly, optic nerves were removed from decapitated PN1-2 pups and incubated for 30min at 37°C in 2ml HEPES-buffered DMEM containing 1mg/ml collagenase (Sigma, St. Louis, MO). Following extensive washing, the dissociated optic nerve cells were subjected to immunopanning on six-well dishes precoated with 10μg/ml NG2 monoclonal antibodies for 30-45min (Santa Cruz Biotechnology, Santa Cruz, CA). Unbound cells were removed and cultured independently for comparison with bound cells. Bound cells were subsequently detached from the dishes by scraping. All cells were washed once and plated in cell culture plates. For the differentiation assay, cells were grown for 1, 3 or 7 days in astrocyte growth medium.
Immunocytochemistry
Astrocytes were fixed in 4% paraformaldehyde and permeabilized with 0.2% Triton X-100. Following overnight incubation with primary antibodies (Supplemental Table 1), visualization was accomplished after incubation with either Alexa Fluor 488 or 568 IgG or IgM secondary antibodies (Invitrogen). Cells were counterstained with DAPI. To detect BrdU incorporation, cells were treated with 2M HCl to denature DNA followed by overnight incubation with monoclonal anti-BrdU antibodies (1:200). For each independent culture, at least 5 distinct microscopic fields were analyzed on a Nikon Eclipse TE300 fluorescence inverted microscope (Tokyo, Japan) equipped with an optical camera (Optronics, Goleta, CA) and MetaMorph® image analysis software (Molecular Devices, Dowingtown, PA).
Immunohistochemistry
For immunohistochemistry on paraffin sections, horseradish peroxidase-conjugated secondary antibodies (Vector Laboratories, Burlingame, CA) were used in combination with Vectastain Elite ABC development and hematoxylin counterstaining. For immunofluorescence detection, appropriate Alexa-Flour tagged secondary antibodies (Invitrogen) were used, followed by DAPI counterstaining.
RNA In Situ Hybridization
Fluorescence in situ hybridization (FISH) was performed using the QuantiGene ViewRNA kit (Affymetrix Inc., Frederick, MD) according to the manufacturer’s instructions with minor modifications. The Proteinase K treatment was omitted in order to preserve the integrity of the glial cells. The oligonucleotide probe was designed commercially using the murine Nf1 sequence (accession number NM_010897.2). Following in situ hybridization, cells were incubated in blocking buffer (10% goat serum in 0.3% PBS-Triton X-100) for 1hr, and subsequently processed for immunofluorescence using standard methods. Images were obtained with a Nikon Eclipse TE300 fluorescence inverted microscope (Tokyo, Japan) and analyzed using MetaMorph® image analysis software (Molecular Devices, Dowingtown, PA). Briefly, cell areas were measured by tracing the cell body, so that the cell body size would not affect the measurements. The Nf1 mRNA punctae in the cell body were counted and mRNA molecules per area were calculated. For in situ hybridization in tissue, the conditions were optimized to include a 10min boiling and a 10min protease treatment.
Western immunoblotting
Cells were lysed in 1% NP-40 lysis buffer, supplemented with protease and phosphatase inhibitors, and protein concentrations determined using the BCA protein assay (Pierce). Following SDS-PAGE separation and Western blotting, neurofibromin expression was detected using rabbit anti-NF1GRP-D antibodies (1:200 dilution; Santa Cruz Biotechnology, Santa Cruz, CA). Detection was accomplished by enhanced chemiluminescence using the ChemiDoc-It Imaging System (UVP, Upland, CA). α-tubulin (Sigma, St. Louis, MO) served as an internal control for protein loading and densitometric normalization.
Optic nerve measurements
Optic nerves with an intact chiasm were microdissected, photographed, and optic nerve diameters measured at the chiasm and at ~200 and ~400 and ~600 microns anterior to the chiasm to generate volumes as previously reported (47).
Statistical analysis
All in vitro experiments were repeated at least three times with similar results. Statistical analysis was performed using GraphPad Prism 4.0 software (GraphPad, La Jolla, CA). Data are presented as mean values with standard errors of the mean (SEM). Statistical significance was assessed by using student’s two-tailed t-test. Grubbs outlier test was used to determine statistical outliers. Statistical significance was set at p less than 0.05.
Supplementary Material
Acknowledgements
We appreciate the excellent technical assistance of Angela Petti and Belinda McMahan in the Ophthalmology Core Facility for preparing the optic nerve sections. This work was funded by a grant from the National Cancer Institute (U01-CA141549 to DHG), while the Ophthalmology Core Facility is funded by a grant from the National Eye Institute (EY02687).
Financial support: This work was supported by a grant from the National Cancer Institute (U01-CA141549 to DHG), while the Ophthalmology Core Facility is funded by a grant from the National Eye Institute (EY02687).
Footnotes
Conflict of interest. The authors declare no conflict of interest.
Supplementary Information accompanies the paper on the Oncogene website (http://www.nature.com/onc).
References
- 1.Blazo MA, Lewis RA, Chintagumpala MM, Frazier M, McCluggage C, Plon SE. Outcomes of systematic screening for optic pathway tumors in children with Neurofibromatosis Type 1. Am J Med Genet A. 2004 Jun 15;127A(3):224–9. doi: 10.1002/ajmg.a.20650. [DOI] [PubMed] [Google Scholar]
- 2.Lund AM, Skovby F. Optic gliomas in children with neurofibromatosis type 1. Eur J Pediatr. 1991 Oct;150(12):835–8. doi: 10.1007/BF01955002. [DOI] [PubMed] [Google Scholar]
- 3.Listernick R, Darling C, Greenwald M, Strauss L, Charrow J. Optic pathway tumors in children: the effect of neurofibromatosis type 1 on clinical manifestations and natural history. J Pediatr. 1995 Nov;127(5):718–22. doi: 10.1016/s0022-3476(95)70159-1. [DOI] [PubMed] [Google Scholar]
- 4.Czyzyk E, Jozwiak S, Roszkowski M, Schwartz RA. Optic pathway gliomas in children with and without neurofibromatosis 1. J Child Neurol. 2003 Jul;18(7):471–8. doi: 10.1177/08830738030180070401. [DOI] [PubMed] [Google Scholar]
- 5.Listernick R, Louis DN, Packer RJ, Gutmann DH. Optic pathway gliomas in children with neurofibromatosis 1: consensus statement from the NF1 Optic Pathway Glioma Task Force. Ann Neurol. 1997 Feb;41(2):143–9. doi: 10.1002/ana.410410204. [DOI] [PubMed] [Google Scholar]
- 6.Bajenaru ML, Hernandez MR, Perry A, Zhu Y, Parada LF, Garbow JR, et al. Optic nerve glioma in mice requires astrocyte Nf1 gene inactivation and Nf1 brain heterozygosity. Cancer Res. 2003 Dec 15;63(24):8573–7. [PubMed] [Google Scholar]
- 7.Zhu Y, Harada T, Liu L, Lush ME, Guignard F, Harada C, et al. Inactivation of NF1 in CNS causes increased glial progenitor proliferation and optic glioma formation. Development. 2005 Dec;132(24):5577–88. doi: 10.1242/dev.02162. [DOI] [PMC free article] [PubMed] [Google Scholar]
- 8.Bajenaru ML, Zhu Y, Hedrick NM, Donahoe J, Parada LF, Gutmann DH. Astrocyte-specific inactivation of the neurofibromatosis 1 gene (NF1) is insufficient for astrocytoma formation. Mol Cell Biol. 2002 Jul;22(14):5100–13. doi: 10.1128/MCB.22.14.5100-5113.2002. [DOI] [PMC free article] [PubMed] [Google Scholar]
- 9.Dahiya S, Lee da Y, Gutmann DH. Comparative characterization of the human and mouse third ventricle germinal zones. J Neuropathol Exp Neurol. 2011 Jul;70(7):622–33. doi: 10.1097/NEN.0b013e31822200aa. [DOI] [PMC free article] [PubMed] [Google Scholar]
- 10.Doetsch F, Garcia-Verdugo JM, Alvarez-Buylla A. Regeneration of a germinal layer in the adult mammalian brain. Proc Natl Acad Sci U S A. 1999 Sep;2896(20):11619–24. doi: 10.1073/pnas.96.20.11619. [DOI] [PMC free article] [PubMed] [Google Scholar]
- 11.Yeh TH, Lee da Y, Gianino SM, Gutmann DH. Microarray analyses reveal regional astrocyte heterogeneity with implications for neurofibromatosis type 1 (NF1)-regulated glial proliferation. Glia. 2009 Aug 15;57(11):1239–49. doi: 10.1002/glia.20845. [DOI] [PMC free article] [PubMed] [Google Scholar]
- 12.Assanah M, Lochhead R, Ogden A, Bruce J, Goldman J, Canoll P. Glial progenitors in adult white matter are driven to form malignant gliomas by platelet-derived growth factor-expressing retroviruses. J Neurosci. 2006 Jun 21;26(25):6781–90. doi: 10.1523/JNEUROSCI.0514-06.2006. [DOI] [PMC free article] [PubMed] [Google Scholar]
- 13.Masui K, Suzuki SO, Torisu R, Goldman JE, Canoll P, Iwaki T. Glial progenitors in the brainstem give rise to malignant gliomas by platelet-derived growth factor stimulation. Glia. 2010 Jul;58(9):1050–65. doi: 10.1002/glia.20986. [DOI] [PubMed] [Google Scholar]
- 14.Neymeyer V, Tephly TR, Miller MW. Folate and 10-formyltetrahydrofolate dehydrogenase (FDH) expression in the central nervous system of the mature rat. Brain Res. 1997 Aug 22;766(1-2):195–204. doi: 10.1016/s0006-8993(97)00528-3. [DOI] [PubMed] [Google Scholar]
- 15.Ozerdem U, Grako KA, Dahlin-Huppe K, Monosov E, Stallcup WB. NG2 proteoglycan is expressed exclusively by mural cells during vascular morphogenesis. Dev Dyn. 2001 Oct;222(2):218–27. doi: 10.1002/dvdy.1200. [DOI] [PubMed] [Google Scholar]
- 16.Levine JM, Reynolds R, Fawcett JW. The oligodendrocyte precursor cell in health and disease. Trends Neurosci. 2001 Jan;24(1):39–47. doi: 10.1016/s0166-2236(00)01691-x. [DOI] [PubMed] [Google Scholar]
- 17.Zhu X, Bergles DE, Nishiyama A. NG2 cells generate both oligodendrocytes and gray matter astrocytes. Development. 2008 Jan;135(1):145–57. doi: 10.1242/dev.004895. [DOI] [PubMed] [Google Scholar]
- 18.Lee da Y, Gianino SM, Gutmann DH. Innate neural stem cell heterogeneity determines the patterning of glioma formation in children. Cancer Cell. 2012 Jul 10;22(1):131–8. doi: 10.1016/j.ccr.2012.05.036. [DOI] [PMC free article] [PubMed] [Google Scholar]
- 19.Dawson MR, Polito A, Levine JM, Reynolds R. NG2-expressing glial progenitor cells: an abundant and widespread population of cycling cells in the adult rat CNS. Mol Cell Neurosci. 2003 Oct;24(2):476–88. doi: 10.1016/s1044-7431(03)00210-0. [DOI] [PubMed] [Google Scholar]
- 20.Raff MC, Abney ER, Cohen J, Lindsay R, Noble M. Two types of astrocytes in cultures of developing rat white matter: differences in morphology, surface gangliosides, and growth characteristics. J Neurosci. 1983 Jun;3(6):1289–300. doi: 10.1523/JNEUROSCI.03-06-01289.1983. [DOI] [PMC free article] [PubMed] [Google Scholar]
- 21.Raff MC, Abney ER, Miller RH. Two glial cell lineages diverge prenatally in rat optic nerve. Dev Biol. 1984 Nov;106(1):53–60. doi: 10.1016/0012-1606(84)90060-5. [DOI] [PubMed] [Google Scholar]
- 22.Miller RH, David S, Patel R, Abney ER, Raff MC. A quantitative immunohistochemical study of macroglial cell development in the rat optic nerve: in vivo evidence for two distinct astrocyte lineages. Dev Biol. 1985 Sep;111(1):35–41. doi: 10.1016/0012-1606(85)90432-4. [DOI] [PubMed] [Google Scholar]
- 23.Stallcup WB, Beasley L. Bipotential glial precursor cells of the optic nerve express the NG2 proteoglycan. J Neurosci. 1987 Sep;7(9):2737–44. doi: 10.1523/JNEUROSCI.07-09-02737.1987. [DOI] [PMC free article] [PubMed] [Google Scholar]
- 24.Baracskay KL, Kidd GJ, Miller RH, Trapp BD. NG2-positive cells generate A2B5-positive oligodendrocyte precursor cells. Glia. 2007 Aug 1;55(10):1001–10. doi: 10.1002/glia.20519. [DOI] [PubMed] [Google Scholar]
- 25.Yoo S, Wrathall JR. Mixed primary culture and clonal analysis provide evidence that NG2 proteoglycan-expressing cells after spinal cord injury are glial progenitors. Dev Neurobiol. 2007 Jun;67(7):860–74. doi: 10.1002/dneu.20369. [DOI] [PubMed] [Google Scholar]
- 26.Ju PJ, Liu R, Yang HJ, Xia YY, Feng ZW. Clonal analysis for elucidating the lineage potential of embryonic NG2(+) cells. Cytotherapy. 2012 Jan 25;14(5):608–20. doi: 10.3109/14653249.2011.651528. [DOI] [PubMed] [Google Scholar]
- 27.Mokry J, Karbanova J, Filip S, Cizkova D, Pazour J, English D. Phenotypic and morphological characterization of in vitro oligodendrogliogenesis. Stem Cells Dev. 2008 Apr;17(2):333–41. doi: 10.1089/scd.2007.0091. [DOI] [PubMed] [Google Scholar]
- 28.Winkler EA, Bell RD, Zlokovic BV. Central nervous system pericytes in health and disease. Nat Neurosci. 2011 Nov;14(11):1398–405. doi: 10.1038/nn.2946. [DOI] [PMC free article] [PubMed] [Google Scholar]
- 29.Wiranowska M, Ladd S, Smith SR, Gottschall PE. CD44 adhesion molecule and neuro-glial proteoglycan NG2 as invasive markers of glioma. Brain Cell Biol. 2006 Jun;35(2-3):159–72. doi: 10.1007/s11068-007-9009-0. [DOI] [PubMed] [Google Scholar]
- 30.Al-Mayhani MT, Grenfell R, Narita M, Piccirillo S, Kenney-Herbert E, Fawcett JW, et al. NG2 expression in glioblastoma identifies an actively proliferating population with an aggressive molecular signature. Neuro Oncol. 2011 Aug;13(8):830–45. doi: 10.1093/neuonc/nor088. [DOI] [PMC free article] [PubMed] [Google Scholar]
- 31.Schrappe M, Klier FG, Spiro RC, Waltz TA, Reisfeld RA, Gladson CL. Correlation of chondroitin sulfate proteoglycan expression on proliferating brain capillary endothelial cells with the malignant phenotype of astroglial cells. Cancer Res. 1991 Sep 15;51(18):4986–93. [PubMed] [Google Scholar]
- 32.Ellis JA, Castelli M, Bruce JN, Canoll P, Ogden AT. Retroviral delivery of platelet-derived growth factor to spinal cord progenitor cells drives the formation of intramedullary gliomas. Neurosurgery. 2012 Jan;70(1):198–204. doi: 10.1227/NEU.0b013e31822ce963. [DOI] [PMC free article] [PubMed] [Google Scholar]
- 33.Wang J, Svendsen A, Kmiecik J, Immervoll H, Skaftnesmo KO, Planaguma J, et al. Targeting the NG2/CSPG4 proteoglycan retards tumour growth and angiogenesis in preclinical models of GBM and melanoma. PLoS One. 2011;6(7):e23062. doi: 10.1371/journal.pone.0023062. [DOI] [PMC free article] [PubMed] [Google Scholar]
- 34.Ogden AT, Waziri AE, Lochhead RA, Fusco D, Lopez K, Ellis JA, et al. Identification of A2B5+CD133− tumor-initiating cells in adult human gliomas. Neurosurgery. 2008 Feb;62(2):505–14. doi: 10.1227/01.neu.0000316019.28421.95. [DOI] [PubMed] [Google Scholar]
- 35.Tchoghandjian A, Baeza N, Colin C, Cayre M, Metellus P, Beclin C, et al. A2B5 cells from human glioblastoma have cancer stem cell properties. Brain Pathol. 2010 Jan;20(1):211–21. doi: 10.1111/j.1750-3639.2009.00269.x. [DOI] [PMC free article] [PubMed] [Google Scholar]
- 36.Liu C, Sage JC, Miller MR, Verhaak RG, Hippenmeyer S, Vogel H, et al. Mosaic analysis with double markers reveals tumor cell of origin in glioma. Cell. 2011 Jul 22;146(2):209–21. doi: 10.1016/j.cell.2011.06.014. [DOI] [PMC free article] [PubMed] [Google Scholar]
- 37.Alcantara Llaguno S, Chen J, Kwon CH, Jackson EL, Li Y, Burns DK, et al. Malignant astrocytomas originate from neural stem/progenitor cells in a somatic tumor suppressor mouse model. Cancer Cell. 2009 Jan 6;15(1):45–56. doi: 10.1016/j.ccr.2008.12.006. [DOI] [PMC free article] [PubMed] [Google Scholar]
- 38.Ono K, Yasui Y, Rutishauser U, Miller RH. Focal ventricular origin and migration of oligodendrocyte precursors into the chick optic nerve. Neuron. 1997 Aug;19(2):283–92. doi: 10.1016/s0896-6273(00)80939-3. [DOI] [PubMed] [Google Scholar]
- 39.Gao L, Miller RH. Specification of optic nerve oligodendrocyte precursors by retinal ganglion cell axons. J Neurosci. 2006 Jul 19;26(29):7619–28. doi: 10.1523/JNEUROSCI.0855-06.2006. [DOI] [PMC free article] [PubMed] [Google Scholar]
- 40.Tchoghandjian A, Fernandez C, Colin C, El Ayachi I, Voutsinos-Porche B, Fina F, et al. Pilocytic astrocytoma of the optic pathway: a tumour deriving from radial glia cells with a specific gene signature. Brain. 2009 Jun;132:1523–35. doi: 10.1093/brain/awp048. Pt 6. [DOI] [PubMed] [Google Scholar]
- 41.Silber J, Lim DA, Petritsch C, Persson AI, Maunakea AK, Yu M, et al. miR-124 and miR-137 inhibit proliferation of glioblastoma multiforme cells and induce differentiation of brain tumor stem cells. BMC Med. 2008;6:14. doi: 10.1186/1741-7015-6-14. [DOI] [PMC free article] [PubMed] [Google Scholar]
- 42.Kwon CH, Zhao D, Chen J, Alcantara S, Li Y, Burns DK, et al. Pten haploinsufficiency accelerates formation of high-grade astrocytomas. Cancer Res. 2008 May 1;68(9):3286–94. doi: 10.1158/0008-5472.CAN-07-6867. [DOI] [PMC free article] [PubMed] [Google Scholar]
- 43.Abel TW, Clark C, Bierie B, Chytil A, Aakre M, Gorska A, et al. GFAP-Cre-mediated activation of oncogenic K-ras results in expansion of the subventricular zone and infiltrating glioma. Mol Cancer Res. 2009 May;7(5):645–53. doi: 10.1158/1541-7786.MCR-08-0477. [DOI] [PMC free article] [PubMed] [Google Scholar]
- 44.Zhu Y, Romero MI, Ghosh P, Ye Z, Charnay P, Rushing EJ, et al. Ablation of NF1 function in neurons induces abnormal development of cerebral cortex and reactive gliosis in the brain. Genes Dev. 2001 Apr 1;15(7):859–76. doi: 10.1101/gad.862101. [DOI] [PMC free article] [PubMed] [Google Scholar]
- 45.Madisen L, Zwingman TA, Sunkin SM, Oh SW, Zariwala HA, Gu H, et al. A robust and high-throughput Cre reporting and characterization system for the whole mouse brain. Nat Neurosci. 2010 Jan;13(1):133–40. doi: 10.1038/nn.2467. [DOI] [PMC free article] [PubMed] [Google Scholar]
- 46.Brannan CI, Perkins AS, Vogel KS, Ratner N, Nordlund ML, Reid SW, et al. Targeted disruption of the neurofibromatosis type-1 gene leads to developmental abnormalities in heart and various neural crest-derived tissues. Genes Dev. 1994 May 1;8(9):1019–29. doi: 10.1101/gad.8.9.1019. [DOI] [PubMed] [Google Scholar]
- 47.Hegedus B, Banerjee D, Yeh TH, Rothermich S, Perry A, Rubin JB, et al. Preclinical cancer therapy in a mouse model of neurofibromatosis-1 optic glioma. Cancer Res. 2008 Mar 1;68(5):1520–8. doi: 10.1158/0008-5472.CAN-07-5916. [DOI] [PubMed] [Google Scholar]
Associated Data
This section collects any data citations, data availability statements, or supplementary materials included in this article.


