

Abstract
BACKGROUND AND PURPOSE
Melatonin receptors have been extensively characterized regarding their affinity and pharmacology, mostly using 2-[125I]-melatonin as a radioligand. Although [3H]-melatonin has the advantage of corresponding to the endogenous ligand of the receptor, its binding has not been well described.
EXPERIMENTAL APPROACH
We characterized [3H]-melatonin binding to the hMT1 and hMT2 receptors expressed in a range of cell lines and obtained new insights into the molecular pharmacology of melatonin receptors.
KEY RESULTS
The binding of [3H]-melatonin to the hMT1 and hMT2 receptors displayed two sites on the saturation curves. These two binding sites were observed on cell membranes expressing recombinant receptors from various species as well as on whole cells. Furthermore, our GTPγS/NaCl results suggest that these sites on the saturation curves correspond to the G-protein coupled and uncoupled states of the receptors, whose pharmacology was extensively characterized.
CONCLUSIONS AND IMPLICATIONS
hMT1 and hMT2 receptors spontaneously exist in two states when expressed in cell lines; these states can be probed by [3H]-melatonin binding. Overall, our results suggest that physiological regulation of the melatonin receptors may result from complex and subtle mechanisms, a small difference in affinity between the active and inactive states of the receptor, and spontaneous coupling to G-proteins.
Keywords: melatonin, [3H]-melatonin, melatonin receptors, coupling state, GTPγS
Introduction
Melatonin, a hormone mainly synthesized and released by the pineal gland, is well known for its role in the control of mammalian biological rhythms; its known functions now span the biological spectrum from immunology to neuroprotection and depression (see Zawilska et al., 2009; Dubocovich et al., 2010). Melatonin receptors have been identified in numerous species (Morgan et al., 1994; Williams et al., 1995; 1999; Mazzucchelli et al., 1996; Drew et al., 2001). Two receptors have been cloned in humans, hMT1 and hMT2 and have been characterized as seven-transmembrane GPCRs (receptor nomenclature follows Alexander et al., 2013). These receptors bind melatonin with high affinity (20–200 pM) and are both mainly coupled to the inhibition of adenylyl cyclase (Reppert et al., 1994; Reppert et al., 1995; Masana and Dubocovich, 2001). Like most GPCRs, the cellular signalling of hMT1 and hMT2 receptors occurs via the recruitment of G-proteins and/or β-arrestin, and can be further modulated by other mechanisms, including allosterism and receptor homo- and heterodimerization as the most common mechanisms. For instance, melatonin receptors have been described as homo- and heterodimers when expressed in cellular systems (Ayoub et al., 2002).
The main radioligand used to study the melatonin receptors is 2-[125I]-melatonin (Vakkuri et al., 1984). With its high affinity for MT1 and MT2 receptors and its high specific activity, use of this radioligand enabled the description of the distribution of melatonin receptors in many organs and species (see Jockers et al., 2008), the characterization of the receptors in cellular systems, and the identification of a large range of agonists and antagonists (Witt-Enderby and Dubocovich, 1996; Nonno et al., 1998; Audinot et al., 2003; 2008; Zlotos et al., 2009). [3H]-melatonin, which is structurally identical to the natural ligand of the melatonin receptors, is an interesting alternative radioligand, although its lower specific activity has sometimes limited its applicability, especially for binding to tissue sections that express the melatonin binding sites at very low density. Interestingly, the overall pharmacology of [3H]-melatonin compares well that of with 2-[125I]-melatonin, although there are not many reports describing the pharmacology of the tritiated ligand (Niles, 1987; Kennaway et al., 1994; Browning et al., 2000).
Here, we report a comparative description of the molecular pharmacologies of hMT1 and hMT2 using these two radioligands. Our study confirms our recent findings that hMT1 and hMT2 are spontaneously expressed, as being pre-coupled to G-proteins (Devavry et al., 2012b), and that it is in this state that the receptors exhibit different pharmacologies; they have the same ligand-binding properties when they are un-coupled from G-proteins.
Methods
Membrane preparation
CHO-K1, HEK293 and Neuro2A cell lines stably expressing the MT1 or MT2 receptor (of human, rat, mouse, or sheep) were grown to confluence, harvested in PBS (Gibco, Invitrogen, Paisley, UK) containing 5 mM EDTA, and centrifuged at 1000× g for 20 min (4°C). The resulting pellet was resuspended in 5 mM Tris/HCl [pH 7.4] containing 2 mM EDTA, and was homogenized using a Kinematica polytron (Kinematica AG, Luzern, Switzerland). The homogenate was then centrifuged (20 000× g, 30 min, 4°C), and the resulting pellet was resuspended in 75 mM Tris/HCl [pH 7.4] containing 2 mM EDTA and 12.5 mM MgCl2. Determination of protein content was performed according to the Bradford method (Bradford, 1976) using the Bio-Rad DC™ Protein Assay Kit (Bio-Rad SA, Ivry-sur-Seine, France). Aliquots of membrane preparations were stored in re-suspension buffer (75 mMTris/HCl [pH 7.4], 2 mM EDTA, 12.5 mM MgCl2) at −80°C until use.
[3H]-melatonin and 2-[125I]-melatonin membrane-binding assay
Radioligand binding assays were performed in 96-well plates in a final volume of 250 μL in binding buffer (Tris/HCl 50 mM [pH 7.4], 5 mM MgCl2, 1 mM EDTA). Membranes, hMT1 and hMT2, were used at a final concentration of 30 μg·mL−1. Non-specific binding was defined with 10 μM melatonin. The reaction was stopped by rapid filtration through GF/B unifilters (PerkinElmer, Waltham, MA, USA) followed by three successive washes with ice-cold 50 mM Tris/HCl [pH 7.4].
Kinetic parameters (Kon, Koff and KDkinetics) of [3H]-melatonin and 2-[125I]-melatonin were measured on hMT1 and hMT2 at 37°C and at room temperature. For association studies, membranes were added to [3H]-melatonin (0.6 nM) and incubated for increasing periods of time (5–360 min). For dissociation studies, membranes were incubated with [3H]-melatonin (0.6 nM) for 20 min, 1 h or 3 h prior to the addition of cold melatonin (10 μM) to initiate dissociation, and then incubated for increasing periods of time (0–240 min). For 2-[125I]-melatonin association studies, membranes were added to 2-[125I]-melatonin (0.025 nM) and incubated for increasing periods of time (5–360 min). For dissociation studies, membranes were incubated with 2-[125I]-melatonin (0.025 nM) for 20 min and 2 h prior to the addition of cold melatonin (10 μM) to initiate dissociation, and then incubated for increasing periods of time (0–120 min). Kinetic measurements were repeated at least twice on the same pool of membranes to the limit of membrane availability.
Saturation experiments with [3H]-melatonin were performed in the equilibrium state, as determined from kinetics experiments. Membranes were incubated for 2 h (for hMT1) or 3 h (for hMT2) at 37°C in binding buffer containing [3H]-melatonin (0.01–20 nM). Saturation experiments with 2-[125I]-melatonin were also performed at equilibrium, with cellular membranes incubated for 2 h at 37°C in binding buffer containing 2-[125I]-melatonin (0.02–2.0 nM) as described previously (Audinot et al., 2003).
For competition studies, membranes were first incubated in binding buffer with compounds (10−15 to 10−5 M final, DMSO 1% final) for 1 h (hMT1) or 2 h (hMT2) at 37°C, and then incubated with [3H]-melatonin (5 nM) for 1 more hour for hMT1 and 2 more hours for hMT2 at 37°C. Non-specific binding was defined with 10 μM melatonin. The reaction was stopped by rapid filtration through GF/B unifilters, followed by three successive washes with ice-cold 50 mM Tris/HCl [pH 7.4].
G-protein uncoupling conditions were achieved by pre-incubating the cellular membranes for 30 min at 37°C with 100 μM GTPγS and 350 mM NaCl for hMT1 and with 100 μM GTPγS and 700 mM NaCl for hMT2. The incubated solutions were then added to [3H]-melatonin or 2-[125I]-melatonin for saturation tests or competition tests according to the protocols described above. In control conditions, membranes were pre-incubated with binding buffer for 30 min at 37°C.
Experiments with suspended cells
CHO-K1 cells stably expressing the hMT1 or hMT2 receptor were grown to confluence, harvested in PBS containing 5 mM EDTA, and centrifuged at 100× g for 10 min (4°C). The resulting pellet was suspended in HBSS (Gibco), and cells were counted using Vi-Cell (Beckman Coulter, Villepinte, France). From a previously sonicated cell sample, total protein concentration was measured according to the Bradford method using the Bio-Rad DC™ Protein Assay Kit (Bio-Rad SA, Ivry-sur-Seine, France). Cells were diluted in HBSS to a final condition of 25 000 cells in 200 μL. Binding experiments used the same protocols as the membrane-binding experiments. All binding reagents (cells, radioligand and compound) were diluted in HBSS buffer. For saturation experiments, hMT1- and hMT2-expressing cells were incubated for 1 h at 37°C with [3H]-melatonin (0.01–20.0 nM). For competition assays, cells were co-incubated with ligands (10−15 to 10−5 M) and [3H]-melatonin (1 nM for hMT1; 0.5 nM for hMT2). Non-specific binding was defined with 10 μM melatonin. The reaction was stopped by rapid filtration through GF/B unifilters, followed by three successive washes with ice-cold 50 mM Tris/HCl [pH 7.4].
Data analysis
Data were analysed using PRISM 5.04 (GraphPad software Inc., San Diego, CA, USA). For saturation assays, the number of maximum binding sites (Bmax) and the dissociation constant of the radioligand (KD) were calculated according to the method of Scatchard (Acuna-Castroviejo et al., 1994). For each saturation experiment, nonlinear regression data were statistically analysed by extra-sum of squares F-test (PRISM 5.04, GraphPad software) to test the hypothesis of preferred fitting model of the regression curve, one or two sites (one site regression curve equation: Y = Bmax × X/(KD + X); two sites regression curve equation: Y = Bmax1 × X/(KD1 + X) + Bmax2 × X/(KD2 + X). Association kinetic data were analysed by fitting specific binding data to the equation B = Bmax × (1-exp(–k × t)), where B is binding at time t and k is the observed association rate constant. Dissociation kinetic data were analysed by fitting specific binding to the equation B = Bmax × exp(–k+t) + plateau, where k is the dissociation rate constant. The extra-sum of squares F-test (PRISM 5.04, GraphPad software) was also used to determine the preferred regression model, one or two sites, in kinetics experiments. Kinetic KD was calculated as KDkinetics = koff/kon, with koff representing the dissociation constant (s−1) and Kon (M−1·s−1) representing the association constant; kinetic KD is expressed as pKD = –log(KD). For competition experiments, inhibition constants (KI) were calculated according to the Cheng–Prusoff equation (Cheng and Prusoff, 1973): KI = IC50/[1 + (L/KD)], where IC50 is the 50% inhibition concentration, L is the concentration of [3H]-melatonin and KD the KD of the high-affinity site. KD and KI values are expressed as pKD and pKI, with pKD = –log(KD) and pKI = –log(KI). The Pearson product–moment correlation coefficient was employed for correlation analysis of pKI values.
Materials
[3H]-melatonin (specific activity 80–85 Ci·mmol−1 – 3 atoms of tritium per melatonin molecule ) was purchased from American Radiolabeled Chemicals Inc. (St Louis, MO, USA) and 2-[125I]-melatonin (specific activity 2200 Ci·mmol−1) was purchased from Perkin Elmer (Boston, MA, USA). Radioligand structures and labelling position are illustrated in Figure 1. Melatonin, 2-iodo-melatonin, 6-chloromelatonin, 5-HT and D 600 (+/– methoxy verapamil) were obtained from Sigma (St Louis, MO, USA); 4-phenyl-2-propionamidotetraline and luzindole (2-benzyl-N-acetyltryptamine) were purchased from Tocris (Bristol, UK), and 2-bromomelatonin was purchased from Toronto Research Chemicals Inc. (Toronto, Canada). We evaluated 15 analogues of melatonin from our product library whose structures are available in Depreux et al., 1994; Audinot et al., 2003; Mailliet et al., 2004; Audinot et al., 2008; Devavry et al., 2012a; Devavry et al., 2012b; Legros et al., 2013 and Ettaoussi et al., 2013. Compounds were dissolved in DMSO at a stock concentration of 10 mM and stored at −20°C until use. All other reagents were obtained from Sigma.
Figure 1.
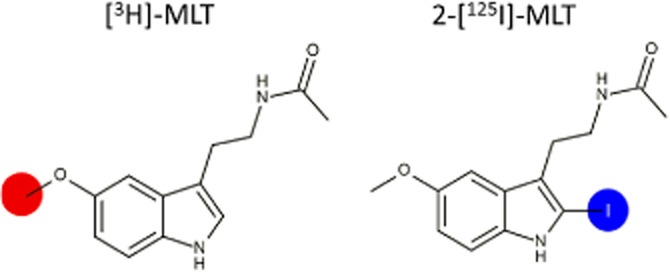
[3H]-melatonin ([3H]-MLT) and 2-[125I]-melatonin (2-[125I]-MLT) chemical structures. Labelling position in red for the [3H]-MLT and in blue for the 2-[125I]-MLT.
Results
Association and dissociation kinetics
The hMT1 and hMT2 receptors exhibited different kinetic profiles (Figure 2), with a slightly slower profile for hMT2 that reflected little or any dissociation of [3H]-melatonin; for hMT1, association was fast and the dissociation was total or nearly total (Figure 2). At 37°C, hMT1 showed one-component association fast kinetics, and hMT2 exhibited a two-parameter kinetic association. The binding plateau was reached in 30 min for hMT1 and in 90 min for hMT2. Kinetic parameters (kon, koff, KDkinetics and t1/2s) are described in Table 1. Kinetics were 2–5 times slower at room temperature than at 37°C, and both receptors displayed a two-parameter association profile. In addition, dissociation from hMT1 was only partial, and no dissociation of the radioligand was observed from hMT2.
Figure 2.
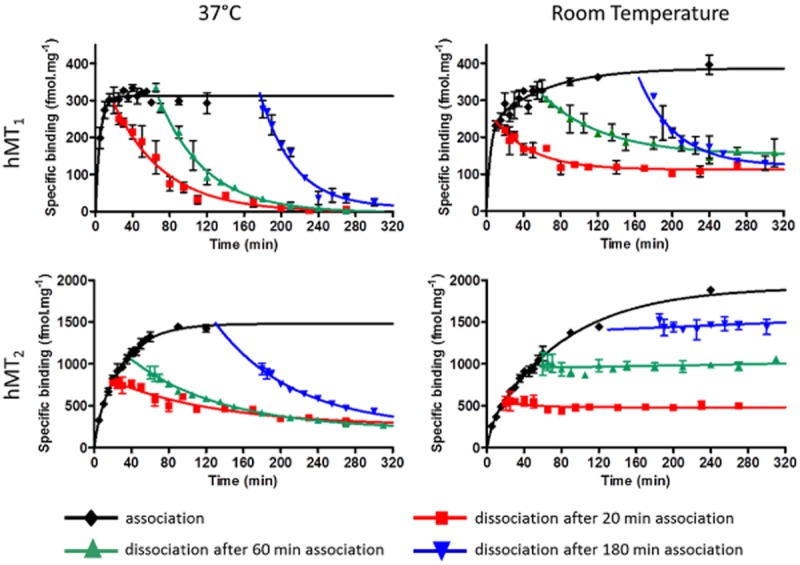
Time course of association and dissociation of [3H]-melatonin (0.6 nM) binding to hMT1 and hMT2 receptors at 37°C and at room temperature. Dissociation was measured at three association times (20 min; 60 min and 180 min). Data are the mean (±SEM) of at least two experiments at the same time points.
Table 1.
Kinetic parameters of [3H]-melatonin ([3H]-MLT) and 2-[125I]-melatonin (2-[125I]-MLT) to the hMT1 and hMT2 receptors at 37°C and at room temperature (RT)
| pKD(kinetics)(1) | pKD(kinetics)(2) | Association t1/2 (l) (min) | Association t1/2 (2) (min) | Dissociation t1/2 (min) | kon(1) (M−1·s−1) | kon(2) (M−1·s−1) | koff (s−1) | |||
|---|---|---|---|---|---|---|---|---|---|---|
| 37°C | [3H]-MLT | hMT1 | 10.24 ± 0.05 | – | 3.0 ± 0.6 | – | 33.6 ± 2.9 | 6.10 × 10⁶ | – | 3.54 × 10⁻⁴ |
| hMT2 | 10.72 ± 0.02 | 9.91 ± 0.02 | 2.6 ± 0.7 | 16.6 ± 5.7 | 69.3 ± 8.2 | 7.37 × 10⁶ | 1.13 × 10⁶ | 1.42 × 10⁻⁴ | ||
| 2-[125I]-MLT | hMT1 | 10.94 ± 0.11 | – | 20.5 ± 4.2 | – | 48.6 ± 12.5 | 2.20 × 10⁷ | – | 2.55 × 10⁻⁴ | |
| hMT2 | – | – | 36.4 ± 4.1 | – | – | 1.23 × 10⁷ | – | – | ||
| RT | [3H]-MLT | hMT1 | 10.30 ± 0.05 | 9.08 ± 0.05 | 2.7 ± 0.7 | 44.8 ± 2.8 | 35.0 ± 2.1 | 6.75 × 10⁶ | 4.03 × 10⁵ | 3.37 × 10⁻⁴ |
| hMT2 | – | – | 6.1 ± 3.8 | 90.3 ± 45.7 | – | 3.78 × 10⁶ | 2.35 × 10⁵ | – | ||
| 2-[125I]-MLT | hMT1 | 10.60 ± 0.06 | – | 48.6 ± 6.7 | – | 48.6 ± 6.7 | 9.58 × 10⁶ | – | 2.41 × 10⁻⁴ | |
| hMT2 | – | – | 79.9 ± 9.9 | – | – | 5.60 × 10⁶ | – | – |
Kinetic parameters (Kon, Koff, t1/2) of [3H]-melatonin and 2-[125I]-melatonin were measured on membranes from CHO-K1 cells expressing either hMT1 or hMT2 receptors. pKD was calculated as pKD = –log(Koff/Kon). Results are given as mean ± SEM for at least two experiments.
The association and dissociation kinetics of 2-[125I]-melatonin (Figure 3) were slower than those of [3H]-melatonin on the hMT1 and hMT2 receptors. The half-time of association at 37°C was 10 times slower than that for [3H]-melatonin: 20.5 min for hMT1 and 36.4 min for hMT2 (plateau was reached in 2 h for hMT1 and in ∼4 h for hMT2). The half-association times doubled when the association reaction was run at room temperature. For both receptors, dissociation was only partial at 37°C for the two dissociation times, and no dissociation was measurable at room temperature. The kinetic parameters (kon, koff, KDkinetics and t1/2s) are shown in Table 1.
Figure 3.
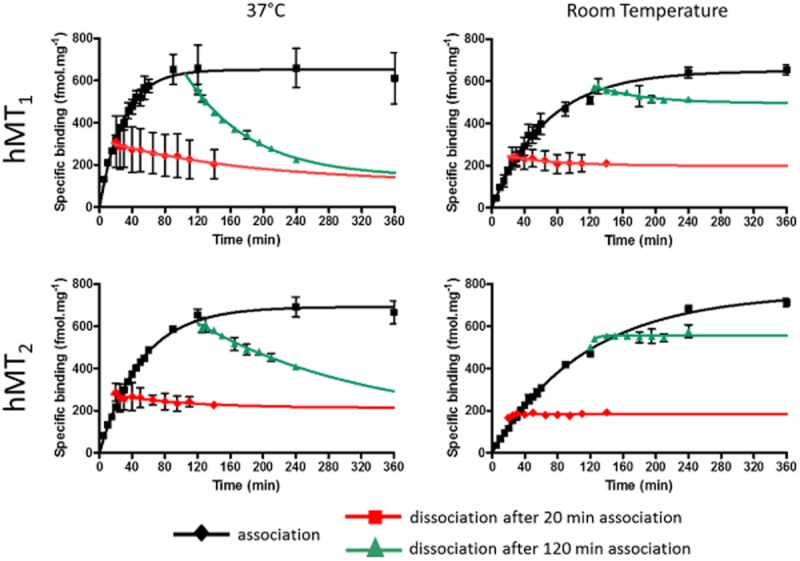
Time course of association and dissociation of 2-[125I]-melatonin (0.025 nM) binding to hMT1 and hMT2 receptors at 37°C and at room temperature. Dissociation was measured at two association times (20 min; 120 min). Data are the mean (±SEM) of at least two experiments at the same time points.
Saturation isotherms for hMT1 and hMT2 receptors
CHO-hMT1 and CHO-hMT2 membrane preparations were characterized by 2-[125I]-melatonin binding and showed classical high-affinity values, with pKD = 10.64 ± 0.11 for hMT1 receptors (mean ± SEM, n = 5) and pKD = 10.11 ± 0.05 for hMT2 receptors (mean ± SEM, n = 8; Figure 4). Interestingly, [3H]-melatonin experiments yielded saturation isotherms that, after Scatchard linearization, clearly showed a biphasic profile for the two receptors, indicating the presence of two different pharmacological sites in the membrane preparations (Figure 4). A high-affinity site (site 1) yielded values of pKD1 = 10.23 ± 0.07 for hMT1 and pKD1 = 9.87 ± 0.05 for hMT2; a second site (site 2) displayed a lower affinity, with pKD2 = 9.46 ± 0.01 for hMT1 and pKD2 = 9.26 ± 0.05 for hMT2 (mean ± SEM, n = 12 for for hMT1 and n = 10 for hMT2). Site 1 was five- to sixfold predominant over site 2, with Bmax1 = 574.6 ± 76.7 fmol·mg−1 versus Bmax2 = 96.3 ± 11.9 fmol·mg−1 for hMT1, and Bmax1 = 2219.9 ± 178.2 fmol·mg−1 versus Bmax2 = 462.7 ± 68.3 fmol·mg−1 for hMT2. Notably, for both radioligands the maximum number of binding sites was substantially higher for hMT2 than for hMT1 (∼2000 vs. ∼600 fmol·mg−1, respectively), which is consistent with our experience that MT2 receptors of any species are easier to express in heterologous systems than MT1 receptors.
Figure 4.

Saturation and Scatchard regression for the hMT1 and hMT2 receptors, with 2-[125I]-melatonin (incubation 2 h at 37°C) and [3H]-melatonin (incubation 2 h at 37°C for hMT1 and 3 h at 37°C for hMT2). Graphs are representative of all experiments in each case.
Exploration of [3H]-melatonin binding across experimental conditions and species
We further documented the binding sites for [3H]-melatonin on the melatonin receptors under various experimental conditions. First, recombinant human receptors were evaluated in live cells, using the same CHO cell lines as were used for the membrane binding experiments. Under these conditions, hMT1, but not hMT2 receptors, showed two binding sites, with the following values: CHO-hMT1: pKD1 = 9.61 ± 0.08, pKD2 = 8.75 ± 0.16, Bmax1 = 119.9 ± 43.2 fmol·mg−1 and Bmax2 = 79.3 ± 17.6 fmol·mg−1 (mean ± SEM, n = 4); CHO-hMT2: pKd = 9.43 ± 0.08 and Bmax = 1192.8 ± 395.1fmol·mg−1 (mean ± SEM, n = 5). Under these conditions, 2-[125I]-melatonin displayed a single binding site for CHO-hMT1: pKD = 10.36 ± 0.05 and Bmax = 125.1 ± 28.8 fmol·mg−1; CHO-hMT2: pKD = 9.78 ± 0.27 and Bmax = 933.0 ± 247.5 fmol·mg−1 (mean ± SEM, at least n = 2). Second, we characterized [3H]-melatonin binding to cell membranes with recombinant human melatonin receptors expressed in two other cell lines: human HEK cells of non-neuronal origin, and murine Neuro2A cells of neuronal origin. In both cases, hMT1 and hMT2 receptors consistently exhibited two binding sites upon saturation with tritiated melatonin, with pKD values very similar to those obtained with CHO cell lines (Table 2; mean ± SEM, n = 2). Third, we evaluated [3H]-melatonin binding to melatonin receptors from sheep (Mailliet et al., 2004; Cogé et al., 2009), mouse (Devavry et al., 2012a) and rat (Audinot et al., 2008), most of which had been initially cloned in our laboratory. Again, in all cases, melatonin receptors expressed in CHO cells displayed a biphasic saturation curve (Table 2; mean ± SEM, n = 2) consistent with the observations from human receptors. Further, our control experiments demonstrated that all naïve cells (CHO, HEK and Neuro2A) were completely devoid of endogenous melatonin binding sites.
Table 2.
pKD and Bmax of [3H]-melatonin binding to melatonin receptors from various species
| pKD1 | pKD2 | Bmax1 fmol·mg proteins−1 | Bmax2 fmol·mg proteins−1 | |
|---|---|---|---|---|
| CHO-hMT1 | 10.23 ± 0.07 | 9.46 ± 0.01 | 574.6 ± 76.7 | 96.3 ± 11.9 |
| CHO-hMT2 | 9.87 ± 0.05 | 9.26 ± 0.05 | 2219.9 ± 178.2 | 462.7 ± 68.3 |
| HEK293-hMT1 | 10.05 ± 0.17 | 9.30 ± 0.23 | 544.4 ± 455.7 | 227.0 ± 176.0 |
| HEK293-hMT2 | 9.76 ± 0.12 | 9.17 ± 0.25 | 1249.1 ± 1061.9 | 305.4 ± 145.2 |
| Neuro2A-hMT1 | 10.21 ± 0.01 | 9.38 ± 0.29 | 133.1 ± 12.0 | 26.5 ± 7.5 |
| Neuro2A-hMT2 | 10.15 ± 0.25 | 9.52 ± 0.41 | 484.8 ± 277.3 | 118.6 ± 61.8 |
| CHO-oMT1 | 9.82 ± 0.16 | 9.04 ± 0.01 | 1323.5 ± 64.0 | 546.0 ± 85.0 |
| CHO-oMT2 | 9.61 ± 0.09 | 8.96 ± 0.07 | 457.6 ± 31.4 | 158.3 ± 48.2 |
| CHO-mMT1 | 9.17 ± 0.08 | 8.97 ± 0.10 | 566.2 ± 13.0 | 356.1 ± 60.7 |
| CHO-mMT2 | 9.05 ± 0.16 | 8.68 ± 0.06 | 289.2 ± 33.2 | 96.4 ± 4.4 |
| CHO-rMT1 | 9.80 ± 0.14 | 8.93 ± 0.07 | 144.3 ± 35.9 | 94.1 ± 5.9 |
| CHO-rMT2 | 9.21 ± 0.01 | 8.86 ± 0.05 | 1055.7 ± 393.6 | 313.4 ± 107.0 |
hMT1 and hMT2 receptors were stably expressed in CHO-K1, Neuro2A and HEK293 cells. Ovine (o), mouse (m) and rat (r) MT1 and MT2 receptors were expressed on CHO-K1 cells. Results are given as mean ± SEM for at least two experiments.
These data indicate that human and ovine receptors share the same overall profile, with pKD values between the two sites differing by a factor of 4–9, and pKD values differing between MT1 and MT2 receptors by a factor of two or less. In addition, the proportion of binding to site 2 versus the total number of maximal binding sites varied from 15 to 30%. The mouse and rat receptors exhibited a different binding profile, with pKD values between the two sites differing by a factor of two, and pKD values differing between MT1 and MT2 receptors by a factor of 4–8. Furthermore, these receptors displayed a higher proportion of site 2 binding, which accounted for 40% of binding to the overall maximum number of binding sites.
Evaluation of the effect of G-protein uncoupling agents on melatonin binding
We evaluated the hypothesis that binding site 2 represented a different state of activation of the hMT receptors by exploring the effect of G-protein uncoupling agents on the [3H]-melatonin saturation isotherms. GTPγS and NaCl have been reported to decrease the recruitment of G-proteins to GPCRs (Nonno et al., 1998); here we used these reagents with CHO-hMT1 and CHO-hMT2 membrane preparations. Our protocol optimization allowed us to determine the appropriate conditions for hMT1 (100 μM GTPγS and 350 mM NaCl) and for hMT2 receptors (100 μM GTPγS and 700 mM NaCl). When subjected to GTPγS and NaCl pretreatment, hMT1 and hMT2 receptors both showed complete disappearance of the high-affinity binding site 1, to the benefit of the binding site 2; the number of total maximal binding sites remained relatively unchanged (Figure 5, Table 3). The affinity constant (pKI) for binding site 2 (the lower-affinity site) shifted from 9.24 (hMT2) and 9.32 (hMT1) in the absence of uncoupling agent to 8.75 (hMT2) and 7.82 (hMT1) in the presence of GTPγS and NaCl. Notably, the apparent affinity of binding site 2 of hMT1 underwent a stronger shift in the presence of GTPγS and NaCl, which will be discussed later in this report. The effect of GTPγS and NaCl as uncoupling agents was also evaluated on the binding of 2-[125I]-melatonin, which displayed a single binding site under control conditions (Figures 4 and 5, Table 3). Upon treatment of membranes with GTPγS and NaCl, the affinity of the binding site for 2-[125I]-melatonin was decreased by a factor of ∼10 for hMT1 and by a factor of approximately 3 for hMT2 receptors. The total number of binding sites was conserved for hMT2 after incubation with the decoupling agents; as for [3H]-melatonin binding, hMT1 receptors displayed an unexpected decrease in the total number of binding sites, by a factor of six in the case of 2-[125I]-melatonin.
Figure 5.
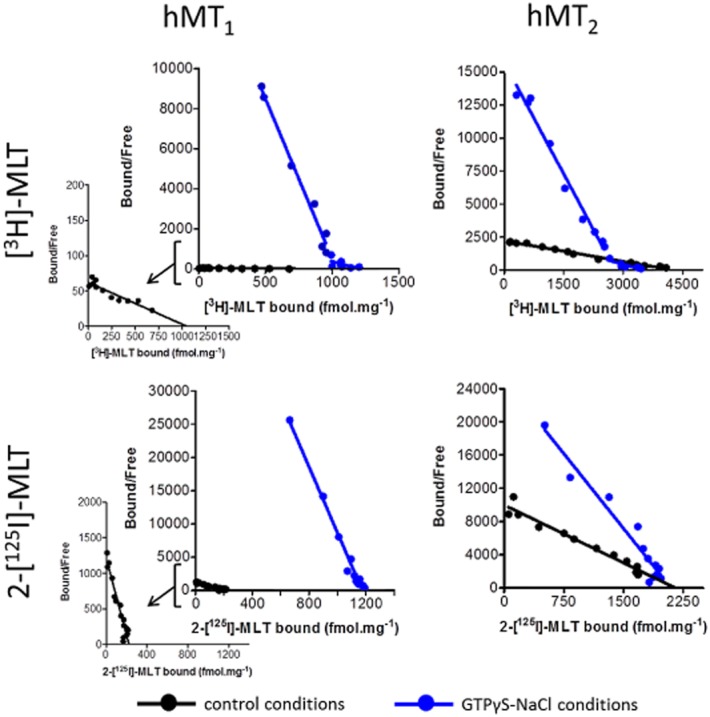
Effect of 100 μM GTPγS and 350 mM NaCl for hMT1 or 100 μM GTPγS and 700 mM NaCl for hMT2 in saturation experiments (Scatchard regression) with [3H]-melatonin ([3H]-MLT) or 2-[125I]-melatonin (2-[125I]-MLT). Each curve is representative of all experiments in each case (n = 3).
Table 3.
Comparison of pKD and Bmax for binding of [3H]-melatonin ([3H]-MLT) and 2-[125I]-melatonin (2-[125I]-MLT) to the human melatonin receptors
| pKD1 | pKD2 | Bmax1 fmol·mg proteins−1 | Bmax2 fmol·mg proteins−1 | ||
|---|---|---|---|---|---|
| [3H]-MLT | hMT1 control | 10.20 ± 0.03 | 9.32 ± 0.21 | 982.7 ± 59.2 | 111.3 ± 34.8 |
| hMT2 control | 9.77 ± 0.04 | 9.24 ± 0.04 | 2794.0 ± 148.9 | 645.3 ± 73.5 | |
| hMT1 GTPγS + NaCl | – | 7.82 ± 0.07 | – | 899 ± 97 | |
| hMT2 GTPγS + NaCl | – | 8.75 ± 0.02 | – | 3768.7 ± 261.3 | |
| 2-[125I]-MLT | hMT1 control | 10.64 ± 0.11 | – | 688.9 ± 138.5 | – |
| hMT2 control | 10.11 ± 0.05 | – | 2340.6 ± 92.3 | – | |
| hMT1 GTPγS + NaCl | 9.56 ± 0.1 | – | 245.3 ± 33.0 | – | |
| hMT2 GTPγS + NaCl | 9.56 ± 0.07 | – | 2617.3 ± 328.5 | – |
pKD and Bmax of [3H]-melatonin and 2-[125I]-melatonin were measured on membranes from CHO-K1 cells expressing either hMT1 or hMT2 receptors, in the presence of 100 μM GTPγS and/or 350 mM (hMT1) or 700 mM (hMT2) NaCl. Mean ± SEM are given for at least three experiments.
Pharmacology
Finally, it was important to evaluate whether these two binding sites exhibit the same pharmacology. We therefore assessed a set of 24 compounds that either already had been described (melatonin derivatives, 4-phenyl-2-propionamidotetraline, luzindole, ramelteon) or had been prepared via medicinal chemistry in our melatonin research programme. These compounds were tested on hMT1 and hMT2 receptors, on membrane preparations or live cells, and against 2-[125I]-melatonin or [3H]-melatonin. Under standard, non-uncoupling binding conditions, the binding data all consistently exhibited reasonable to good correlation among the various datasets (Figure 6, Table 4). [3H]-melatonin pharmacology mostly replicated 2-[125I]-melatonin pharmacology, both for hMT1 and hMT2 receptors. In addition, radioligand binding to live cells yielded pKI values that were well correlated with the data obtained from membrane preparations; we detected a slight bias in the correlation in which the difference in potency between the compounds was less important in cells than in membranes. This tendency was clearer with hMT2 than with hMT1 receptors (Figure 6).
Figure 6.
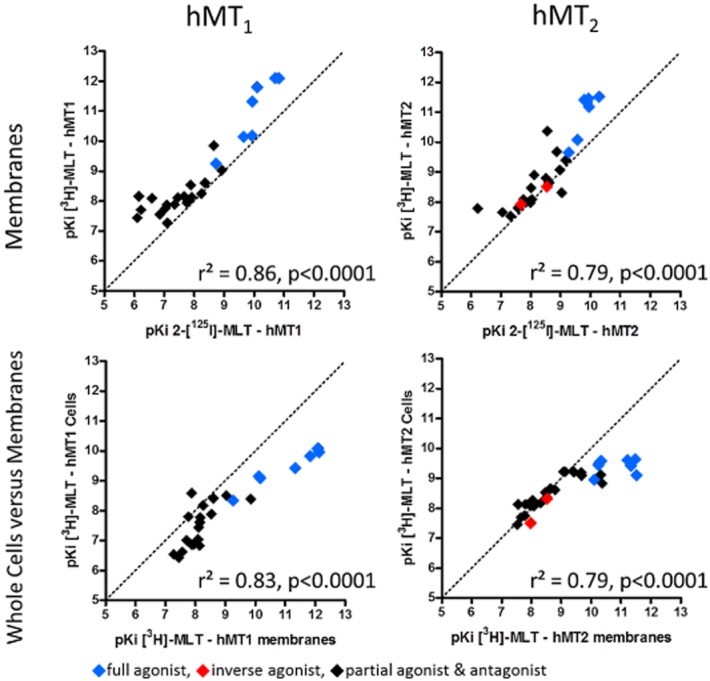
Correlation plots of binding affinities [expressed as pKI = –log(KI) ] determined for [3H]-melatonin ([3H]-MLT) or 2-[125I]-melatonin (2-[125I]-MLT; from reference database) binding to hMT1 and hMT2 receptors in membrane preparations. Correlation plots of binding affinities were generated for [3H]-melatonin binding to hMT1 and hMT2 receptors expressed in whole cells or in membrane preparations.
Table 4.
Binding affinities of reference ligands to hMT1 and hMT2 receptors as measured with either [3H]-melatonin ([3H]-MLT) or 2-[125I]-melatonin (2-[125I]-MLT)
| hMT1 | hMT2 | |||
|---|---|---|---|---|
| pKI ± SEM | pKI ± SEM | pKI ± SEM | pKI ± SEM | |
| [3H]-MLT | 2-[125I]-MLT | [3H]-MLT | 2-[125I]-MLT | |
| MLT | 10.15 ± 0.12 | 9.65 ± 0.02 | 9.67 ± 0.26 | 9.27 ± 0.02 |
| 2-I-MLT | 12.12 ± 0.20 | 10.71 ± 0.08 | 11.40 ± 0.18 | 9.83 ± 0.03 |
| 4P-P-DOT | 7.56 ± 0.16 | 6.85 ± 0.04 | 9.07 ± 0.51 | 8.97 ± 0.05 |
| Luzindole | 8.09 ± 0.31 | 6.59 ± 0.01 | 7.80 ± 0.17 | 7.57 ± 0.01 |
| Ramelteon | 11.82 ± 0.06 | 10.10 ± 0.09 | 11.52 ± 0.14 | 10.30 ± 0.19 |
| SD6 | 11.33 ± 0.34 | 9.94 ± 0.01 | 11.33 ± 0.13 | 9.89 ± 0.22 |
| 6-Cl-MLT | 9.25 ± 0.07 | 8.73 ± 0.03 | 10.09 ± 0.24 | 9.56 ± 0.12 |
| 2-Br-MLT | 12.11 ± 0.08 | 10.82 ± 0.13 | 11.47 ± 0.23 | 9.94 ± 0.12 |
| S 70254 | 7.32 ± 0.31 | 7.03 ± 0.09 | 8.31 ± 0.50 | 9.04 ± 0.08 |
| SD1881 (6-I-MLT) | 6.83 ± 0.24 | 8.84 ± 0.01 | 8.64 ± 0.14 | 8.61 ± 0.04 |
| SD1882 (4-I-MLT) | 7.95 ± 0.07 | 7.76 ± 0.12 | 8.04 ± 0.14 | 7.99 ± 0.14 |
| SD1918 (7-I-MLT) | 7.88 ± 0.10 | 7.34 ± 0.15 | 7.53 ± 0.52 | 7.32 ± 0.15 |
| S 22153 | 8.25 ± 0.09 | 8.24 ± 0.14 | 8.47 ± 0.44 | 8.01 ± 0.09 |
| S 27128-1 | 9.03 ± 0.12 | 8.92 ± 0.01 | 9.40 ± 0.26 | 9.17 ± 0.06 |
| Agomelatine | 10.17 ± 0.25 | 9.92 ± 0.01 | 11.21 ± 0.17 | 9.93 ± 0.06 |
| D600 (+/−) | 7.76 ± 0.15 | 7.04 ± 0.02 | <5 | <5 |
| DIV00880 | 7.44 ± 0.12 | 6.10 ± 0.04 | 8.08 ± 0.34 | 8.04 ± 0.06 |
| 5HT | <5 | <5 | <5 | <5 |
| S 20928 | 7.27 ± 0.26 | 7.10 ± 0.08 | 7.65 ± 0.28 | 7.05 ± 0.25 |
| S 75436 | 8.53 ± 0.06 | 7.88 ± 0.01 | 9.68 ± 0.11 | 8.87 ± 0.15 |
| S 21278 | 7.71 ± 0.14 | 6.22 ± 0.10 | 7.78 ± 0.22 | 6.22 ± 0.03 |
| S 73893 | 8.60 ± 0.06 | 8.36 ± 0.16 | 8.90 ± 0.09 | 8.11 ± 0.23 |
| S 77834 | 7.87 ± 0.15 | 7.09 ± 0.05 | 8.51 ± 0.19 | 8.53 ± 0.06 |
| S 77840 | 8.16 ± 0.11 | 6.15 ± 0.08 | 7.98 ± 0.05 | 7.71 ± 0.15 |
Experiments were conducted using recombinant receptors expressed in CHO-K1 cells. Data are given as mean ± SEM. 4P-P-DOT, 4-phenyl-2-propionamidotetraline.
We then evaluated the pharmacology of these compounds with membrane preparations treated with GTPγS and NaCl. The data obtained with and without the uncoupling agents are represented in Figure 7 and Table 5, where compounds are annotated according to their functional response in a [35S]-GTPγS binding assay. In this comparison, GTPγS and NaCl treatment tended to increase the affinity of inverse agonists and decrease the affinity of agonists. This tendency was more pronounced with hMT1 than with hMT2 receptors, and was more visible with [3H]-melatonin than with 2-[125I]-melatonin. This difference of compound behaviour is illustrated in Figures 8 and 9, which shows IC50 curves for both radioligand in control and uncoupling conditions that reflect the shift of affinity in presence of GTPγS and NaCl.
Figure 7.
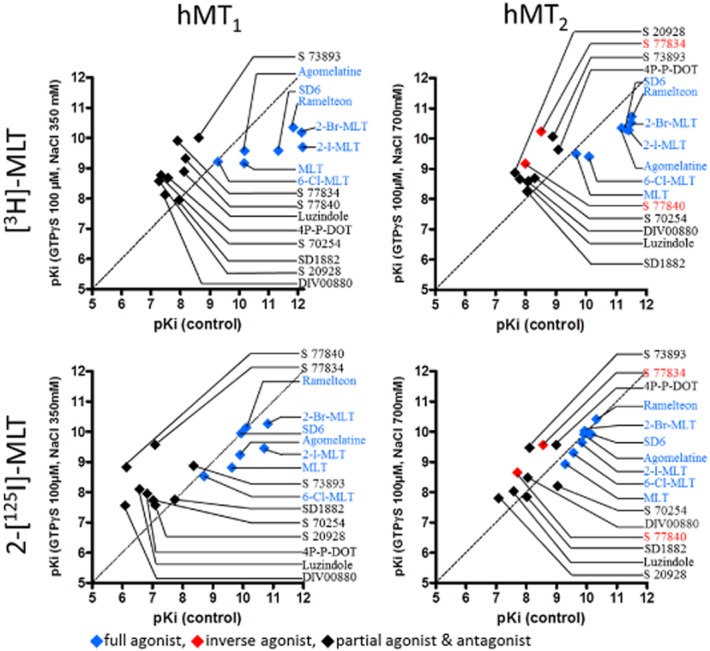
Correlation plot of binding affinities [expressed as pKI = –log(KI) ] determined for [3H]-melatonin ([3H]-MLT) or 2-[125I]-melatonin (2-[125I]-MLT; from reference database) binding to hMT1 and hMT2 receptors in membrane preparations in the presence of 100 μM GTPγS and 350 mM NaCl for hMT1 and 700 mM NaCl for hMT2.
Table 5.
Binding affinities of reference compounds to hMT1 and hMT2 receptors in the presence of GTPγS and NaCl
| hMT1 | hMT2 | |||
|---|---|---|---|---|
| GTPγS 100 μM + NaCl 350 mM | GTPγS 100 μM + NaCl 700 mM | |||
| pKi ± SEM | pKi ± SEM | pKi ± SEM | pKi ± SEM | |
| [3H]-MLT | 2-[125I]-MLT | [3H]-MLT | 2-[125I]-MLT | |
| MLT | 9.17 ± 0.23 | 8.82 ± 0.34 | 9.48 ± 0.21 | 8.94 ± 0.25 |
| 2-I-MLT | 9.72 ± 0.54 | 9.48 ± 0.45 | 10.28 ± 0.17 | 9.64 ± 0.26 |
| 4P-P-DOT | 8.69 ± 0.12 | 7.96 ± 0.26 | 9.63 ± 0.75 | 9.56 ± 0.03 |
| Luzindole | 8.91 ± 0.23 | 8.11 ± 0.21 | 8.65 ± 0.18 | 8.05 ± 0.03 |
| Ramelteon | 10.35 ± 0.26 | 10.14 ± 0.24 | 10.72 ± 0.34 | 10.42 ± 0.08 |
| SD6 | 9.60 ± 0.41 | 9.95 ± 0.22 | 10.34 ± 0.28 | 9.93 ± 0.22 |
| 6-Cl-MLT | 9.21 ± 0.27 | 8.53 ± 0.21 | 9.39 ± 0.49 | 9.31 ± 0.04 |
| 2-Br-MLT | 10.20 ± 0.46 | 10.25 ± 0.27 | 10.53 ± 0.11 | 10.00 ± 0.09 |
| S 70254 | 8.76 ± 0.70 | 7.73 ± 0.36 | 8.70 ± 0.47 | 8.22 ± 0.12 |
| SD1882 (4-I-MLT) | 7.97 ± 0.07 | 7.76 ± 0.42 | 8.26 ± 0.31 | 7.86 ± 0.08 |
| Agomelatine | 9.56 ± 0.32 | 9.26 ± 0.18 | 10.34 ± 0.34 | 9.93 ± 0.09 |
| DIV00880 | 8.13 ± 0.23 | 7.56 ± 0.22 | 8.58 ± 0.21 | 8.49 ± 0.08 |
| S 20928 | 8.60 ± 0.31 | 7.59 ± 0.19 | 8.85 ± 0.38 | 7.80 ± 0.09 |
| S 73893 | 10.01 ± 0.19 | 8.89 ± 0.19 | 10.06 ± 0.22 | 9.48 ± 0.11 |
| S 77834 | 9.92 ± 0.37 | 9.58 ± 0.25 | 10.23 ± 0.00 | 9.58 ± 0.03 |
| S 77840 | 9.32 ± 0.12 | 8.82 ± 0.31 | 9.17 ± 0.24 | 8.66 ± 0.03 |
Experiments were conducted as described in Methods, using membranes from stably transfected CHO-K1 cells and in the presence of GTPγS and NaCl under standard conditions, using [H]-melatonin ([3H]-MLT) or 2-[125I]-melatonin (2-[125I]-MLT). Experiments are presented as mean ± SEM for at least three experiments. 4P-P-DOT, 4-phenyl-2-propionamidotetraline.
Figure 8.
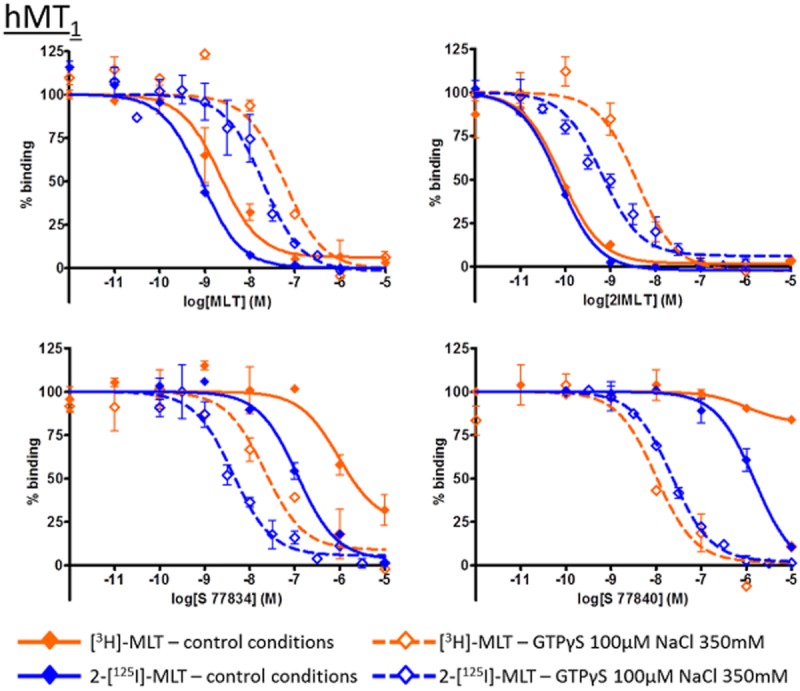
Inhibition curves for melatonin (MLT), 2-iodo-melatonin (2IMLT), S 77834 and S 77840 on hMT1 receptors with [3H]-MLT and 2-[125I]-MLT, in control condition or in presence of GTPγS 100 μM and NaCl 350 mM. Those individual IC50 curves are representative of experiments and illustrate the shift of IC50 values but not pKI in presence of GTPγS and NaCl. Please note that the IC50 values suggested by these figures are inherently different from the calculated pKI values given in the tables and in the text.
Figure 9.
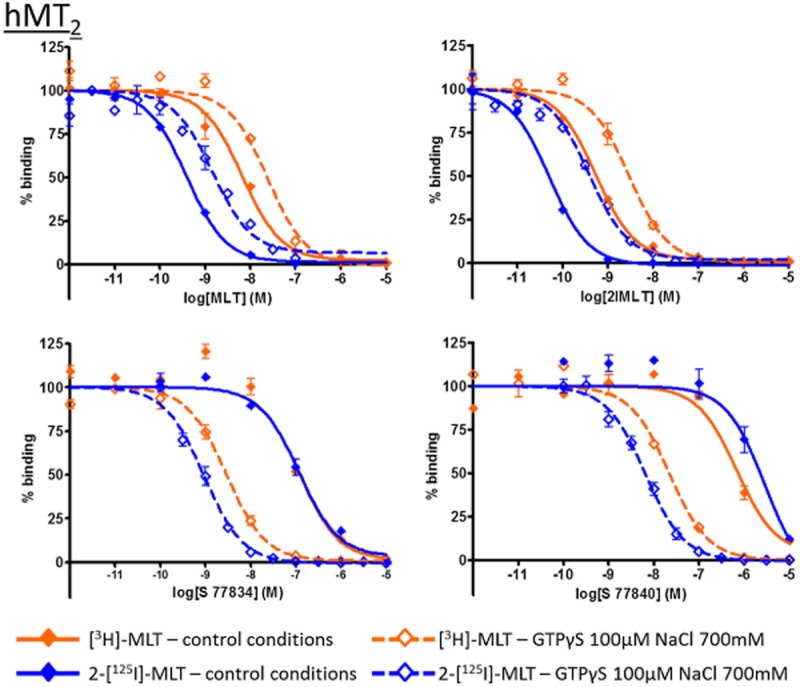
Inhibition curves for melatonin (MLT), 2-iodo-melatonin (2IMLT), S 77834 and S 77840 on hMT2 receptors with [3H]-MLT and 2-[125I]-MLT, in control condition or in presence of GTPγS 100 μM and NaCl 700 mM. Those individual IC50 curves are representative of experiments and illustrate the shift of IC50 values but not pKI in presence of GTPγS and NaCl.
Discussion
For practical reasons, the molecular pharmacology of the melatonin receptors has traditionally been elucidated using 2-[125I]-melatonin. Use of this radioligand has largely contributed to most of the discoveries made in the melatonin field, including our internal programme of drug discovery, which led to the approval in 2009 of Agomelatin® as a treatment for depression (Kasper et al., 2010).
Biphasic saturation and competition curves are not unknown, and have already been described for GPCRs. Biphasic curves using 2-[125I]-melatonin and double-affinity states have already been described in competition tests with melatonin, 2-iodo-melatonin (Witt-Enderby and Dubocovich, 1996), some melatoninergic compounds (Depreux et al., 1994) and guanyl nucleotides (Ying and Niles, 1991; Nonno et al., 1998). Most importantly, these studies were conducted on native tissues such as retina (Dubocovich, 1995), chick brain (Ying and Niles, 1991) and pars tuberalis (Depreux et al., 1994). It is important to note that most of these tissues and organs express both MT1 and MT2 receptors (Morgan et al., 1994; Jockers et al., 2008; Dubocovich et al., 2010), which can potentially be responsible for the detection of different binding sites. In the case of Witt-Enderby and Dubocovich (1996), dose–response experiments were run on intact and lysed whole cells (pKI values of 11.2 and 8.7, respectively); the sensitivity of the first site to GTPγS induced a conversion of the ‘super-high’ affinity site into the ‘high'-affinity site. The ‘super-high’ affinity IC50 was more in the range of hMT1 affinity as currently described in the literature, whereas the ‘high'-affinity state was in a nanomolar range (IC50 = 2.0 ± 0.47 nM) that is 1 log lower than our data (Tables 4 and 5); these conversions failed to appear in our saturation curves (Figure 5). Similar experiments were conducted by Nonno et al. in 1998 on the Mel1a receptor (i.e. MT1). Our use of 2-[125I]-melatonin did not reveal biphasic curves, which is in accordance with the majority of the published data. This ‘single-site’ profile was confirmed by our kinetics experiments, also in accordance with published data (Kennaway and Hugel, 1992; Witt-Enderby and Dubocovich, 1996) report on hMT1 and hMT2 receptors indicated one-parameter kinetic association. [3H]-melatonin kinetics exhibited biphasic curves that are in accordance with saturation experiments, with similar pKD values. Only hMT1 receptors at 37°C failed to show two-parameter association kinetics, which can be explained by the very fast association of the radioligand with this receptor. Our kinetics results contrast with the kinetic association studies of Browning et al. (2000). Our one-parameter profile can be explained by the density of kinetic points in the fast-association part of the curve. With only three points in this phase, these profiles can be sensitive enough to discriminate two association phases, as is probably the case for our hMT1 data at 37°C.
[3H]-melatonin allows confirmation of the hypothesis that melatonin receptors are spontaneously coupled to G-proteins
Our approach allowed us to demonstrate that melatonin receptors display two binding sites, as shown by [3H]-melatonin saturation studies conducted under a variety of experimental conditions encompassing inter-species differences in receptor sequence as well as differences in host cell, binding to cell membranes and binding to live cells. We recently reported that when expressed in recombinant systems, melatonin receptors undergo constitutive coupling to G-proteins (Devavry et al., 2012b). We therefore hypothesized that the two sites we report here were comparable to two states of receptor activation. Using GTPγS and NaCl as uncoupling agents (Birnbaumer et al., 1990; Nonno et al., 1998), we were able to convert the high-affinity site (site 1) into the lower-affinity site (site 2). We therefore conclude that the two binding sites observed in [3H]-melatonin saturation studies correspond to the coupled and uncoupled states of the receptor. Interestingly, saturation data indicated that human and ovine receptors have similar properties, while murine receptors may be slightly less responsive to agonists, with higher pKD values for both the coupled and uncoupled states and a higher proportion of precoupled receptors. It is interesting to consider this observation in the perspective of rat and mouse functional pharmacology, which demonstrates that agonists have 0.5–2.0 log units of difference between murine and human pEC50 values, with a higher potency for human receptors (Audinot et al., 2008; Devavry et al., 2012a).
Interestingly, saturation studies of 2-[125I]-melatonin revealed a single binding site for melatonin receptors, as described in this study and as reported most frequently (Reppert et al., 1994; Nonno et al., 1998; 1999; Audinot et al., 2003; Mailliet et al., 2004). This observation suggests that melatonin, but not 2-iodo-melatonin, is able to bind melatonin receptors in both the coupled and uncoupled states. However, this hypothesis is incompatible with our observation that both ligands have sub-nanomolar dissociation constants for [3H]-melatonin and 2-[125I]-melatonin on the MT1 and MT2 receptors, with the receptors mostly coupled (native state) or uncoupled (after GTPγS and NaCl treatment; see pKI values in Table 5). The explanation of this apparent discrepancy resides in the experimental difficulty of working with 2-[125I]-melatonin at concentrations above 1 nM. Our data show that this radioligand has very slow kinetics of association, but is unstable during longer incubations. Therefore, the data obtained in the present investigation result from the balance between the pharmacological properties of the radioligand and the relative instability of the radioligand. As a consequence, the pKI of 2-iodo-melatonin obtained against [3H]-melatonin differs substantially from its pKD: pKI = 12.12 and pKD1 = 10.56 for hMT1 and pKI = 11.40 and pKD1 = 10.11 for hMT2 (Table 3). Another visible consequence of the instability of 2-[125I]-melatonin during binding experiments is the difference in the pKI of 2-iodo-melatonin between competition experiments against [3H]-melatonin (pKI = 12.14 for hMT1 and pKI = 11.44 for hMT2) and against 2-[125I]-melatonin (pKI = 10.42 for hMT1 and pKI = 9.79 for hMT2). Interestingly, the chemically related ligand 2-bromomelatonin also shows this difference of 1.5 log units between pKI values obtained with the two radioligands (Table 3).
[3H]-melatonin exhibited cooperative binding to MT1 and MT2 receptors at low concentrations (data not shown). Cooperative binding requires that the ligand is able to access at least two different binding sites. The binding of the ligand to one site decreases its pKD for the second site, hence potentiating its recruitment to the protein. In practice, receptor dimerization is the most probable hypothesis for a GPCR to display cooperative binding. Melatonin receptors have been described to form homodimers (Ayoub et al., 2002; 2004), which may explain the cooperative binding observed with [3H]-melatonin. At this point, we have no hypothesis for why 2-[125I]-melatonin does not display such behaviour, but we are currently conducting studies of the heterodimerization of melatonin receptors, which should help understand how it may be linked to cooperative binding of melatonin, but not 2-iodo-melatonin.
To what extent do the MT1 and MT2 receptors differ?
It is important to outline the difference in behaviour of hMT1 and hMT2 receptors regarding coupled-to-uncoupled conversion using GTPγS and NaCl. These uncoupling agents efficiently converted coupled hMT2 to a population of uncoupled receptors, with a pKD value similar to the value that was as part of the natively uncoupled population, as well as a conserved total number of sites. In contrast, upon treatment with uncoupling agents, hMT1 receptors displayed a few inconsistencies that differed depending on the radioligand used. With [3H]-melatonin, the total number of binding sites was conserved, but the pKD showed a slight deviation of 0.5 log units from the value anticipated for site 2 under untreated conditions. Conversely, 2-[125I]-melatonin saturation experiments revealed that upon treatment with uncoupling agents, hMT1 displayed a pKD in agreement with the overall pattern represented in Figure 6, but most binding sites were lost. Our assay development data indicated that treatment of hMT1 receptors with either GTPγS or NaCl yielded partial conversion of the receptor population into the uncoupled state (data not shown). Most binding sites were maintained under these conditions, suggesting that while the uncoupling agents used here efficiently uncouple the G-proteins, they are likely also to affect the conformation and the stability of the receptor, obviously with more consequences for hMT1 than for hMT2 receptors. This scenario is consistent with our recent difficulty in solubilizing and purifying hMT1 as compared with other GPCRs, which proved to be less fragile under demanding biochemical conditions.
The pKD values of [3H]-melatonin and 2-[125I]-melatonin binding to hMT1 and hMT2 receptors are presented in schematic form in Figure 10, which puts these data into perspective. Although the two radioligands differed in their ability to trace the resting, uncoupled state of the melatonin receptors, the overall pKD values showed striking overall consistency. The use of uncoupling agents revealed that resting hMT1 and hMT2 receptors share the same pKD for each radioligand. The active, coupled states of two melatonin receptors differed, with hMT1 having 1 log unit change of pKD for each radioligand, while hMT2 showed 0.5 log unit of difference. These data suggest that hMT1 and hMT2 receptors have similar pharmacologies as long as they are in the resting state, and that their difference appears, and is revealed, by G-protein coupling. In support of this hypothesis, we observed that the pharmacology of the resting state was well correlated between the two receptors, while the same ligands displayed classical differences in potency (Tables 4 and 5). Similar pKD values for [3H]-melatonin for the resting-state melatonin receptors were consistently observed across species (human, sheep, mouse and rat). In the coupled state, murine receptors showed a 0.5–1.0-log unit difference in pKD between the two receptors, similar to that observed with human receptors. Additionally, ovine receptors and human receptors expressed in a neuronal cell line displayed similar pKD values, suggesting that in these cases, and perhaps in vivo, the melatonin receptor subtypes do not significantly differ in their ability to recognize their natural ligand.
Figure 10.
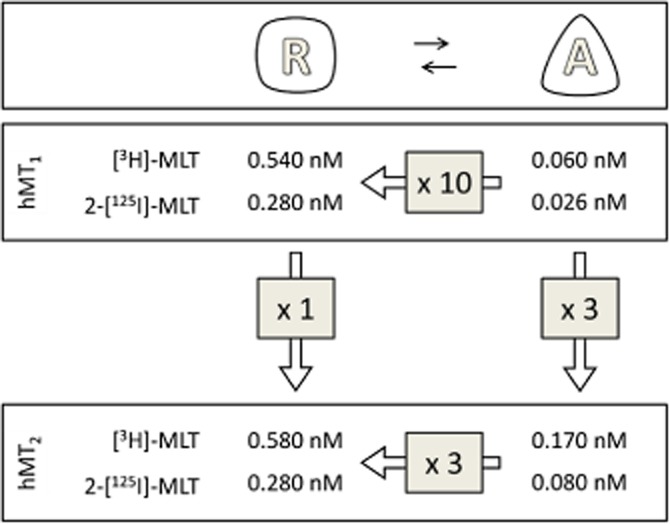
Schematic representation of the various states of melatonin receptors.
Finally, we documented our model of coupled and uncoupled hMT receptors with a set of ligands possessing various functional properties, as assessed by [35S]-GTPγS binding in previous studies (Ersahin et al., 2002; Devavry et al., 2012b). Interestingly, the inverse agonists tended to display a strong bias toward the uncoupled state, with a 1.5–2.0-log unit difference in pKI with the coupled state of the receptor. Similarly, agonists tended to exhibit higher pKI values for the coupled states of hMT1 and hMT2 receptors. These two observations are more obvious with hMT1 than with hMT2 receptors, and are consistent with the general model of Monod–Wyman–Changeux in which the affinity of a ligand for a given state/conformation of a receptor drives the equilibrium of the receptor population to a stabilization of that state, leading agonists to display better affinity to the coupled state of the receptor and inverse agonists to display a better affinity for the uncoupled state.
In conclusion, in this report, we confirm our previous findings that melatonin receptors expressed in heterologous systems undergo spontaneous coupling and reside under a pre-activated conformation in the membrane. As a consequence, the molecular pharmacology described in these models is that of the coupled receptor. The radioligand [3H]-melatonin proved to be instrumental in this study; despite the advantages of 2-[125I]-melatonin in terms of sensitivity, the tritiated physiological ligand proved to be more relevant to fully describe the molecular pharmacology of the melatonin receptors as this radioligand is identical in its chemical structure to the endogenous receptor ligand and as it is able to bind both states, activated or not, of the GPCRs, a feature not seen with 2-[125I]-MLT. We attempted, in this work, to investigate the coupling state of the melatonin receptors in a physiological environment, but despite our expertise in the preparation of pars tuberalis, the very low number of sites (30–60 fmol·mg−1; Piketty and Pelletier, 1993) and the difficulty in obtaining this region did not allow us complete that investigation. The in vivo relevance of our observations therefore must be addressed in the future.
Abbreviations
- 2IMLT
2-iodomelatonin
- EC50
radioligand concentration at 50% of the maximum effect
- KD
dissociation constant
- Bmax
maximum binding of the radioligand
Conflict of interests
None.
References
- Acuna-Castroviejo D, Reiter RJ, Menendez-Pelaez A, Pablos MI, Burgos A. Characterization of high-affinity melatonin binding sites in purified cell nuclei of rat liver. J Pineal Res. 1994;16:100–112. doi: 10.1111/j.1600-079x.1994.tb00089.x. [DOI] [PubMed] [Google Scholar]
- Alexander SPH, et al. The Concise Guide to PHARMACOLOGY 2013/14: Overview. Br J Pharmacol. 2013;170:1449–1867. doi: 10.1111/bph.12444. [DOI] [PMC free article] [PubMed] [Google Scholar]
- Audinot V, Mailliet F, Lahaye-Brasseur C, Bonnaud A, Le Gall A, Amosse C, et al. New selective ligands of human cloned melatonin MT1 and MT2 receptors. Naunyn Schmiedebergs Arch Pharmacol. 2003;367:553–561. doi: 10.1007/s00210-003-0751-2. [DOI] [PubMed] [Google Scholar]
- Audinot V, Bonnaud A, Grandcolas L, Rodriguez M, Nagel N, Galizzi JP, et al. Molecular cloning and pharmacological characterization of rat melatonin MT1 and MT2 receptors. Biochem Pharmacol. 2008;75:2007–2019. doi: 10.1016/j.bcp.2008.02.022. [DOI] [PubMed] [Google Scholar]
- Ayoub MA, Couturier C, Lucas-Meunier E, Angers S, Fossier P, Bouvier M, et al. Monitoring of ligand-independent dimerization and ligand-induced conformational changes of melatonin receptors in living cells by bioluminescence resonance energy transfer. J Biol Chem. 2002;277:21522–21528. doi: 10.1074/jbc.M200729200. [DOI] [PubMed] [Google Scholar]
- Ayoub MA, Levoye A, Delagrange P, Jockers R. Preferential formation of MT1/MT2 melatonin receptor heterodimers with distinct ligand interaction properties compared to MT2 homodimers. Mol Pharmacol. 2004;66:312–321. doi: 10.1124/mol.104.000398. [DOI] [PubMed] [Google Scholar]
- Birnbaumer L, Abramowitz J, Brown AM. Receptor-effector coupling by G proteins. Biochim Biophys Acta. 1990;1031:163–224. doi: 10.1016/0304-4157(90)90007-y. [DOI] [PubMed] [Google Scholar]
- Bradford MM. A rapid and sensitive method for the quantitation of microgram quantities of protein utilizing the principle of protein-dye binding. Anal Biochem. 1976;72:248–254. doi: 10.1006/abio.1976.9999. [DOI] [PubMed] [Google Scholar]
- Browning C, Beresford I, Fraser N, Giles H. Pharmacological characterization of human recombinant melatonin mt(1) and MT(2) receptors. Br J Pharmacol. 2000;129:877–886. doi: 10.1038/sj.bjp.0703130. [DOI] [PMC free article] [PubMed] [Google Scholar]
- Cheng YC, Prussof WH. Relationship between the inhibition constant (Ki) and the concentration of inhibitor which causes 50% inhibition (IC50) of an enzymatic reaction. Biochem Pharmacol. 1973;22:3099–3108. doi: 10.1016/0006-2952(73)90196-2. [DOI] [PubMed] [Google Scholar]
- Cogé F, Guenin SP, Fery I, Migaud M, Devavry S, Slugocki C, et al. The end of a myth: cloning and characterization of the ovine melatonin MT(2) receptor. Br J Pharmacol. 2009;158:1248–1262. doi: 10.1111/j.1476-5381.2009.00453.x. [DOI] [PMC free article] [PubMed] [Google Scholar]
- Depreux P, Lesieur D, Mansour HA, Morgan P, Howell HE, Renard P, et al. Synthesis and structure-activity relationships of novel naphthalenic and bioisosteric related amidic derivatives as melatonin receptor ligands. J Med Chem. 1994;37:3231–3239. doi: 10.1021/jm00046a006. [DOI] [PubMed] [Google Scholar]
- Devavry S, Legros C, Brasseur C, Cohen W, Guenin SP, Delagrange P, et al. Molecular pharmacology of the mouse melatonin receptors MT(1) and MT(2) Eur J Pharmacol. 2012a;677:15–21. doi: 10.1016/j.ejphar.2011.12.009. [DOI] [PubMed] [Google Scholar]
- Devavry S, Legros C, Brasseur C, Delagrange P, Spadoni G, Cohen W, et al. Description of the constitutive activity of cloned human melatonin receptors hMT(1) and hMT(2) and discovery of inverse agonists. J Pineal Res. 2012b;53:29–37. doi: 10.1111/j.1600-079X.2011.00968.x. [DOI] [PubMed] [Google Scholar]
- Drew JE, Barrett P, Mercer JG, Moar KM, Canet E, Delagrange P, et al. Localization of the melatonin-related receptor in the rodent brain and peripheral tissues. J Neuroendocrinol. 2001;13:453–458. doi: 10.1046/j.1365-2826.2001.00651.x. [DOI] [PubMed] [Google Scholar]
- Dubocovich ML. Melatonin receptors: are there multiple subtypes? Trends Pharmacol Sci. 1995;16:50–56. doi: 10.1016/s0165-6147(00)88978-6. [DOI] [PubMed] [Google Scholar]
- Dubocovich ML, Delagrange P, Krause DN, Sugden D, Cardinali DP, Olcese J. International Union of Basic and Clinical Pharmacology. LXXV. Nomenclature, classification, and pharmacology of G protein-coupled melatonin receptors. Pharmacol Rev. 2010;62:343–380. doi: 10.1124/pr.110.002832. [DOI] [PMC free article] [PubMed] [Google Scholar]
- Ersahin C, Masana MI, Dubocovich ML. Constitutively active melatonin MT(1) receptors in male rat caudal arteries. Eur J Pharmacol. 2002;439:171–172. doi: 10.1016/s0014-2999(02)01407-3. [DOI] [PubMed] [Google Scholar]
- Ettaoussi M, Sabaouni A, Pérès B, Landagaray E, Nosjean O, Boutin JA, et al. 2013. Synthesis and pharmacological evaluation of a series of the agomelatine analogues as melatonin MT1 /MT2 agonist and 5-HT2C antagonist. ChemMedChem. in press. [DOI] [PubMed]
- Jockers R, Maurice P, Boutin JA, Delagrange P. Melatonin receptors, heterodimerization, signal transduction and binding sites: what's new? Br J Pharmacol. 2008;154:1182–1195. doi: 10.1038/bjp.2008.184. [DOI] [PMC free article] [PubMed] [Google Scholar]
- Kasper S, Hajak G, Wulff K, Hoogendijk WJ, Montejo AL, Smeraldi E, et al. Efficacy of the novel antidepressant agomelatine on the circadian rest–activity cycle and depressive and anxiety symptoms in patients with major depressive disorder: a randomized, double-blind comparison with sertraline. J Clin Psychiatry. 2010;71:109–120. doi: 10.4088/JCP.09m05347blu. [DOI] [PubMed] [Google Scholar]
- Kennaway DJ, Hugel HM. Melatonin binding sites: are they receptors? Mol Cell Endocrinol. 1992;88:C1–C9. doi: 10.1016/0303-7207(92)90002-n. [DOI] [PubMed] [Google Scholar]
- Kennaway DJ, Hugel HM, Rowe SA. Characterization of the chicken brain melatonin-binding protein using iodinated and tritiated ligands. J Pineal Res. 1994;17:137–148. doi: 10.1111/j.1600-079x.1994.tb00125.x. [DOI] [PubMed] [Google Scholar]
- Legros C, Matthey U, Grelak T, Pedragona-Moreau S, Hassler W, Yous S, et al. New radioligands for describing the molecular pharmacology of MT1 and MT2 melatonin receptors. Int J Mol Sci. 2013;14:8948–8962. doi: 10.3390/ijms14058948. [DOI] [PMC free article] [PubMed] [Google Scholar]
- Mailliet F, Audinot V, Malpaux B, Bonnaud A, Delagrange P, Migaud M, et al. Molecular pharmacology of the ovine melatonin receptor: comparison with recombinant human MT1 and MT2 receptors. Biochem Pharmacol. 2004;67:667–677. doi: 10.1016/j.bcp.2003.09.037. [DOI] [PubMed] [Google Scholar]
- Masana MI, Dubocovich ML. Melatonin receptor signaling: finding the path through the dark. Sci STKE. 2001;2001:PE39. doi: 10.1126/stke.2001.107.pe39. [DOI] [PubMed] [Google Scholar]
- Mazzucchelli C, Pannacci M, Nonno R, Lucini V, Fraschini F, Stankov BM. The melatonin receptor in the human brain: cloning experiments and distribution studies. Brain Res Mol Brain Res. 1996;39:117–126. doi: 10.1016/0169-328x(96)00017-4. [DOI] [PubMed] [Google Scholar]
- Morgan PJ, Barrett P, Howell HE, Helliwell R. Melatonin receptors: localization, molecular pharmacology and physiological significance. Neurochem Int. 1994;24:101–146. doi: 10.1016/0197-0186(94)90100-7. [DOI] [PubMed] [Google Scholar]
- Niles LP. [3H] melatonin binding in membrane and cytosol fractions from rat and calf brain. J Pineal Res. 1987;4:89–98. doi: 10.1111/j.1600-079x.1987.tb00844.x. [DOI] [PubMed] [Google Scholar]
- Nonno R, Lucini V, Pannacci M, Mazzucchelli C, Angeloni D, Fraschini F, et al. Pharmacological characterization of the human melatonin Mel1a receptor following stable transfection into NIH3T3 cells. Br J Pharmacol. 1998;124:485–492. doi: 10.1038/sj.bjp.0701860. [DOI] [PMC free article] [PubMed] [Google Scholar]
- Nonno R, Fraschini F, Stankov BM. Methods for the evaluation of drug action at the human melatonin receptor subtypes. Biol Signals Recept. 1999;8:32–40. doi: 10.1159/000014566. [DOI] [PubMed] [Google Scholar]
- Piketty V, Pelletier J. Melatonin receptors in the lamb pars tuberalis/median eminence throughout the day. Neuroendocrinology. 1993;58:359–365. doi: 10.1159/000126563. [DOI] [PubMed] [Google Scholar]
- Reppert SM, Weaver DR, Ebisawa T. Cloning and characterization of a mammalian melatonin receptor that mediates reproductive and circadian responses. Neuron. 1994;13:1177–1185. doi: 10.1016/0896-6273(94)90055-8. [DOI] [PubMed] [Google Scholar]
- Reppert SM, Godson C, Mahle CD, Weaver DR, Slaugenhaupt SA, Gusella JF. Molecular characterization of a second melatonin receptor expressed in human retina and brain: the Mel1b melatonin receptor. Proc Natl Acad Sci U S A. 1995;92:8734–8738. doi: 10.1073/pnas.92.19.8734. [DOI] [PMC free article] [PubMed] [Google Scholar]
- Vakkuri O, Lamsa E, Rahkamaa E, Ruotsalainen H, Leppaluoto J. Iodinated melatonin: preparation and characterization of the molecular structure by mass and 1H NMR spectroscopy. Anal Biochem. 1984;142:284–289. doi: 10.1016/0003-2697(84)90466-4. [DOI] [PubMed] [Google Scholar]
- Williams LM, Hannah LT, Hastings MH, Maywood ES. Melatonin receptors in the rat brain and pituitary. J Pineal Res. 1995;19:173–177. doi: 10.1111/j.1600-079x.1995.tb00186.x. [DOI] [PubMed] [Google Scholar]
- Williams LM, Hannah LT, Bassett JM. Melatonin receptors in neonatal pig brain and pituitary gland. J Pineal Res. 1999;26:43–49. doi: 10.1111/j.1600-079x.1999.tb00565.x. [DOI] [PubMed] [Google Scholar]
- Witt-Enderby PA, Dubocovich ML. Characterization and regulation of the human ML1A melatonin receptor stably expressed in Chinese hamster ovary cells. Mol Pharmacol. 1996;50:166–174. [PubMed] [Google Scholar]
- Ying SW, Niles LP. 3-[(3-cholamidopropyl)dimethylammonio]-1-propane sulfonate-solubilized binding sites for 2-[125I]iodomelatonin in chick brain retain sensitivity to guanine nucleotides. J Neurochem. 1991;56:580–586. doi: 10.1111/j.1471-4159.1991.tb08189.x. [DOI] [PubMed] [Google Scholar]
- Zawilska JB, Skene DJ, Arendt J. Physiology and pharmacology of melatonin in relation to biological rhythms. Pharmacol Rep. 2009;61:383–410. doi: 10.1016/s1734-1140(09)70081-7. [DOI] [PubMed] [Google Scholar]
- Zlotos DP, Attia MI, Julius J, Sethi S, Witt-Enderby PA. 2-[(2,3-dihydro-1H-indol-1-yl)methyl]melatonin analogues: a novel class of MT2-selective melatonin receptor antagonists. J Med Chem. 2009;52:826–833. doi: 10.1021/jm800974d. [DOI] [PubMed] [Google Scholar]