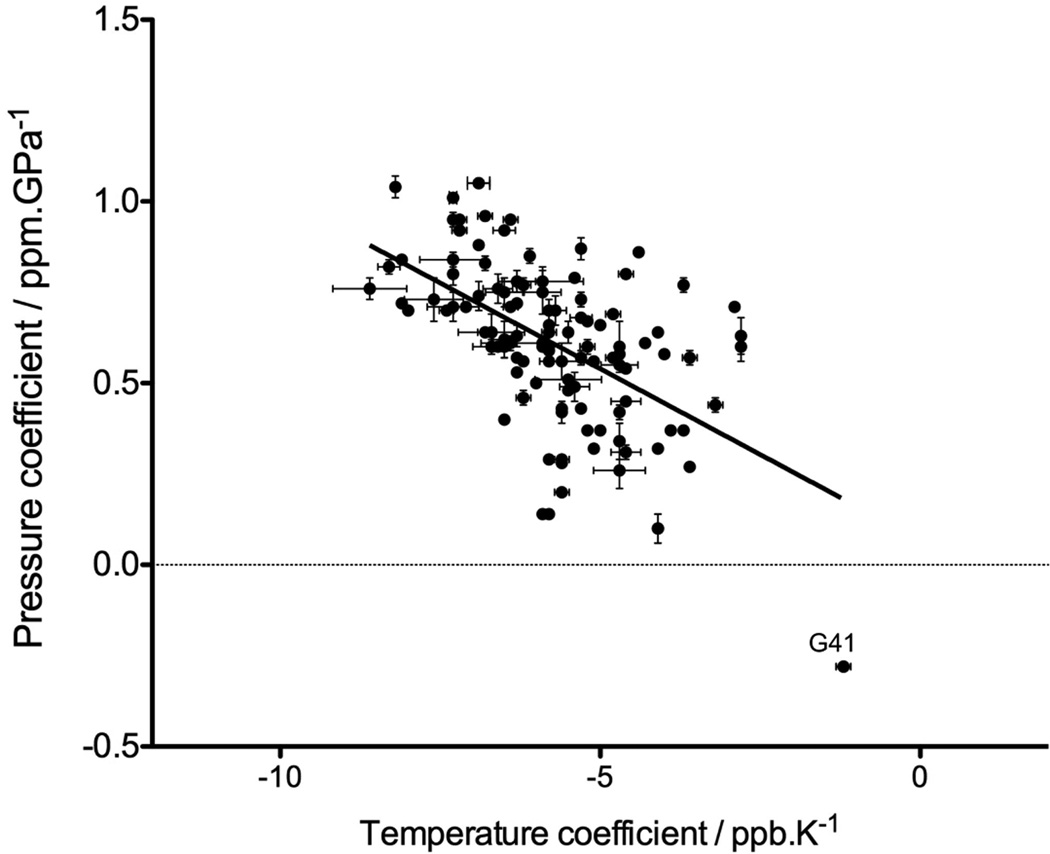
Figure 3.
Correlation between the 1HN pressure and temperature linear coefficients, measured for a 15N/13C enriched sample of N-acetylated α-synuclein at pH 6.0. The pressure coefficients were extracted from the fit of the 1HN chemical shifts as a function of pressure, between 1 bar and 2500 bar, at 288 K, while the temperature coefficients were calculated from a linear least squares fit of the 1HN chemical shifts at 283 K, 288 K and 293 K, under atmospheric pressure.

