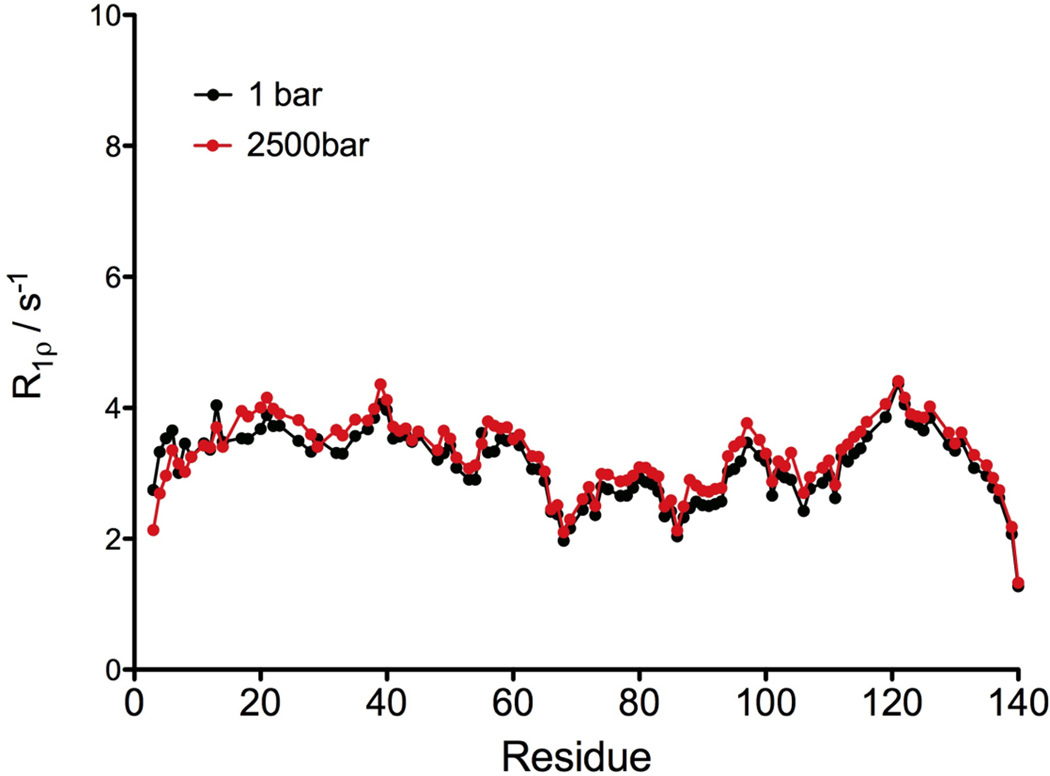
Figure 4.
15N R1ρ relaxation rates measured using a 1.3 kHz RF field at 60.8 MHz 15N frequency, at 1 bar (black) and 2500 bar (red), displayed as a function of the protein sequence. The sample conditions are: 0.5 mM of 15N enriched non-acetylated α-synuclein in 20 mM sodium phosphate at pH 6.0. All the experiments were performed at 288 K.

