Abstract
Nanoparticle morphology has been shown to affect cellular uptake, but there are few studies investigating the impact of particle shape on biologic drug delivery. Recently, our group synthesized a series of N-(2-hydroxypropyl) methacrylamide (HPMA)-oligolysine brush polymers for nucleic acid delivery that varied in oligolysine peptide length and polymer molecular weight. Interestingly, a 50% longer peptide (K15) transfected very poorly compared to the optimized polymer comprised of K10 peptide despite similar chemical composition and molecular weight. We hypothesized that differences in particle morphology contributed to the differences in plasmid DNA delivery. We found that particles formed with plasmid DNA and a polymer with the longer oligolysine peptide (pHK15) had larger aspect ratios than particles formed with optimized polymer (pHK10). Even though both formulations showed similar percentages of cellular association, particles of a higher aspect ratio were internalized to a lesser extent. Furthermore, the rod-like particles accumulated more in endosomal/lysosomal compartments, leading to delayed nuclear delivery. Other parameters, such as particle surface charge, unpackaging ability, uptake mechanism, intracellular trafficking, nor the presence of heparan sulfate proteoglycans did not significantly differ between the two polymer formulations. These results indicate that, for this system, polyplex morphology primarily impacts nucleic acid delivery efficiency through differences in cellular internalization rates.
Keywords: particle morphology, polyplexes, nucleic acid delivery, lysine peptides, HPMA
Biologic drugs such as proteins, peptides, and nucleic acids are often encapsulated in delivery vehicles that both protect against premature degradation and facilitate uptake. Vehicles containing drugs with intracellular targets are generally internalized by cells through vesicular uptake mechanisms.1,2 The rate and mechanism of cellular internalization of these vehicles depends on the target cell type as well as on the physicochemical properties of the vehicles. The influence of particle shape and size on internalization mechanism has been studied in detail for several model nanoparticle systems, such as nanoparticles composed of polystyrene,3 poly(methacrylates),4 silica,5,6 gold,7,8 and carbon.9 However, there are few studies that have probed the influence of particle shape on the effectiveness of biologic drug delivery.3,5
Our group recently synthesized a series of HPMA-co-oligolysine comb-like polymers for nucleic acid delivery.10 We found that two polymers with similar chemical composition but different comb lengths showed drastically different gene transfer efficiencies. Since several reports have indicated that polylysine peptides of different lengths complexed DNA into varying particle shapes,11,12 we hypothesized that polycation structure could impact supramolecular morphology after complexation with a polyanion (termed “polyplexes”). Furthermore, the difference in particle morphology could affect downstream transfection efficiency. Particle size and shape has been shown to affect internalization rates for solid particles;3,4,6,13 however, it is unknown how the particle morphology of polyplexes influences cellular uptake and intracellular trafficking. In this work, the role of particle morphology on the various steps of intracellular nanoparticle delivery is investigated and quantified through a detailed analysis of uptake efficiency, endocytosis pathway, subcellular distribution, intracellular trafficking, and gene transfer efficiency. We find that particle morphology significantly impact rates of cellular uptake, but has minor influence on subsequent intracellular trafficking and processing. These results highlight the importance of considering polyplex morphology when designing nanoparticles for intracellular delivery.
RESULTS AND DISCUSSION
Polyplex morphology assessed by transmission electron microscopy (TEM)
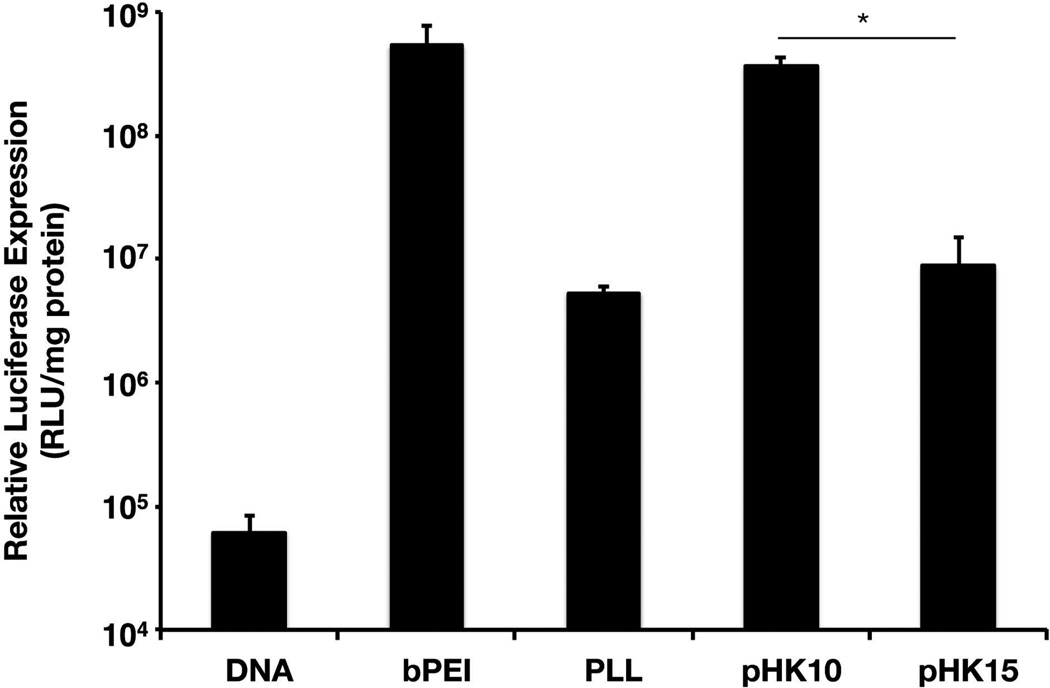
pHK10 and pHK15 are comb-like HPMA-co-oligolysine polymers with similar chemical composition and molecular weight but different oligolysine brush length. The polymers are synthesized by reversible addition-fragmentation chain-transfer (RAFT) polymerization to provide high control over polymer molecular weight and composition.10 Polylysine, a commercially-available linear polymer, was used for comparison. The polymer properties are summarized in Table 1. Despite the similarities in material composition and molecular weight, pHK10 and pHK15 showed significant differences in gene transfer efficiencies to cultured cells (Figure 1). At an amine to phosphate (N/P) ratio of 5, pHK10/DNA complexes (polyplexes) transfected HeLa cells as well as polyplexes with bPEI, the most commonly used cationic polymer for nonviral gene delivery, and with 42.3-fold higher transfection efficiency than pHK15 polyplexes; pHK15 polyplexes transfected similarly to PLL.
Table 1.
Properties of HPMA-oligolysine polymers.
| Polymer | Targeted Mn (kD) |
Determined Mn (kD)a |
Mw/Mna | mol % oligolysine monomerb |
mmol lysine/ g polymerb |
|---|---|---|---|---|---|
| pHK10 | 61.9 | 65.5 | 1.14 | 20.5 | 4.9 |
| pHK15 | 61.4 | 74.4 | 1.21 | 14.0 | 5.0 |
Values determined by SEC coupled with laser light scattering and dRI detection.
Mol% of oligolysine and mmol lysine per gram polymer determined by amino acid analysis.
Figure 1.
Transfection efficiency of polymers in HeLa cells. HeLa cells were incubated with polyplexes formulated with bPEI, PLL, pHK10, or pHK15 and DNA (1 µg) for 4 h in serum-free conditions, replenished with complete media, and assessed for luciferase activity at 48 h. The data are represented as the mean ± S.D., n = 3. (*) denotes p ≤ 0.05, as determined by a twotailed, unpaired Student’s t-test with unequal variance.
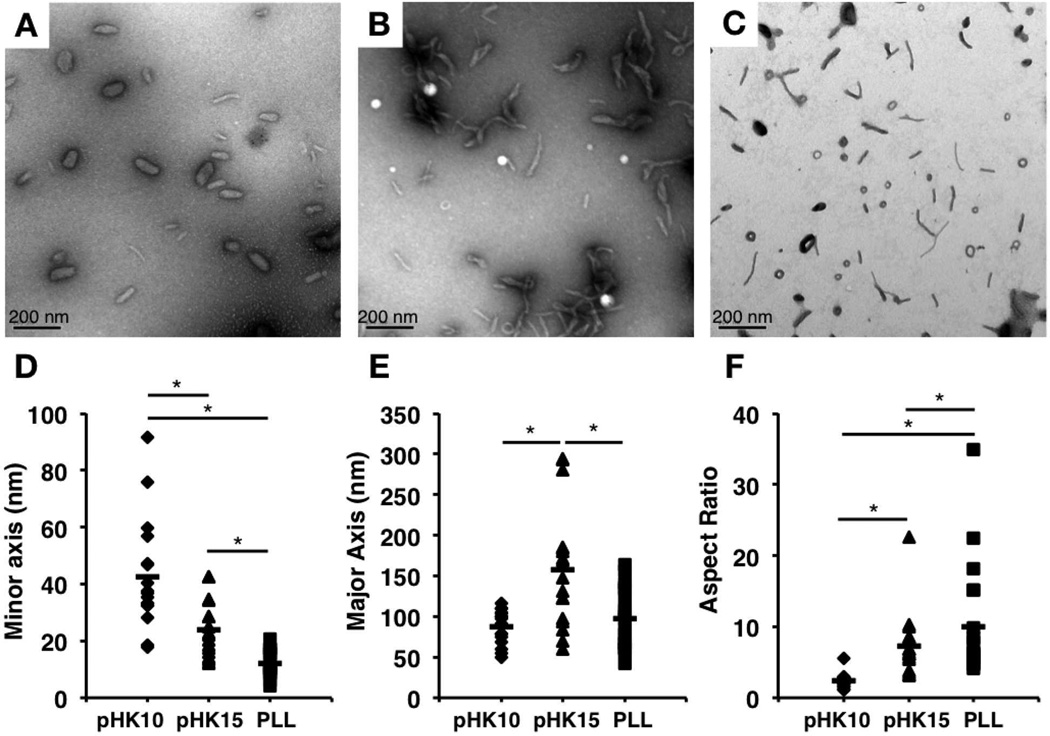
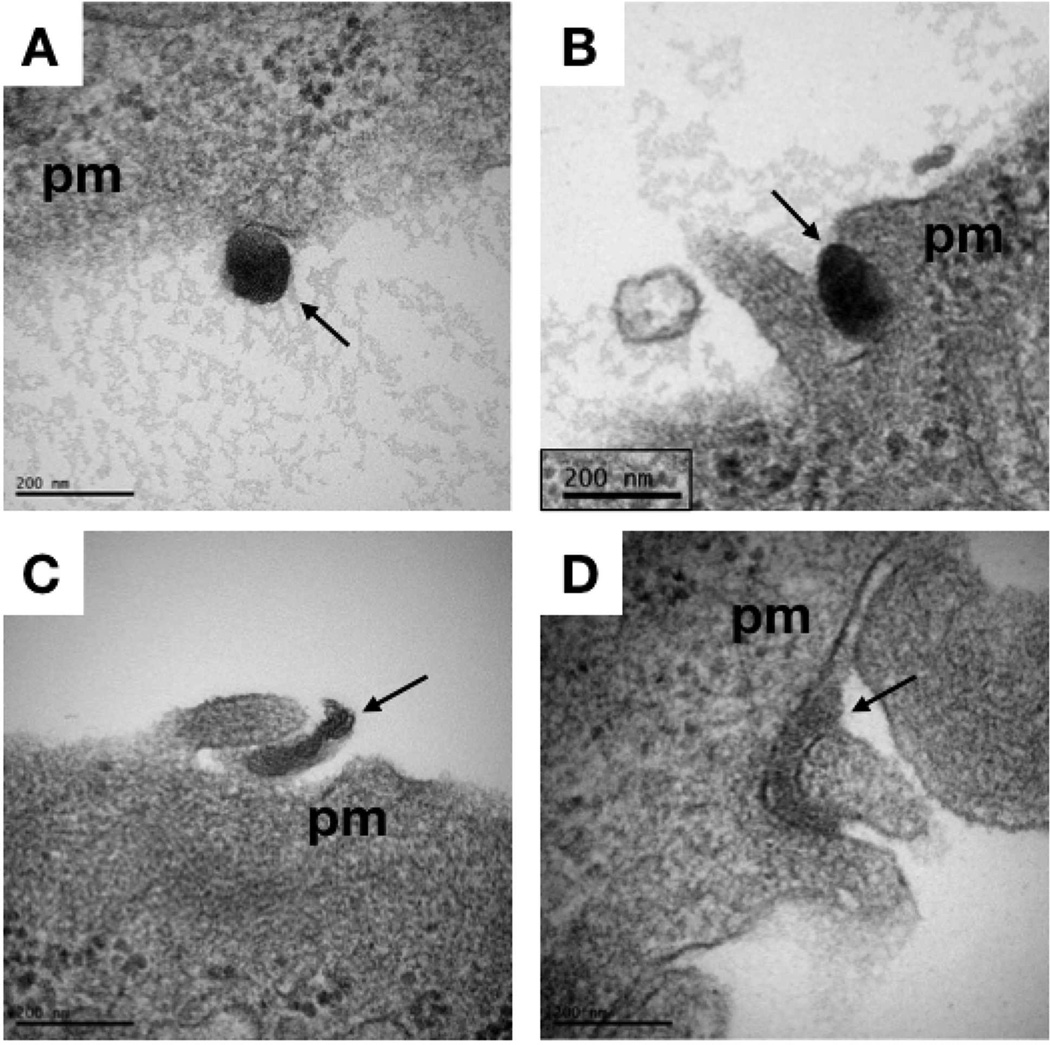
Previous reports have indicated a difference in polyplex morphology as a function of oligolysine length, ranging from loosely-complexed particles11 to linear rods and oval-shaped particles12. Therefore, the polyplex morphology of pHK10, pHK15, and PLL polyplexes, formulated at N/P 5, was assessed by TEM. pHK10 polyplexes formed oblong particles, ~25 by ~74 nm (Figure 2A), while pHK15 particles formed longer rod-like particles (Figure 2B), with a width of ~18 nm and length of ~102 nm, toroids, or twisted particles. For comparison, PLL polyplexes formed either long, thin rods, around 38–191 nm in length and 6–30 nm in width (~67% of all measured particles), or toroids, ~21–52 nm in diameter (~33% of all measured particles) (Figure 2C). The length of the minor axis decreased with increasing oligolysine length (Figure 2D), while the length of the major axis was larger in pHK15 particles than pHK10 (Figure 2E). The geometric mean of the aspect ratio, defined as the length of the major axis divided by the length of the minor axis, increased with oligolysine length (Figure 2F), and was 2.9, 5.6, and 6.3, for pHK10, pHK15, and PLL (rods only) particles, respectively. These results somewhat differ than prior measurements of the hydrodynamic particle diameters, which indicated that HPMA-oligolysine copolymers formed slightly larger particles in water (100–150 nm),10 possibly due to the non-spherical morphology of the lysine-based polymers. Furthermore, similar differences in polyplex morphology between pHK10 (more spherical) and pHK15 (more rod-like) formulations were observed by imaging polyplex uptake in cultured cells by transmission electron microscopy (Figure 3), thereby confirming morphology differences between the two formulations under transfection conditions. Polyplexes of a twisted morphology were also observed with PEGylated PLL dendrimers;14 however, the researchers note that no distinct relationship between particle morphology and transfection was observed.
Figure 2.
Transmission electron micrographs of lysine-based polymers. Particle morphology of (A) pHK10, (B) pHK15, and (C) PLL in water. The length of the (D) minor axis and (E) major axis were calculated for n = 31 for pHK10, n = 39 for pHK15, and n = 44 for PLL. (F) Aspect ratio was calculated by dividing the length of the major axis by the length of the minor axis. The line denotes the mean of each set of values. Statistical significance was determined using a Kruskall-Wallis test, where (*) p < 0.05.
Figure 3.
Transmission electron microscopy of polyplex interaction with HeLa cells. HeLa cells were treated with polyplexes under serum-free conditions for 1 hr prior to fixation and preparation for TEM. Arrows indicated pHK10 (A,B) and pHK15 (C,D) polyplexes at the plasma membrane (“pm”) in the process of being endocytosed. Scale bar indicates 200 nm.
Cellular uptake of polyplexes over time
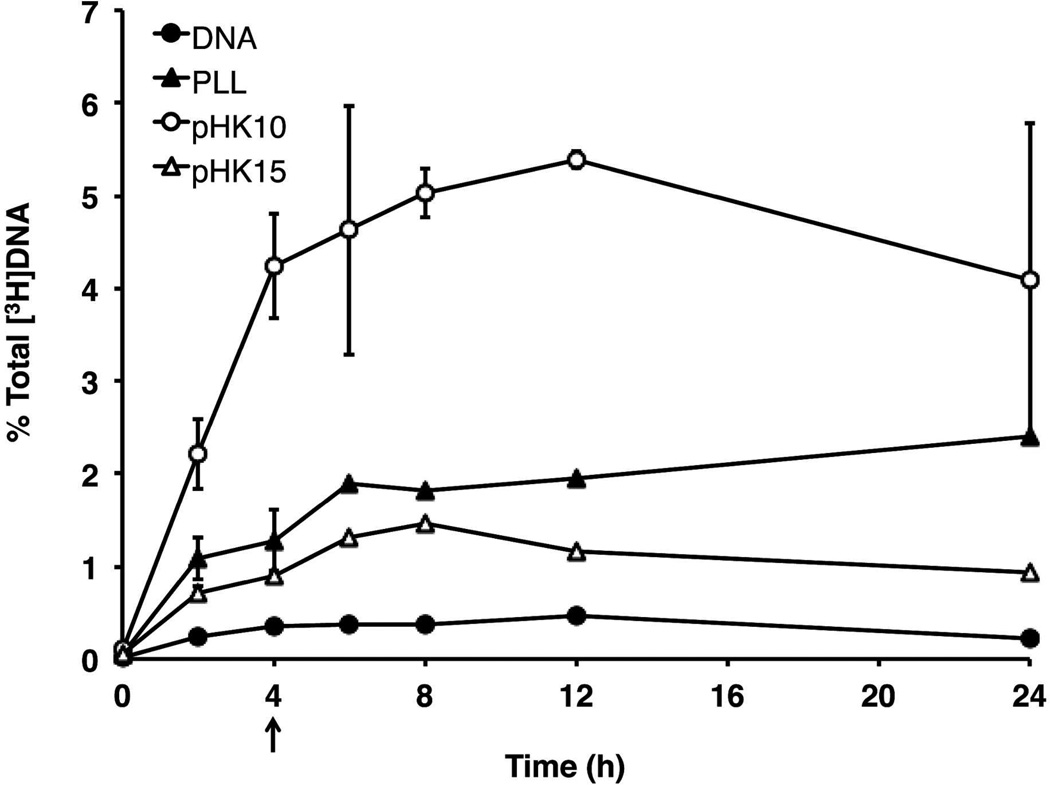
Since particle morphology has been shown to affect the internalization pathway and efficiency of uptake into mammalian cells,5 the kinetics of pHK10, pHK15 and PLL polyplex uptake was determined using polyplexes formulated with radiolabeled plasmid DNA (Figure 4). Plasmid DNA was radiolabeled to provide a sensitive and quantitative method for detection. Cells were incubated with polyplexes for 4 h, and then washed and replaced with media for an additional 2, 4, 8, or 20 h. Internalization of polyplex after a 2 h incubation was also measured. After each time point, cells were incubated with CellScrub to reduce extracellularly-bound polyplexes. pHK10 showed the highest cell association and cell internalization after both 2 and 4 h compared to pHK15 and PLL. For example, after a 4 h incubation, pHK10 polyplex internalization efficiency was 4.09 ± 0.54%, followed by PLL (1.22 ± 0.33%), pHK15 (0.86 ± 0.04%), and DNA (0.32 ± 0.06%). Interestingly, the amount of internalized DNA continued to increase after polyplex removal at 4 h, suggesting continued internalization of surface-bound complexes not removed by CellScrub. At 24 h, pHK10 showed the highest uptake efficiency (3.73%), followed by PLL (2.19%), pHK15 (0.85%), and DNA (0.20%). A complete breakdown of polyplex distribution (solution, cell-associated, and internalized) is shown in Supplemental Figure 1. The surface charge of particles were also determined by zeta potential measurements since cationic nanoparticles have been shown to bind to mammalian cells through electrostatic interactions. No significant differences were measured in the zeta potential of pHK10 and pHK15 polyplexes (Supplemental Figure 2). Therefore, these results suggest that larger aspect ratios may reduce the rates of cellular internalization despite efficient cellular association.
Figure 4.
Cellular uptake of [3H]DNA/polymer complexes over time. HeLa cells were treated with [3H]DNA/polymer complexes (containing 1 µg DNA) for 4 h under serum-free conditions, rinsed, and replaced with complete media for up to 20 additional h. The amount of internalized DNA as a function of total radioactivity (% total DNA) was determined for DNA alone (closed circles), PLL polyplexes (closed triangles), pHK10 polyplexes (open circles), and pHK15 polyplexes (open triangles). The data are represented as the mean ± S.D., n = 3.
Role of heparan sulfate proteoglycans on cellular uptake and transfection
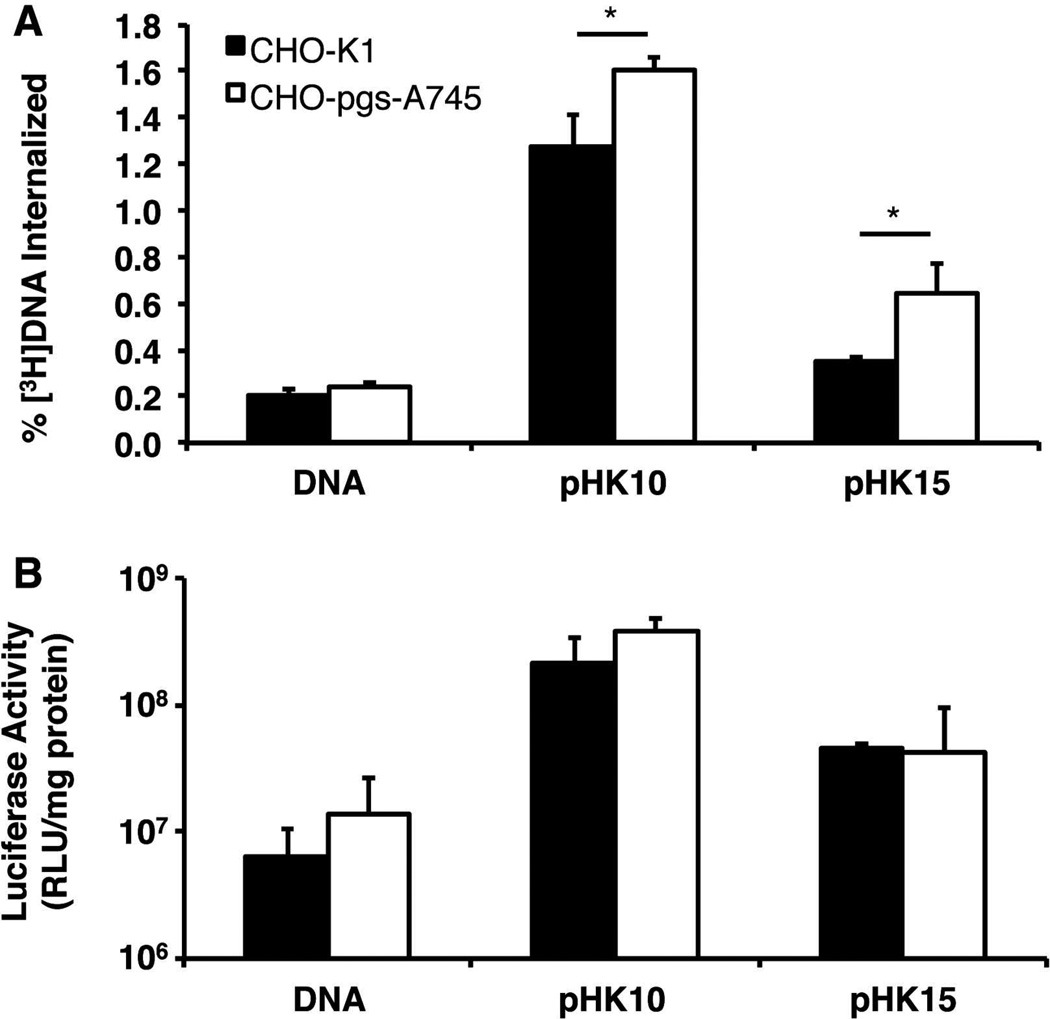
Heparan sulfate proteoglycans (HSPGs) have been demonstrated to play an important role in the non-specific uptake and processing of cationic lipids and polyplexes.15–17 In order to determine if differences in polyplex morphology affect electrostatic interactions with HSPGs, cellular uptake of polyplexes formulated with [3H]DNA was assessed in wild-type Chinese hamster ovary (CHO) cell lines normally expressing HSPGs on their extracellular surface (CHO-K1) or mutant CHO cells lacking the presence of HSPGs (CHO-pgs-A745).16 Surprisingly, polyplex uptake was 20.2% and 45.8% lower in wild-type CHO-K1 compared to CHO-pgs-A745 for pHK10 and pHK15, respectively, although gene expression levels were similar between the two cell lines (Figure 5A) in contrast to observations seen with other lysine-based vectors.18,19 As observed in Figure 1, the transfection efficiency of pHK15 polyplexes was 79–89% lower than that of pHK10 polyplexes in both CHO cell lines (Figure 5B). Interestingly, the decreased cellular uptake of polyplexes in wild-type CHO cells did not translate to decreases in transfection efficiency. Therefore, HSPGs do not play a significant role in internalization of HPMA-co-oligolysine-based particles in these cultured cells. Instead, these particles may interact with a currently unknown receptor for cellular uptake.
Figure 5.
Cellular uptake and transfection efficiency of pHK10 and pHK15 polyplexes in heparan sulfate proteoglycan (HSPG) normal and deficient cells. (A) Cellular uptake of radiolabeled polyplexes. Cells were incubated with 1 µg of [3H]DNA alone, pHK10/[3H]DNA polyplexes, or pHK15/[3H]DNA polyplexes for 4 h under serum-free conditions. The amount of internalized DNA as a function of total DNA (% [3H]DNA internalized) was determined. (B) Transfection of HSPG normal (CHO-K1) and deficient (CHO-pgs-A745) cells. Cells were transfected with DNA (1 µg) at N/P 5 under serum-free conditions. Data are presented mean ± S.D., n = 3. (*) denotes p ≤ 0.05, as determined by a two-tailed, unpaired Student’s t-test with unequal variance.
In vitro transfection in the presence of endocytic inhibitors
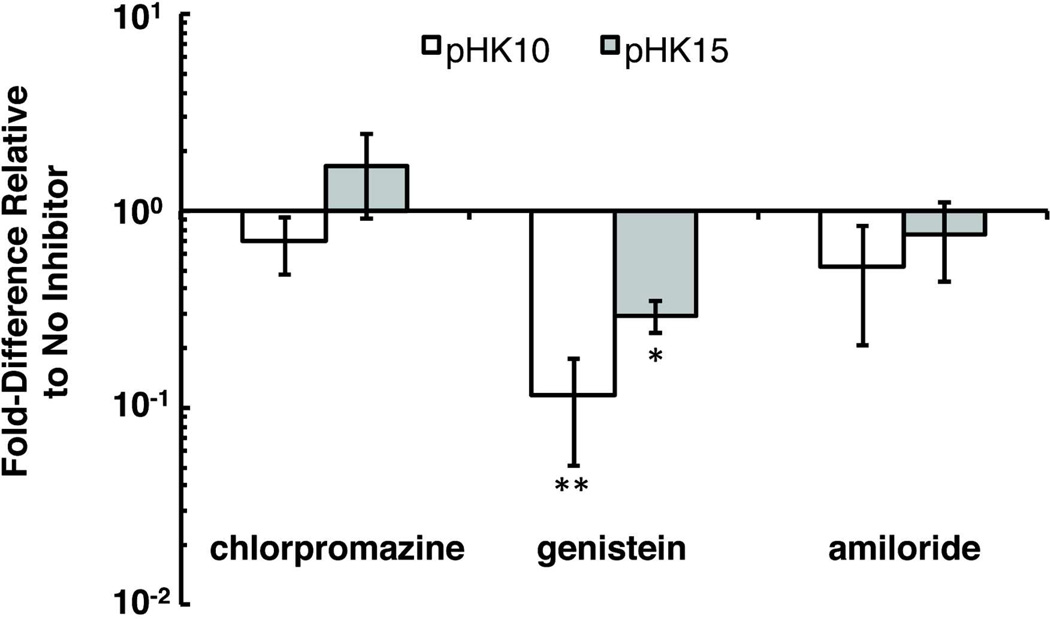
The route of polyplex internalization has been shown to affect subsequent intracellular trafficking and ultimately transgene expression efficiency.20–22 Therefore, the transfection of pHK10 and pHK15 polyplexes in HeLa cells was determined in the presence of inhibitors for major endocytic pathways for polyplexes,23 namely clathrin-mediated endocytosis (CME), caveolin-mediated endocytosis (CavME), and macropinocytosis. Cells were pre-treated with either chlorpromazine, which inhibits CME by dissociating clathrin from the plasma membrane,24 genistein, which inhibits tyrosine-phosphorylation of Cav1,25,26 or amiloride, which inhibits Na+/H+ ion exchange in the plasma membrane,27 for 1 h prior to transfection and sustained inhibitor treatment during transfection with pHK10 and pHK15 polyplexes. Inhibitor concentrations were optimized using cell viability studies. For both polymers, only transfection in the presence of genistein, but not chlorpromazine or amiloride, affected transgene expression, suggesting that caveolin-mediated endocytosis is the primary internalization route of these particles in HeLa cells. Transfection efficiency was 70–89% lower than cells transfected without inhibitor treatment (Figure 6). Similar transfection trends with uptake inhibitors were observed with other HPMA-oligolysine polymers.28 Since HSPGs have been shown to enter cells via a clathrin- and caveolin-independent pathway,29 these results also confirm HSPG-independent internalization. Furthermore, differential internalization mechanisms does not account for the disparities in gene transfer observed between pHK10 and pHK15 materials.
Figure 6.
Transfection efficiency of pHK10 and pHK15 polyplexes in HeLa cells in the presence of endocytic inhibitors. Cells were pre-treated with chlorpromazine, genistein, or amiloride for 1 h prior to the addition of polyplexes formulated with DNA (µ Lg) at N/P 5 under serum-free conditions. Data are presented mean ± S.D., n = 4. (*) denotes p ≤ 0.05, (**) denotes p < 0.01, as determined by a two-tailed, unpaired Student’s t-test with unequal variance.
Intracellular distribution via subcellular fractionation
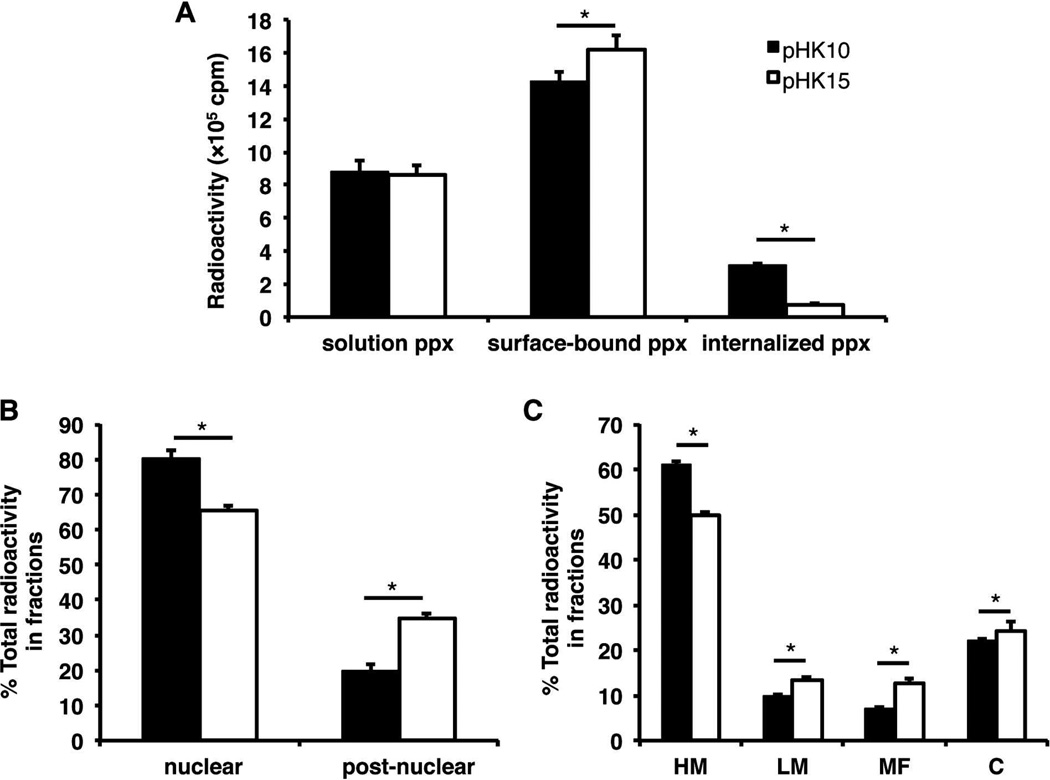
To gain quantitative insight into the subcellular distribution of pHK10 and pHK15 polyplexes, HeLa cells were treated with polyplexes formulated with [3H]DNA for 4 h, washed with CellScrub to reduce extracellularly-bound material, and subsequently fractionated into nuclear, heavy mitochondrial (HM), light mitochondrial (LM), microsomal (MF), and cytosolic (C) fractions. All media and washes were also collected to calculate a mass balance. Again, similar amounts of both pHK10 and pHK15 were found remaining in the media after incubation (Figure 7A). A higher percentage of pHK10/[3H]DNA polyplexes were found internalized rather than surface-bound compared to pHK15/[3H]DNA polyplexes. Interestingly, a higher percentage of pHK10 polyplexes were found in the nuclear fraction (80%) vs. pHK15 polyplexes (65%) (Figure 7B). There are several possible explanations for this observation. Better nuclear delivery of DNA may be achieved using pHK10 polymers. Higher amounts of free DNA in the nucleus has led to higher transgene expression with polyphophoramidate vectors.30 Enhanced nuclear accumulation may also indicate higher stability of pHK10 polyplexes against DNAse I.31 Alternatively the high amount of [3H]DNA in the nuclear fraction may be an artifact of degraded plasmid32 or the presence of cytoplasmic filaments.33,34 Slightly more pHK15 polyplexes were also found in the LM and MF fractions, suggesting that pHK15 polyplexes are associated with endosomal and lysosomal compartments more than pHK10 polyplexes (Figure 7C),34 although similar amounts of both formulations were found in the cytosolic fraction. These results may indicate that rod-like morphologies can preferentially accumulate in endosomal/lysosomal compartments and delay nuclear localization. A recent study demonstrated that the display of antibodies on rod-shaped particles resulted in higher cellular uptake, perhaps due to the multivalent interactions of antibodies with receptors on the cell surface.3 Similarly, rod-like cationic polyplexes may also associate with the lipid membranes of endosomes and lysosomes due to greater surface area of the rod-shaped polyplexes.
Figure 7.
Subcellular distribution of [3H]DNA/polymer complexes in HeLa cells. HeLa cells (5 × 10⁶) were treated with pHK10 (black bars) or pHK15 (white bars) polyplexes (containing 100 µg DNA) for 4 h prior to being washed with CellScrub to remove extracellularly-bound polyplexes and fractionated into nuclear, heavy mitochondrial (HM), light mitochondrial (LM), microsomal (MF), and cytosolic (C) fractions. (A) The amount of [3H]DNA found in solution (pulse), surface-bound (CellScrub), and internalized (trypsinized cells) fractions, (B) nuclear and post-nuclear fractions, and (C) post-nuclear fractions, composed of HM, LM, MF, C fractions. Data are presented as mean ± S.D., n = 3. (*) denotes p ≤ 0.05, as determined by a two-tailed, unpaired Student’s t-test with unequal variance.
Heparan sulfate decomplexation
Premature or delayed intracellular release of DNA can also lead to inefficient gene transfer.35 Polymers were tested for their ability to release DNA using heparan sulfate for competitive displacement. Polyplex unpackaging was determined by adding various amounts of heparan sulfate with polyplexes formulated at N/P 5. Slight differences in polyplex unpackaging were seen between pHK10 and pHK15 formulations; pHK10 polyplexes were mostly unpackaged by 11 µg heparan sulfate, while pHK15 polyplexes needed at least 14 µg heparan sulfate to show unpackaging (Supplemental Figure 3). However, neither formulation fully unpackaged, as determined by the amount of polyplex still left in the well, at 22 µg heparan sulfate (data not shown), the highest concentration tested. Fluorescence studies using YOYO-1 as a DNA intercalating agent and high NaCl concentrations to facilitate complete unpackaging also demonstrated that pHK10 and pHK15 unpackage DNA to similar extents (data not shown). Therefore, these results suggest that pHK10 and pHK15 polyplexes unpackage DNA to similar extents.
Intracellular particle trafficking via multiple-particle tracking
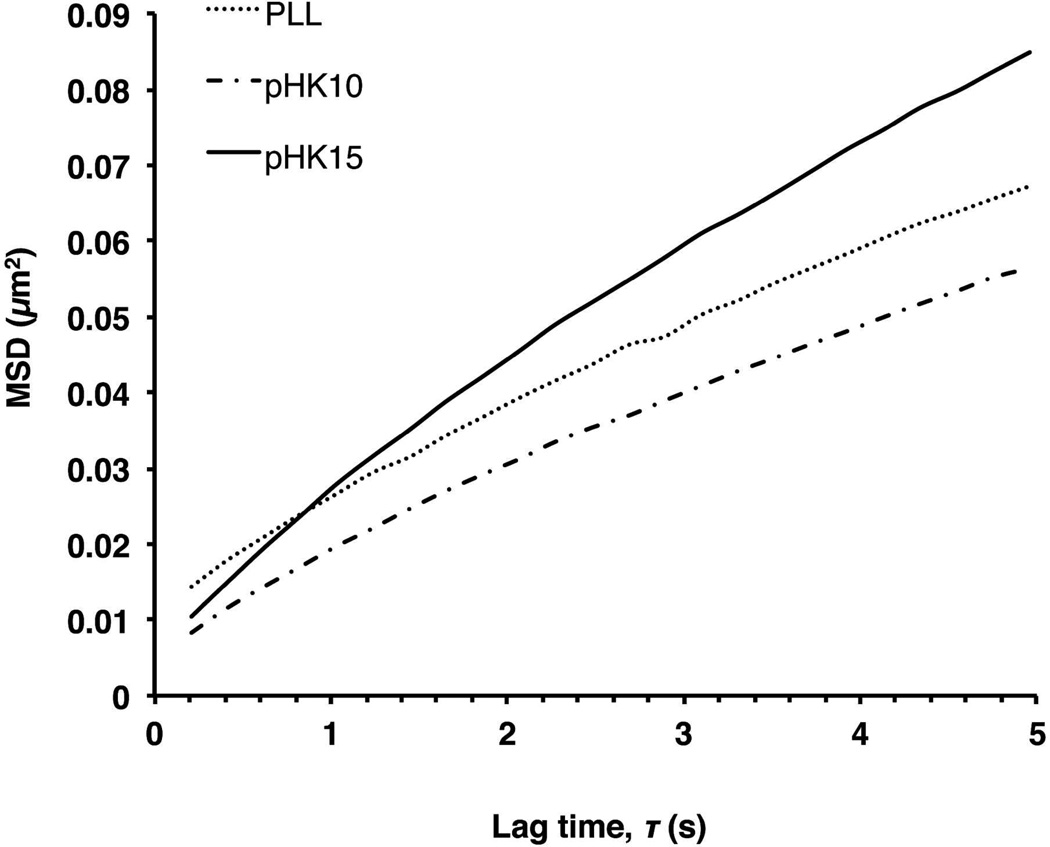
Multiple-particle tracking is a useful tool to measure the intracellular trafficking kinetics in live cells.36 Previous differences in intracellular trafficking kinetics have been observed with the attachment of a targeting moiety37 or PEG,38 and polyplexes undergoing non-degradative vs. degradative trafficking pathways.39,40 To determine if there were differences in intracellular polyplex trafficking between pHK10, pHK15, and PLL, cells were treated with Alexa Fluor 568-labeled polymer/DNA polyplexes for 1 h, rinsed, and then allowed to incubate with polyplexes for an additional 2 h after which 20 s videos of particle movement were captured. The effective diffusivity (Deff) of the ensemble-average mean-squared displacement (MSD) for pHK10 (n = 139 in 5 cells), pHK15 (n = 154 in 5 cells), and PLL (n = 87 in 6 cells) was 4.04×10⁻³, 6.27×10⁻³, and 4.28×10⁻³, respectively. The MSD for pHK15 was slightly greater than that of pHK10 (Figure 8). To further characterize particle transport, particle transport mode (hindered, diffusive, active) was determined by calculating a relative change (RC) value, defined as Deff,probed/Deff,reference (Supplemental Figure 4). The average velocities of actively-transported particles were not statistically significant at long time scales by the Kruskall-Wallis test (geometric mean = 0.0720 µm/s for pHK10 vs. 0.0942 µm/s for pHK15). These results indicate that there are insignificant differences in the intracellular trafficking kinetics for these polymers.
Figure 8.
Ensemble-average mean-squared displacement using multiple-particle tracking (MPT). HeLa cells were incubated with Alexa Fluor 568-labeled polymer/DNA complexes for 1 h in serum-free media, rinsed, and then allowed to incubate in complete media for an additional 2 h. Afterwards, 20 s videos of particle trajectories were captured. Ensemble-average mean-squared displacement of PLL (n = 87 in 6 cells), pHK10 (n = 139 in 5 cells), pHK15 (n = 154 in 5 cells) particles.
CONCLUSIONS
In summary, HPMA-oligolysine copolymers of different peptide lengths (K10 and K15) formed polyplexes that differed in particle morphology, leading to major differences in cellular uptake and transfection efficiency. The presence of HSPGs decreased cellular uptake for both polymer formulations, but did not affect transfection efficiency. Interestingly, pHK15 polyplexes accumulated more in endosomal/lysosomal compartments than pHK10 polyplexes. Furthermore, charge density, unpackaging ability, and intracellular trafficking kinetics did not differ significantly between pHK10 and pHK15. These results suggest that polyplex morphology may play an important role in determining the transfection efficiency of cationic gene carriers. Therefore, polyplex morphology should be considered when designing polymer structures as well as reproducible formulation conditions.
EXPERIMENTAL SECTION
Materials
N-(2-hydroxypropyl)methacrylamide (HPMA) was purchased from Polysciences (Warrington, PA). The initiator VA-044 was purchased from Wako Chemicals USA (Richmond, VA). Chain transfer agent ethyl cyanovaleric trithiocarbonate (ECT) was a generous gift from Dr. Anthony Convertine (University of Washington). Rink amide resin was purchased from Merck Chemical Int. (Darmstadt, Germany). HBTU and Fmoc-protected lysine were purchased from Aapptec (Louisville, KY). N-succinimidyl methacrylate was purchased from TCI America (Portland, OR). Copper grids for electron microscopy studies were purchased from Electron Microscopy Sciences (Hatfield, PA). 2'-Deoxycytidine 5'-triphosphate tetraammonium salt, [5'-3H], was purchased from Moravek Biochemicals and Radiochemicals (Brea, CA). Fluorescent dyes were purchased from Life Technologies (Green Island, NY). Ultima Gold scintillation fluid was purchased from Perkin-Elmer (Santa Clara, CA). All cell culture reagents were purchased from Cellgro/Mediatech (Fisher Scientific, Pittsburgh, PA). All other materials, including polylysine (PLL, 12,000 – 24,000 g/mol), were reagent grade or better and were purchased from Sigma-Aldrich (St. Louis, MO) unless otherwise stated. Endotoxin-free plasmid pCMV-Luc2 was prepared by using the pGL4.10 vector (Promega, Madison, WI) and inserting the CMV promoter/intron region from the gWiz Luciferase (Aldevron, Madison, WI). The plasmid was isolated and produced with the Qiagen Plasmid Giga kit (Qiagen, Germany) according to the manufacturer’s instructions.
Synthesis and characterization of peptides and polymers
Synthesis of peptide monomers, methacrylated AhxK10 (MaAhxK10) and methacrylated AhxK15 (MaAhxK15) were completed exactly as described previously.10 Briefly, peptide monomers were synthesized on a solid support of Rink amide following standard Fmoc/tBu chemistry and cleaved off the solid support with a solution of TFA/TIPS/1,3-dimethoxybenzene (92.5:2.5:5 v/v/v). Cleaved peptide monomers were precipitated in cold ether, dissolved in methanol, and reprecipitated in cold ether. Each peptide monomer was analyzed by RP-HPLC and MALDI-TOF MS and was shown to have greater than 95% purity after cleavage. MALDI-TOF MS calculated for MaAhxK10 (MH+) 1479.98, found 1479.85. MALDI-TOF MS calculated for MaAhxK15 (MH+) 2120.85, found 2120.19. Copolymers of HPMA and either MaAhxK10 or MaAhxK15 were synthesized via RAFT polymerization (DP 150) and characterized by size exclusion chromatography and amino acid analysis, as described previously.10
Polyplex formulation and characterization
Stock solutions of polymers were prepared at 10 mg/mL in 0.1× phosphate buffered saline (PBS), and the pH was adjusted to 6.5 by adding 0.1 N HCl. To formulate polyplexes, pCMV-Luc2 plasmid DNA was diluted to 0.1 mg/mL in DNase/RNase-free H2O and mixed with an equal volume of polymer at desired lysine to DNA phosphate (N/P) ratios. Polyplexes were then allowed to incubate for 10 min at room temperature prior to use for experiments. For ζ potential measurements, 20 µL of polyplexes were diluted with 180 µL dH2O and 800 µL 10 mM NaCl prior to measuring ζ potential using a Zetasizer Nano ZS (Malvern Instruments Inc., Southborough, MA) using the Smoluchowsky model for aqueous suspensions.
Transmission electron microscopy
Polyplex morphology was imaged by electron microscopy on a hydrophilic surface. To render a hydrophilic surface, 400-mesh copper/formvar grids were treated with glow discharge for 45 s. Ten microliters of polyplexes (in dH2O) was applied to the formvar-side of the grid for 30 min. The grid was washed four times in dH2O, and then dipped in 4% (w/v) uranyl acetate (in dH2O) to negatively stain the sample. Excess solution was wicked off the grid with filter paper, and the grid was allowed to dry overnight prior to imaging. Images of the sample grids were taken with a JEOL 1010 transmission electron microscope (Electron Microscopy Facility, Fred Hutchinson Cancer Research Center). Measurements of particle length were completed using ImageJ, and expressed in the text as the mean ± S.D.
For visualizing polyplex uptake by TEM, 5 × 10⁶ HeLa cells were seeded into 150-cm plates overnight. The cells were then treated with either pHK10 or pHK15 polyplexes (containing 100 µg DNA) at N/P 5 in OptiMEM for 1 h at 37 °C, 5% CO2. Cells were washed once with PBS, and fixed with 1:1 (v/v) mixture of ½ Karnovsky’s fixative:OptiMEM for 10 min at room temperature. The fixative was removed and the cells were then further incubated full-strength ½ Karnovsky’s fixative for 1 h. Cells were then scraped off the plate, pelleted, and resuspended in a small volume of fixative for preparation for TEM (Fred Hutchinson Cancer Research Center, Electron Microscopy Services).
Cell culture
HeLa (human cervical carcinoma) cells were grown in minimum essential medium (MEM) supplemented with 10% fetal bovine serum (FBS) and antibiotics/antimyotics (AbAm) (100 IU penicillin, 100 µg/mL streptomycin, and 0.25 µg/mL amphotericin B). CHO-K1 (Chinese Hamster ovary) cells were grown in F12K media supplemented with 10% FBS and AbAm. CHO-pgs-A745 cells were grown in F12K media supplemented with 10% FBS, 200 µM l-asparagine, 200 µM l-proline, and AbAm. Cells were passaged when they reached 80% confluency.
Labeling of plasmid DNA with tritium
Plasmid DNA was radiolabeled using nick translation and 2'-deoxycytidine 5'-triphosphate, [5-3H], according to manufacturer's instructions (GE Healthcare). For uptake studies, [3H]DNA was diluted with unlabeled plasmid so that the final concentration was 0.1 g/L at ~1.67 pCi.
Uptake of tritium-labeled polyplexes
HeLa, CHO-K1, and CHO-pgs-A745 cells were seeded in 24-well plates at a density of 3 × 10⁴ cells per well (1 mL/well) 24 h prior to polyplex addition. Cells were washed once with PBS and 200 µL of polyplexes, formulated at N/P 5 with [3H]DNA (1 µg at 0.1 g/L, ~1.67 pCi) in OptiMEM, were added on top of cells and allowed to incubate for up to 4 h at 37 °C, 5% CO2. At various time points (0, 2, 4 h), cells were washed twice with PBS, allowed to incubate with 200 µL CellScrub (Genlantis) for 15 min at room temperature, washed twice with DPBS (without divalent cations), trypsinized, and then collected with scintillation counting. For other time points (6, 8, 12, 24 h), cells were washed once with PBS after 4 h incubation with polyplexes and replaced with complete media. At various time points after media replacement (2, 4, 8, 20 h), cells were washed with PBS, CellScrub, DPBS, and trypsinized as above. All washes and solutions were collected and analyzed for radioactivity. To determine radioactivity, samples were dissolved in Ultima Gold scintillation fluid and counted for 10 min on a scintillation counter (Beckman LS-6500).
In vitro transfection
HeLa, CHO-K1, and CHO-pgs-A745 cells were seeded overnight in 24-well plates at a density of 3 × 10⁴ cells per well (1 mL/well) at 37 °C, 5% CO2. Polyplexes were formulated as described above. After the polyplexes were formed, 20 µL (containing 1 µg DNA) was mixed with 180 µL of Opti-MEM medium (Invitrogen). Seeded cells were washed once with PBS and then treated with 200 µL of polyplexes in Opti-MEM, which was added dropwise on top of the cells. After a 4 h incubation at 37 °C, 5% CO2 in a humidified environment, the cells were washed once again with PBS and incubated in 1 mL of fresh complete medium for an additional 44 h. Cells were harvested and assayed for luciferase expression at 48 h. This was done by washing cells once with PBS, adding of 200 µL reporter lysis buffer (Promega, Madison, WI), and then performing one freeze-thaw cycle to complete the lysis of cells. Lysates were collected and centrifuged at 14,000g for 5 min at 4 °C. Luminescence was carried out following the manufacturer’s instructions (Promega, Madison, WI). Luciferase activity is reported in relative light units (RLU) normalized by mg protein (RLU/mg), as measured by a microBCA Protein Assay Kit (Pierce).
In vitro transfection with chemical inhibitors
Stock solutions of genistein (5 mg/mL in DMSO), chlorpromazine (1 mg/mL in DMSO), and amiloride (2.5 mg/mL) were further diluted to working concentrations in OptiMEM (genistein, 50 µg/mL, chlorpromazine, 10 µg/mL, amiloride, 25 µg/mL), and used for transfections. For transfection with inhibitors, HeLa cells were seeded overnight in 24-well plates at a density of 3 × 10⁴ cells per well (1 mL/well) at 37 °C, 5% CO2. Polyplexes were formulated as described above. Cells were washed once with PBS and pre-treated with one of the chemical inhibitors (in OptiMEM) for 1 h at 37 °C, 5% CO2 prior to polyplex transfection. 20 µL of polyplexes were then added to the cells and incubated for an additional 2 h at 37 °C, 5% CO2. Cells were then washed once with PBS and incubated with fresh complete media for an additional 46 h. Cells were lysed and assayed for luciferase expression as described above.
Subcellular fractionation
Subcellular fractionation experiments were completed as previously described,34 with minor modifications. HeLa cells were seeded into 150 mm2 dishes at 5 × 10⁶ cells per dish 24 h prior to the start of the experiment. Cells were then treated with polyplexes formulated at N/P 5 with [3H]DNA (100 µg at 0.1 g/L, dosed at ~1.67 pCi) for 4 h at 37 °C, 5% CO2. To limit further intracellular trafficking and internalization, all future steps were done on ice, at 4 °C, and/or with pre-chilled reagents/equipment. Cells were washed once with PBS, incubated with CellScrub for 15 min at room temperature, washed twice in DPBS (no MgCl2, CaCl2), lifted off the plates in PBS, and then transferred to conical tubes. To remove dead/compromised cells, cells were then washed twice with PBS, pelleting cells at 500g for 5 min after each wash. The cells were then washed once with homogenization buffer (HB) (250 mM sucrose, 10 mM HEPES-NaOH, 1 mM EDTA, pH 7.4), pelleting the cells at 1000g for 6 min. The resulting pellet was then resuspended in 2.5× the wet pellet mass of HB (containing 1× protease inhibitors, Thermo Fisher HALT). Cells were then homogenized with a 25-gauge needle until greater than 90% cell lysis was achieved. Fractionation into a heavy mitochondrial (HM), light mitochondrial (LM), microsomal (MF), and cytosolic (C) fractions was then completed exactly as previously described.34 Samples were stored at −80 °C. For radioactivity analysis, samples were mixed with an equivolume of 1 M NaOH prior to mixing with 4–5 mL Ultima Gold XR scintillation fluid (Perkin Elmer), and then analyzed for radioactivity using a scintillation counter (Beckman LS-6500).
Heparan sulfate competition assay
Ten microliters of polyplexes (in dH2O) were treated with various amounts of heparan sulfate (5 g/L stock in dH2O) and incubated at room temperature for 5 min. The entire sample was mixed with 10× BlueJuice loading buffer, loaded onto a 0.8% agarose gel containing TAE buffer (40 mM Tris-acetate, 1 mM EDTA) and ethidium bromide (0.5 µg/mL final concentration), and electrophoresed at 100 V. DNA was visualized using a UV transilluminator (laser-excited fluorescence gel scanner, Kodak, Rochester, NY).
Labeling of polymer with Alexa Fluor 568
To fluorescently label PLL, the polymer was reacted with Alexa Fluor 568 carboxylic acid, succinimidyl ester, in 1 M sodium bicarbonate, pH 8.3, at a 3:1 dye to polymer ratio for 1 h in the dark at room temperature. For labeling of pHK10 and pHK15, polymers were reacted with maleimide-functionalized Alexa Fluor 568 in PBS, containing 10 molar eq. of immobilized tris(2-carboxyethyl)phosphine) (TCEP), purged with N2, and reacted for 2 h in the dark at room temperature. Excess dye was removed using a PD-10 column, using dH2O as the eluent (GE Healthcare, Piscataway, NJ). Reaction efficiency was calculated by comparing the absorbance of the labeled polymer against a standard curve of the dye. Polymer concentration was calculated using a 2,4,6-trinitrobenzene sulfonic acid (TNBS) assay for primary amines, using the unlabeled polymer as a standard. Polymers were calculated to contain ~1–2 dyes per polymer.
Multiple-particle tracking (MPT)
For multiple-particle tracking experiments, HeLa cells were seeded in 35 mm poly-L-lysine-treated glass-bottom petri dishes (MatTek, no. 1) at 4 × 10⁴ cells per dish 24 h prior to the start of the experiment. Polyplexes were formulated with Alexa Fluor 568-labeled polymer and plasmid DNA (containing 0.25 µg DNA) at N/P 5 for 10 min at room temperature. The cells were washed with PBS and treated with polyplexes (in OptiMEM) for 30 min at 37 °C, 5% CO2. Afterwards, cells were washed with PBS, and then placed in phenol red-free complete media for 2 h at 37 °C, 5% CO2. After locating a cell under 100× magnification, 20 s videos (at 5 fps) were acquired using a monochromatic camera on an inverted fluorescent microscope (Nikon Ti-E, Melville, NY), using an appropriate filter set (ex. 560/40 nm, em. 630/75 nm, Chroma 49000 series, Rochingham, VT). Particles were then automatically tracked using Volocity v.6.2 (Perkin Elmer). Mean-squared-displacement was calculated using a custom-written MATLAB script (MathWorks, Natick, MA). Relative change (RC) values at short (τreference = 0.2 s, τrpobed = 0.2 s) and long time scales (τreference = 1 s, τrpobed = 5 s) were calculated and analyzed as previously described.41 To characterize transport modes, trajectories of purely Brownian particles were created using a Monte Carlo simulation, and confirmed by tracking 100 nm fluorescent polystyrene beads in glycerol. The effective diffusivity (Deff) of the ensemble-average MSD was calculated using the following equation: MSD = C+4Deffτα
where C is an adjustment factor dependent on the tracking resolution (µm2/s), τ is the time lag (s), and α is an adjustment factor for subdiffusive motion (α = 1 for diffusive motion).36 C was calculated to be 0.00657 ± 0.00445 µm2.
Supplementary Material
ACKNOWLEDGEMENTS
This work is supported by NIH/NINDS 1R01NS064404 and the Center for the Intracellular Delivery of Biologics through the Washington Life Sciences Discovery Fund Grant No. 2496490. J.S. is supported by the National Science Foundation Graduate Research Fellowship under Grant No. DGE-0718124 and the Howard Hughes Medical Institute/UW Molecular Medicine Graduate Student Scholarship. J.L.C. and B.C. were supported by the Mary Gates Undergraduate Research Fellowship. We thank Sergio Haro for help on the MATLAB script, Christine Wang and Dr. James Evans (Pacific Northwest National Laboratory) for technical help, Profs. Patrick Stayton and Anthony Convertine (University of Washington) for the generous donation of the ECT reagent, Prof. Shaoyi Jiang (University of Washington) for use of his Malvern Zetasizer, and Dr. Bobbie Schneider (Electron Microscopy Services at the Fred Hutchinson Cancer Research Center) for her technical help and assistance with TEM sample preparation and imaging.
Footnotes
Supporting Information Available: Custom-written MATLAB scripts for Brownian diffusion simulations and particle tracking analysis are available on GitHub: https://github.com/julieshi/particle-tracking. Supplemental figures are available free of charge via the Internet at http://pubs.acs.org.
REFERENCES
- 1.Sahay G, Alakhova DY, Kabanov AV. Endocytosis of Nanomedicines. J. Controlled Release. 2010;145:182–195. doi: 10.1016/j.jconrel.2010.01.036. [DOI] [PMC free article] [PubMed] [Google Scholar]
- 2.Duncan R, Richardson SCW. Endocytosis and Intracellular Trafficking as Gateways for Nanomedicine Delivery: Opportunities and Challenges. Mol. Pharmaceutics. 2012;9:2380–2402. doi: 10.1021/mp300293n. [DOI] [PubMed] [Google Scholar]
- 3.Barua S, Yoo J-W, Kolhar P, Wakankar A, Gokarn YR, Mitragotri S. Particle Shape Enhances Specificity of Antibody-Displaying Nanoparticles. Proc. Natl. Acad. Sci. U.S.A. 2013;110:3270–3275. doi: 10.1073/pnas.1216893110. [DOI] [PMC free article] [PubMed] [Google Scholar]
- 4.Gratton SEA, Ropp PA, Pohlhaus PD, Luft JC, Madden VJ, Napier ME, DeSimone JM. The Effect of Particle Design on Cellular Internalization Pathways. Proc. Natl. Acad. Sci. U.S.A. 2008;105:11613–11618. doi: 10.1073/pnas.0801763105. [DOI] [PMC free article] [PubMed] [Google Scholar]
- 5.Herd H, Daum N, Jones AT, Huwer H, Ghandehari H, Lehr C-M. Nanoparticle Geometry and Surface Orientation Influence Mode of Cellular Uptake. ACS Nano. 2013;7:1961–1973. doi: 10.1021/nn304439f. [DOI] [PMC free article] [PubMed] [Google Scholar]
- 6.Huang X, Teng X, Chen D, Tang F, He J. The Effect of the Shape of Mesoporous Silica Nanoparticles on Cellular Uptake and Cell Function. Biomaterials. 2010;31:438–448. doi: 10.1016/j.biomaterials.2009.09.060. [DOI] [PubMed] [Google Scholar]
- 7.Chithrani BD, Ghazani AA, Chan WCW. Determining the Size and Shape Dependence of Gold Nanoparticle Uptake Into Mammalian Cells. Nano Lett. 2006;6:662–668. doi: 10.1021/nl052396o. [DOI] [PubMed] [Google Scholar]
- 8.Chithrani BD, Chan WCW. Elucidating the Mechanism of Cellular Uptake and Removal of Protein-Coated Gold Nanoparticles of Different Sizes and Shapes. Nano Lett. 2007;7:1542–1550. doi: 10.1021/nl070363y. [DOI] [PubMed] [Google Scholar]
- 9.Chaudhuri P, Harfouche R, Soni S, Hentschel DM, Sengupta S. Shape Effect of Carbon Nanovectors on Angiogenesis. ACS Nano. 2010;4:574–582. doi: 10.1021/nn901465h. [DOI] [PubMed] [Google Scholar]
- 10.Johnson RN, Chu DSH, Shi J, Schellinger JG, Carlson PM, Pun SH. HPMA-Oligolysine Copolymers for Gene Delivery: Optimization of Peptide Length and Polymer Molecular Weight. J. Controlled Release. 2011;155:303–311. doi: 10.1016/j.jconrel.2011.07.009. [DOI] [PMC free article] [PubMed] [Google Scholar]
- 11.Nayvelt I, Thomas T, Thomas TJ. Mechanistic Differences in DNA Nanoparticle Formation in the Presence of Oligolysines and Poly-L-Lysine. Biomacromolecules. 2007;8:477–484. doi: 10.1021/bm0605863. [DOI] [PMC free article] [PubMed] [Google Scholar]
- 12.Mann A, Richa R, Ganguli M. DNA Condensation by Poly-L-Lysine at the Single Molecule Level: Role of DNA Concentration and Polymer Length. J. Controlled Release. 2008;125:252–262. doi: 10.1016/j.jconrel.2007.10.019. [DOI] [PubMed] [Google Scholar]
- 13.Yoo J-W, Doshi N, Mitragotri S. Endocytosis and Intracellular Distribution of PLGA Particles in Endothelial Cells: Effect of Particle Geometry. Macromol. Rapid Commun. 2010;31:142–148. doi: 10.1002/marc.200900592. [DOI] [PubMed] [Google Scholar]
- 14.Männistö M, Vanderkerken S, Toncheva V, Elomaa M, Ruponen M, Schacht E, Urtti A. Structure-Activity Relationships of Poly(L-Lysines): Effects of Pegylation and Molecular Shape on Physicochemical and Biological Properties in Gene Delivery. J. Controlled Release. 2002;83:169–182. doi: 10.1016/s0168-3659(02)00178-5. [DOI] [PubMed] [Google Scholar]
- 15.Ruponen M, Rönkkö S, Honkakoski P, Pelkonen J, Tammi M, Urtti A. Extracellular Glycosaminoglycans Modify Cellular Trafficking of Lipoplexes and Polyplexes. J. Biol. Chem. 2001;276:33875–33880. doi: 10.1074/jbc.M011553200. [DOI] [PubMed] [Google Scholar]
- 16.Mislick KA, Baldeschwieler JD. Evidence for the Role of Proteoglycans in Cation-Mediated Gene Transfer. Proc. Natl. Acad. Sci. U.S.A. 2005;93:12349–12354. doi: 10.1073/pnas.93.22.12349. [DOI] [PMC free article] [PubMed] [Google Scholar]
- 17.Ziraksaz Z, Nomani A, Ruponen M, Soleimani M, Tabbakhian M, Haririan I. Cell-Surface Glycosaminoglycans Inhibit Intranuclear Uptake but Promote Post-Nuclear Processes of Polyamidoamine Dendrimer-pDNA Transfection. Eur. J. Pharm. Sci. 2013;48:55–63. doi: 10.1016/j.ejps.2012.10.016. [DOI] [PubMed] [Google Scholar]
- 18.Naik RJ, Chandra P, Mann A, Ganguli M. Exogenous and Cell Surface Glycosaminoglycans Alter DNA Delivery Efficiency of Arginine and Lysine Homopeptides in Distinctly Different Ways. J. Biol. Chem. 2011;286:18982–18993. doi: 10.1074/jbc.M111.227793. [DOI] [PMC free article] [PubMed] [Google Scholar]
- 19.Åmand HL, Rydberg HA, Fornander LH, Lincoln P, Nordén B, Esbjörner EK. Cell Surface Binding and Uptake of Arginine- and Lysine-Rich Penetratin Peptides in Absence and Presence of Proteoglycans. Biochim. Biophys. Acta. 2012;1818:2669–2678. doi: 10.1016/j.bbamem.2012.06.006. [DOI] [PubMed] [Google Scholar]
- 20.McLendon PM, Fichter KM, Reineke TM. Poly(Glycoamidoamine) Vehicles Promote pDNA Uptake Through Multiple Routes and Efficient Gene Expression viaCaveolae-Mediated Endocytosis. Mol. Pharmaceutics. 2010;7:738–750. doi: 10.1021/mp900282e. [DOI] [PubMed] [Google Scholar]
- 21.Reilly MJ, Larsen JD, Sullivan MO. Polyplexes Traffic Through Caveolae to the Golgi and Endoplasmic Reticulum en Route to the Nucleus. Mol. Pharmaceutics. 2012;9:1280–1290. doi: 10.1021/mp200583d. [DOI] [PubMed] [Google Scholar]
- 22.Fichter KM, Ingle NP, McLendon PM, Reineke TM. Polymeric Nucleic Acid Vehicles Exploit Active Interorganelle Trafficking Mechanisms. ACS Nano. 2013;7:347–364. doi: 10.1021/nn304218q. [DOI] [PMC free article] [PubMed] [Google Scholar]
- 23.Vercauteren D, Rejman J, Martens TF, Demeester J, De Smedt SC, Braeckmans K. On the Cellular Processing of Non-Viral Nanomedicines for Nucleic Acid Delivery: Mechanisms and Methods. J. Controlled Release. 2012;161:566–581. doi: 10.1016/j.jconrel.2012.05.020. [DOI] [PubMed] [Google Scholar]
- 24.Wang LH, Rothberg KG, Anderson RG. Mis-Assembly of Clathrin Lattices on Endosomes Reveals a Regulatory Switch for Coated Pit Formation. J. Cell Biol. 1993;123:1107–1117. doi: 10.1083/jcb.123.5.1107. [DOI] [PMC free article] [PubMed] [Google Scholar]
- 25.Akiyama T, Ishida J, Nakagawa S, Ogawara H, Watanabe S, Itoh N, Shibuya M, Fukami Y. Genistein, a Specific Inhibitor of Tyrosine-Specific Protein Kinases. J. Biol. Chem. 1987;262:5592–5595. [PubMed] [Google Scholar]
- 26.Aoki T, Nomura R, Fujimoto T. Tyrosine Phosphorylation of Caveolin-1 in the Endothelium. Exp. Cell Res. 1999;253:629–636. doi: 10.1006/excr.1999.4652. [DOI] [PubMed] [Google Scholar]
- 27.Hewlett LJ, Prescott AR, Watts C. The Coated Pit and Macropinocytic Pathways Serve Distinct Endosome Populations. J. Cell Biol. 1994;124:689–703. doi: 10.1083/jcb.124.5.689. [DOI] [PMC free article] [PubMed] [Google Scholar]
- 28.Shi J, Schellinger JG, Johnson RN, Choi JL, Chou B, Anghel EL, Pun SH. Influence of Histidine Incorporation on Buffer Capacity and Gene Transfection Efficiency of HPMA-Co-Oligolysine Brush Polymers. Biomacromolecules. 2013:130520073834008. doi: 10.1021/bm400342f. [DOI] [PMC free article] [PubMed] [Google Scholar]
- 29.Payne CK, Jones SA, Chen C, Zhuang X. Internalization and Trafficking of Cell Surface Proteoglycans and Proteoglycan-Binding Ligands. Traffic. 2007;8:389–401. doi: 10.1111/j.1600-0854.2007.00540.x. [DOI] [PMC free article] [PubMed] [Google Scholar]
- 30.Chen HH, Ho Y-P, Jiang X, Mao H-Q, Wang T-H, Leong KW. Quantitative Comparison of Intracellular Unpacking Kinetics of Polyplexes by a Model Constructed From Quantum Dot-FRET. Mol. Ther. 2008;16:324–332. doi: 10.1038/sj.mt.6300392. [DOI] [PMC free article] [PubMed] [Google Scholar]
- 31.Oh Y-K, Suh D, Kim JM, Choi H-G, Shin K, Ko JJ. Polyethylenimine-Mediated Cellular Uptake, Nucleus Trafficking and Expression of Cytokine Plasmid DNA. Gene Ther. 2002;9:1627–1632. doi: 10.1038/sj.gt.3301735. [DOI] [PubMed] [Google Scholar]
- 32.Hartig R, Shoeman RL, Janetzko A, Grüb S, Traub P. Active Nuclear Import of Single-Stranded Oligonucleotides and Their Complexes with Non-Karyophilic Macromolecules. Biol. Cell. 1998;90:407–426. [PubMed] [Google Scholar]
- 33.Staufenbiel M, Deppert W. Intermediate Filament Systems Are Collapsed Onto the Nuclear Surface After Isolation of Nuclei From Tissue Culture Cells. Exp. Cell Res. 1982;138:207–214. doi: 10.1016/0014-4827(82)90107-0. [DOI] [PubMed] [Google Scholar]
- 34.Shi J, Chou B, Choi JL, Ta A, Pun SH. Investigation of Polyethylenimine/DNA Polyplex Transfection to Cultured Cells Using Radiolabeling and Subcellular Fractionation Methods. Mol. Pharmaceutics. 2013;10:2145–2156. doi: 10.1021/mp300651q. [DOI] [PMC free article] [PubMed] [Google Scholar]
- 35.Grigsby CL, Leong KW. Balancing Protection and Release of DNA: Tools to Address a Bottleneck of Non-Viral Gene Delivery. J. R. Soc. Interface. 2010;7(Suppl 1):S67–S82. doi: 10.1098/rsif.2009.0260. [DOI] [PMC free article] [PubMed] [Google Scholar]
- 36.Kim AJ, Hanes J. The Emergence of Multiple Particle Tracking in Intracellular Trafficking of Nanomedicines. Biophys. Rev. 2012:1–10. doi: 10.1007/s12551-012-0066-y. [DOI] [PMC free article] [PubMed] [Google Scholar]
- 37.de Bruin K, Ruthardt N, Gersdorff, von K, Bausinger R, Wagner E, Ogris M, Bräuchle C. Cellular Dynamics of EGF Receptor-Targeted Synthetic Viruses. Mol. Ther. 2007;15:1297–1305. doi: 10.1038/sj.mt.6300176. [DOI] [PubMed] [Google Scholar]
- 38.Suh J, Choy K-L, Lai SK, Suk JS, Tang BC, Prabhu S, Hanes J. PEGylation of Nanoparticles Improves Their Cytoplasmic Transport. Int. J. Nanomedicine. 2007;2:735–741. [PMC free article] [PubMed] [Google Scholar]
- 39.Lai SK, Hida K, Chen C, Hanes J. Characterization of the Intracellular Dynamics of a Non-Degradative Pathway Accessed by Polymer Nanoparticles. J. Controlled Release. 2008;125:107–111. doi: 10.1016/j.jconrel.2007.10.015. [DOI] [PMC free article] [PubMed] [Google Scholar]
- 40.Kim AJ, Boylan NJ, Suk JS, Lai SK, Hanes J. Non-Degradative Intracellular Trafficking of Highly Compacted Polymeric DNA Nanoparticles. J. Controlled Release. 2012;158:102–107. doi: 10.1016/j.jconrel.2011.10.031. [DOI] [PMC free article] [PubMed] [Google Scholar]
- 41.Lai SK, Hanes J. Real-Time Multiple Particle Tracking of Gene Nanocarriers in Complex Biological Environments. Methods Mol. Biol. 2008;434:81–97. doi: 10.1007/978-1-60327-248-3_6. [DOI] [PubMed] [Google Scholar]
Associated Data
This section collects any data citations, data availability statements, or supplementary materials included in this article.


