Abstract
Fibroblasts in whole areolar connective tissue respond to static stretching of the tissue by expanding and remodeling their cytoskeleton within minutes both ex vivo and in vivo. This study tested the hypothesis that the mechanism of fibroblast expansion in response to tissue stretch involves extracellular ATP signaling. In response to tissue stretch ex vivo, ATP levels in the bath solution increased significantly, and this increase was sustained for 20 minutes, returning to baseline at 60 min. No increase in ATP was observed in tissue incubated without stretch, or tissue stretched in the presence of the Rho kinase inhibitor Y27632. The increase in fibroblast cross sectional area in response to tissue stretch was blocked by both suramin (a purinergic receptor blocker) and apyrase (an enzyme that selectively degrades extracellular ATP). Furthermore, connexin channel blockers (octanol and carbenoxolone), but not VRAC (fluoxetine) or pannexin (probenecid) channel blockers, inhibited fibroblast expansion. Together, these results support a mechanism in which extracellular ATP signaling via connexin hemichannels mediated the active change in fibroblast shape that occurs in response to a static increase in tissue length.
Keywords: Fibroblast, purinergic, ATP, connexin, mechanical, cytoskeleton
INTRODUCTION
Fibroblasts within whole areolar connective tissue undergo profound cytoskeletal reorganization, expansion and formation of new lamellipodia in response to static stretching of the tissue (Langevin et al., 2006a; Langevin et al., 2005; Langevin et al., 2011). The mechanism by which fibroblasts expand in response to the mechanical stimulus is not fully understood but has been shown to require both Rho and Rac signaling (Langevin et al., 2006b). There is previous documentation in a variety of cell types that membrane protrusion at the edge of migrating cells involves autocrine ATP signaling (Corriden and Insel, 2012; Lazarowski, 2012). There also is evidence that ATP signaling is necessary for the change in cell shape (from stellate to expanded and flattened) that occurs during hypotonic swelling of cultured endothelial cells: under such conditions, a rise in extracellular ATP occurs via connexin hemichannels and is blocked by Rho kinase and carbenoxolone (Koyama et al., 2001; Lu et al., 2012). The current study was undertaken to test the hypothesis that a similar mechanism, involving extracellular release of ATP through connexin hemichannels and binding to purinergic receptors on the fibroblast’s cell surface, underlies fibroblast expansion in response to static stretching of whole connective tissue.
METHODS
Experimental design
In the ex vivo experimental system used in this study, ATP release was measured from a single sheet of areolar connective tissue under uniaxial stretch (or no stretch) conditions immediately after excision from C57B6 mice (N=14 mice), followed by tissue fixation and morphometric measurements. Tissue force was recorded continuously during the period of static stretch. Fibroblast morphology was quantified in confocal microscopy images of each tissue sample fixed immediately after static stretch to measure the change in cell morphology occurring in response to tissue stretch.
In additional experiments (N=10 mice), we examined the effect of pharmacological agents (ATPase, purinergic receptor blocker, connexin, pannexin and volume regulated anion channels (VRAC) inhibitors) on fibroblast spreading in response to stretching of whole mouse skin and subcutaneous tissue samples ex vivo.
Tissue dissection
Whole skin and connective tissue sample excision
C57Black-6 male mice (19–24 g) were sacrificed by decapitation. Immediately after death, an 8 cm × 3 cm tissue flap was excised from the back of the mouse and covered with 37 ° C physiological saline solution (PSS), pH 7.4, containing (mM): NaCl 141.8, KCl 4.7, MgSO4 1.7, EDTA 0.39, CaCl2 2.8, HEPES 10, KH2PO4 1.2, Glucose 5.0 as previously described (Langevin et al., 2011).
Areolar connective tissue single sheet dissection
Areolar connective tissue samples were dissected from tissue samples excised as above. In these samples, the areolar connective tissue layer is composed of several loosely connected sublayers that can be dissected with minimal cutting of tissue. A sample of the first areolar connective tissue sublayer was dissected following the natural cleavage plane of the tissue and cut to uniform dimensions yielding a single tissue sheet measuring 4 mm width × 5 mm length. Although precise measurement of tissue thickness in fresh samples is difficult, the thickness of this tissue layer is estimated to be ~350 µm based on both fresh and fixed tissue measurements.
Static tissue stretch and force recording
In single sheet areolar connective tissue stretching experiments, tissue samples were clipped at both ends and attached to an Akers strain gauge (Akers, Horten, Norway) calibrated for force measurement in 3.5 ml of 37 ° C PSS with or without inhibitor. The direction of tissue stretch was always transverse relative to the in vivo tissue orientation. The samples were elongated at 1 mm/sec until a variable target peak force (500–1500 mg) was reached and maintained at that length for the 50 min incubation. Tissue force was continually recorded during stretching and subsequent incubation using Labview software (National Instruments, Austin, TX) at 10 Hz. At the end of incubation, the tissue was immersion-fixed in 95% ethanol for 10 min at the stretched length.
In whole skin and subcutaneous tissue stretching experiments, tissue samples were placed in grips, submerged in 37°C HEPES PSS and elongated at 1 mm/sec until a target peak force of 4.9 N (2g) was reached and maintained at that length for the 120 min incubation, then fixed in 95% ethanol for 1 hour as previously described (Langevin et al., 2005).
Pharmacological inhibitors
The following inhibitors were used, all dissolved directly into the HEPES buffer: 10 µM Rho kinase inhibitor Y27632 (BioMol, Philadelphia, PA), 100 µM suramin (Sigma product number: S2671), 40U/ml apyrase (Sigma product number: A6535), 0.63 mM octanol (Sigma product number: 95446), 1 µM carbenoxolone (Sigma product number: C4790), 10 µm fluoxetine (Sigma), 300 µM probenecid (Sigma) or vehicle control (HEPES buffer). Since all gap junction and hemichannel blockers in principle are fairly unspecific, we established in initial experiment the minimal concentration of gap junction blockers which inhibited cytoskeletal remodeling.
ATP measurements
After mounting of tissue into grips, the bath solution was exchanged 3 times to remove excess ATP released while the mechanical handling of the tissue. Bath solution (100 µl) was collected every 10 min before and during the stretch and immediately stored at −80°C. The ATP concentrations in samples were measured by using a bioluminescent ATP assay mix (Sigma) and a Victor2 plate reader (Wallac).
Separate calibrations were carried out for ATP measurements in presence of Y27632. An analysis of ATP release in presence of other drugs was not attempted since the drugs reduced the sensitivity of the luciferase assay to below detection in the model system used.
Histochemical staining
The superficial layer of areolar connective tissue from C57B6 mice used in this study is composed of uniform loose connective tissue devoid of blood vessels and nerve fibers which are located in deeper areolar connective tissue sublayers. Cells within the areolar connective tissue samples can be visualized within their native 3-d matrix environment in whole tissue mounts using confocal microscopy without embedding, freezing or sectioning. Phalloidin (specific stain for polymerized actin) was used to visualize connective tissue cells with confocal microscopy. Such preparations were previously shown to contain no muscle tissue or dense epimysium) (Langevin et al., 2011). The majority (70–80%) of cells within these tissue samples, referred to in this paper as fibroblasts, have fibroblast-like characteristics based on cytoplasmic and nuclear morphology (phalloidin and DAPI staining) and immunohistochemical staining for vimentin (Langevin et al., 2011), with an additional 10–15% of cell identified as macrophages (based on CD-68 immunoreactivity) and 2–4% as mast cells (based on cresyl violet stain).
Histochemical methods
Each whole sample was stained with Texas Red conjugated phalloidin 1:25 (4 U/ml; Molecular Probes, Eugene OR) for 40 min at 4°C, counterstained for 5 min with DAPI nucleic acid stain 1:6000 (Molecular Probes, Eugene OR) and mounted on slides using 50% glycerol in PBS with 1% N-propylgallate.
Confocal scanning laser microscopy
Tissue samples were imaged with a Zeiss LSM 510 META confocal scanning laser microscope at 63X (oil immersion lens, N.A. 1.4) at room temperature. Each tissue sample was first examined in its entirety to confirm the absence of any contaminating muscle or epimysium, which would respectively appear as brightly staining Z-banded actin-containing sarcomeres (Fig. 2B), or densely packed collagen and elastic fibers (Fig. 2C). Seven fields per sample were then selected for image acquisition by an imager blind to the study condition (drug or no drug). For each field, a stack of 20 (143 µm × 143 µm) images was acquired at a 0.53 µm inter-image interval.
Figure 2.
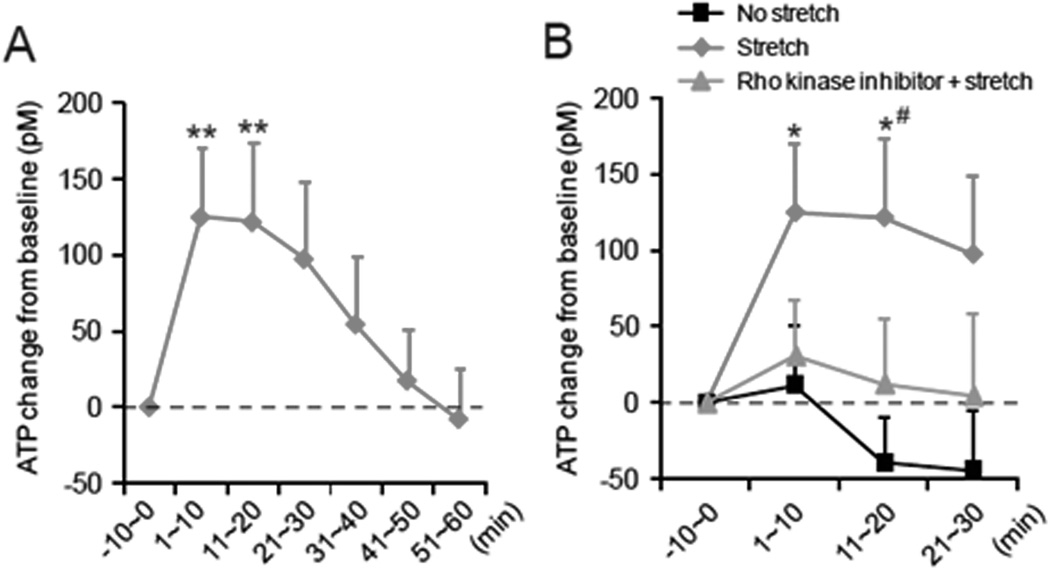
Measurement of ATP before and during the tissue stretch. (A) Change of bath ATP concentration from the baseline evoked by subcutaneous tissue stretch. Bath solution was collected during 10 min before the onset of the stretch as the baseline sample (−10~0 min). The tissue was stretched at time 0 and incubated for 60 min (n=10; **p<0.01 compared to “−10~0 min baseline”; one way repeated measures ANOVA with Bonferroni’s test). (B) Comparison of ATP release without stretch (black, N=5), by stretch (red, n=10) and by stretch with Rho kinase inhibitor Y27632 (10 µM) (blue, N=6) (* p<0.05 compared to “−10~0 min baseline”, #p<0.05 compared to No stretch at each time point; two way ANOVA with Bonferroni’s test).
Morphometric analysis
Measurement of cell body cross sectional area in phalloidin-stained samples was performed in image stacks imported into the analysis software MetaMorph 6.0 (Universal Imaging, Downingtown, PA). In each stack, all cells that were in focus in the 10th optical section (middle of stack) were measured as previously described (Langevin et al., 2005). All cells were measured, with the assumption that fibroblasts are the overwhelmingly predominant cell population in this tissue. Cell body cross sectional area was defined as the area of the cell’s cytoplasm projected in the plane of the image excluding cell processes (defined as an extension of a cell’s cytoplasm longer than 2 µm and less than 2 µm at any portion of its length).
RESULTS
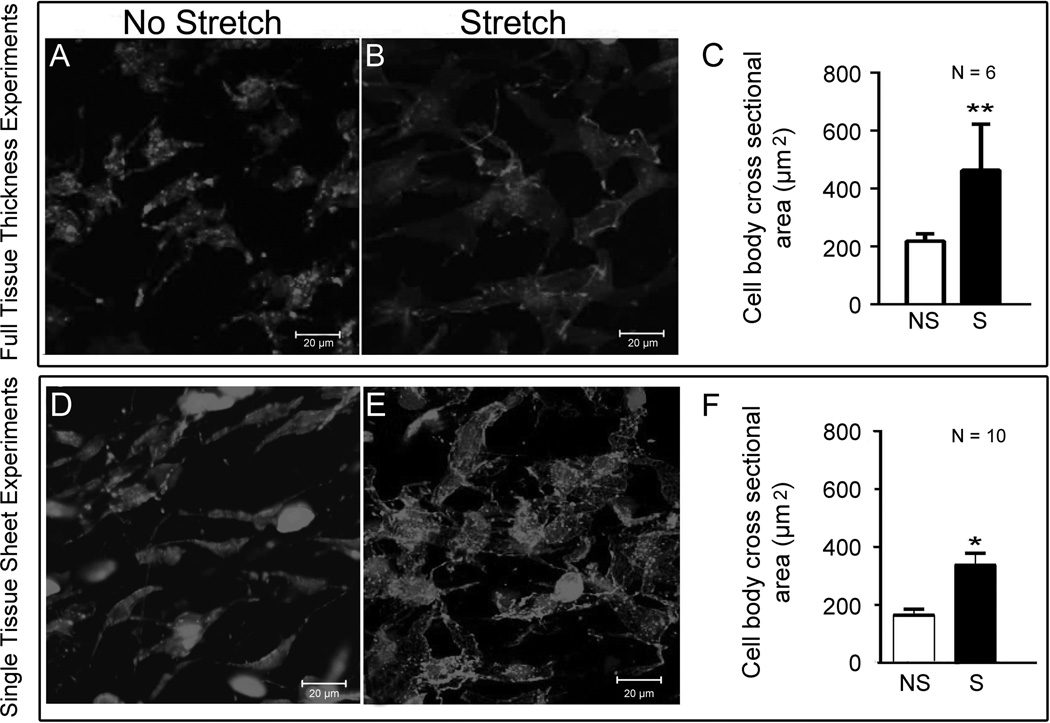
This study includes ex vivo tissue stretching experiments in both 1) full thickness samples including dermis and subcutaneous connective tissue and 2) single sheets of subcutaneous areolar connective tissue. In both cases, tissue samples were harvested from the back of mice immediately after euthanasia followed by stretch (or no stretch) ex vivo. As shown in Figure 1, areolar connective tissue fibroblasts cross sectional area was significantly greater in stretched compared with non-stretched tissue in both full thickness (Figure 1 A–C) and single sheet (Figure 1 D–F) experiments.
Figure 1.
Effect of tissue stretch ex vivo on fibroblast morphology. Stretching of both full thickness subcutaneous tissue samples (A–C) and single sheets of subcutaneous areolar connective tissue (D–F) caused an increased in fibroblast cross sectional area, compared with non-stretched tissue. *p<.05; **p<.001.
To assess whether tissue stretch can evoke ATP release in areolar connective tissue fibroblasts, we measured ATP concentration in the tissue bath solution before and during tissue stretching of single sheets of areolar connective tissue. Immediately after the initiation of tissue stretch, ATP level in the bath solution increased significantly (1~10 min, 124.7±45.6 pM; n=10; p<0.01 compared to −10~0 min baseline, one way repeated measures ANOVA with Bonferroni’s test). This increase in ATP was sustained for 20 min (11~20 min, 121.5±52.3 pM; p<0.01 compared to baseline, Bonferroni’s test) (Figure 2A). ATP concentration in the bath solution gradually decreased over time and returned to baseline at 51–60 min. In contrast, the tissue incubated without stretch did not exhibit an increase of bath ATP concentration at any time point (p=0.533 compared to −10~0 min baseline, one way repeated measures ANOVA) (Figure 2B)
We previously found that Rho kinase signaling regulates the cytoskeletal remodeling of fibroblasts induced by tissue stretch (Langevin et al., 2011). Therefore, in order to investigate whether the cytoskeletal remodeling mechanism may be linked to ATP release, we examined the effect of the Rho kinase inhibitor Y27632 on ATP release in response to tissue stretch. The stretch-evoked ATP release was not observed when the tissues was treated with the Rho kinase inhibitor (p=0.947, compared to −10~0 min baseline, one way repeated measures ANOVA) (Figure 2B), suggesting that ATP release was not simply the result of mechanical stress but depended on an active cellular process regulated by Rho kinase activity.
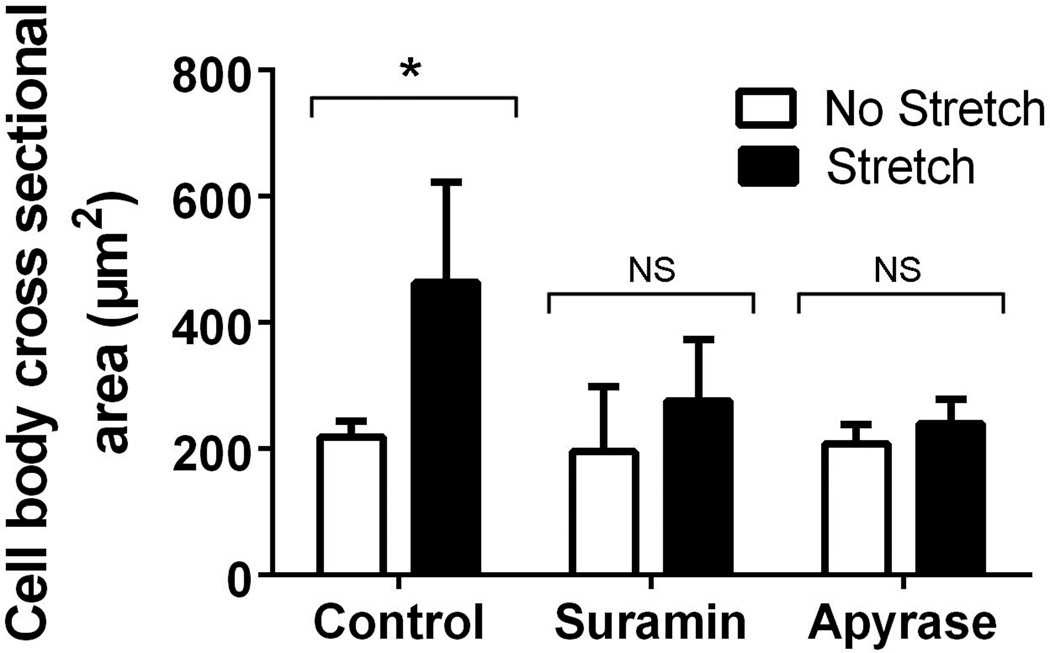
In order to further investigate the potential role of extracellular ATP signaling in stretch-induced fibroblast spreading, we next examined the effect of tissue stretch in whole areolar connective tissue samples ex vivo with and without pharmacological agents interfering with extracellular ATP signaling. When subcutaneous tissue samples were stretched ex vivo in the presence of both suramin (a purinergic receptor blocker) and apyrase (an enzyme that selectively degrades extracellular ATP), fibroblasts no longer changed shape in response to tissue stretch (Figure 3), indicating that extracellular ATP signaling is necessary for the active change in fibroblast shape that occurs in response to static stretching of areolar connective tissue.
Figure 3.
Effect of tissue stretch on areolar connective tissue fibroblast cross sectional area in the presence of inhibitors of extracellular ATP signaling. Ex vivo full thickness subcutaneous tissue explants were stretched (or not stretched) for 2 hours in the presence of suramin (purinergic repector blocker, 100 µM), apyrase (ATP degrading enzyme, 40U/ml) and vehicle control. N=3 samples per condition. ANOVA *p<.001.
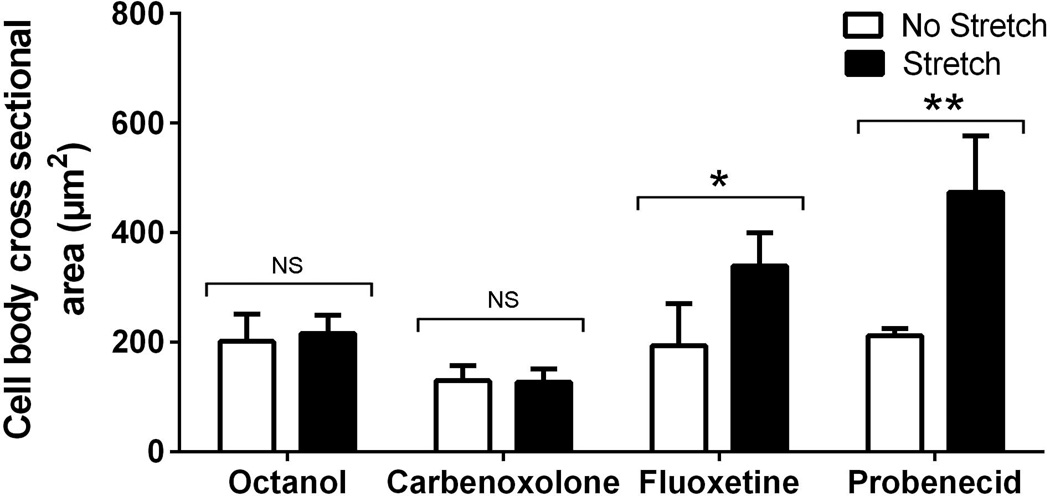
Because areolar connective tissue fibroblasts were previously shown to express connexin 43 (Langevin et al., 2004), we then investigated the potential role of connexins in this cytoskeletal response using connexin channel blockers. We found that both octanol and carbenoxolone in a low concentration inhibited the change in fibroblast shape induced by tissue stretch (Figure 4). In contrast, inhibitors of both volume regulated anion channels (fluoxetine) and pannexin channels (probenecid) failed to inhibit fibroblast expansion (Figure 4). Together, these results support the model that extracellular ATP signaling via connexin hemichannels is involved in the active change in fibroblast shape that occurs in response to a static increase in tissue length.
Figure 4.
Effect of tissue stretch on areolar connective tissue fibroblast cross sectional area in the presence of inhibitors of connexin, pannexin and VRAC channels. Ex vivo full thickness subcutaneous tissue explants were stretched (or not stretched) for 2 hours in the presence of connexin channel blockers octanol (0.63 mM) and carbenoxolone (1 µM), VRAC channel blocker fluoxetine (10 µm), pannexin channel blocker probenecid (300 µm) and vehicle control. N=3 samples per condition. ANOVA *p<.01; **p<.001.
DISCUSSION
Static stretching of areolar connective tissue produced a Rho-dependent prolonged rise in extracellular ATP levels lasting 10–20 minutes accompanied by an active, cytoskeletally-mediated change in fibroblast shape. The sustained increase in extracellular ATP observed in these experiments is not likely due to simple mechanical stimulation and/or cell injury which is typically a transient phenomenon lasting a few seconds. Our results therefore suggest that ATP was being continually released extracellularly during the period of cell expansion induced by tissue stretch.
Autocrine/paracrine ATP signaling is well documented in cultured cell (e.g. astrocytes, endothelial and smooth muscle cells) and some whole tissues (brain, smooth muscle) (Cotrina et al., 2000) (Burnstock, 1999). In this type of signaling, ATP is released extracellularly and can bind directly to P2X or P2Y receptors on the cell’s surface, as well as that of neighboring cells. ATP also can be broken down to ADP and adenosine which themselves can bind locally to specific cell surface receptors. We have recently shown that exposure of cultured fibroblast to purine receptor agonists including ATP, ADP, UTP, and BzATP induced both a rise in intracellular Ca2+ and a transient disassembly of the actin cytoskeleton (Goldman Cell Calcium, In Press). The Ca2+ pump inhibitor, cyclopiazonic acid (CPA) eliminated both the purine induced Ca2+ increase and the actin cytoskeleton disassembly. However, elevations of cytosolic Ca2+ were in themselves not sufficient, since the Ca2+ ionophore A-23187 did not induce significant alterations in the fibroblast actin organization, despite triggering robust increases in cytosolic Ca2+.
To our knowledge, extracellular ATP signaling has not previously been documented in whole connective tissue. The results of the current study suggest that the reason for this lack of previous evidence is the relatively low levels of ATP released by connective tissue fibroblasts, compared with other tissues such as brain and smooth muscle. Prior to this study, we conducted ATP bioluminescence live imaging experiments in which areolar connective tissue samples were stretched uniaxially, as in the experiment above, as well as stretched from an initial focal point via winding around an inserted needle as previously described (Langevin et al., 2006a). We did not observe any sustained increase in ATP luminescence, nor were we able to visualize any “wave” of ATP initially released from the position of needle insertion and gradually spreading across the tissue. These negative results were subsequently explained by the relatively low (picomolar range) concentrations of ATP measured in the bath solution in the current study in response to tissue stretch as shown in Figure 2, which was well below the detection limit of the ATP luminescence imaging using a high-sensitive camera which is in the nanomolar range (Supplementary Figure).
Several potential mechanisms leading to extracellular ATP release have been described including vesicular exocytosis, ATP cassette-binding transporters, ATP formation by plasma membrane ATP synthase, release through volume-regulated anion channels (VRAC), and release via connexin and pannexin hemichannels (Lohman et al., 2012). Among these mechanisms, the release of ATP through both VRAC and hemichannels have been shown to involve cytoskeleton remodeling in cultured astrocytes and endothelial cells respectively (Cotrina et al., 1998; Koyama et al., 2009) and therefore these mechanisms could plausibly participate in other cellular responses involving changes in cell shape. In our study, the absence of fibroblast expansion in the presence of connexin channel blockers (but not VRAC and pannexin blockers) supports the hypothesis that connexin-mediated extracellular ATP signaling is necessary for fibroblasts to actively expand in response to static tissue stretch.
Areolar connective tissue forms a body-wide cellular network, and thus stretch-induced sustained ATP release within this network could potentially be relevant to treatments such as manual therapies and acupuncture that apply mechanical stimulation to connective tissue. In vivo microdialysis experiments in mice showed that the manual rotation of acupuncture needles caused a sustained local release of ATP as well as adenosine, which led to analgesia via binding to adenosine A1 receptors (Goldman et al., 2010). Manual rotation of acupuncture needles causes winding of areolar connective tissue as well as sustained fibroblast expansion similar to that caused by static tissue stretch, up to several centimeters away from the needle (Langevin et al., 2006a; Langevin et al., 2007). Thus, the results of the current study suggest that fibroblast responsiveness along a plane of connective tissue could be the source of purines that led to adenosine-mediated acupuncture analgesia some distance away from the needle. Measurement of adenosine was not feasible in this study due to the low concentrations of purines measured in our ex vivo experimental system, and therefore further in vivo microdialysis experiments will be needed to confirm this possible explanation.
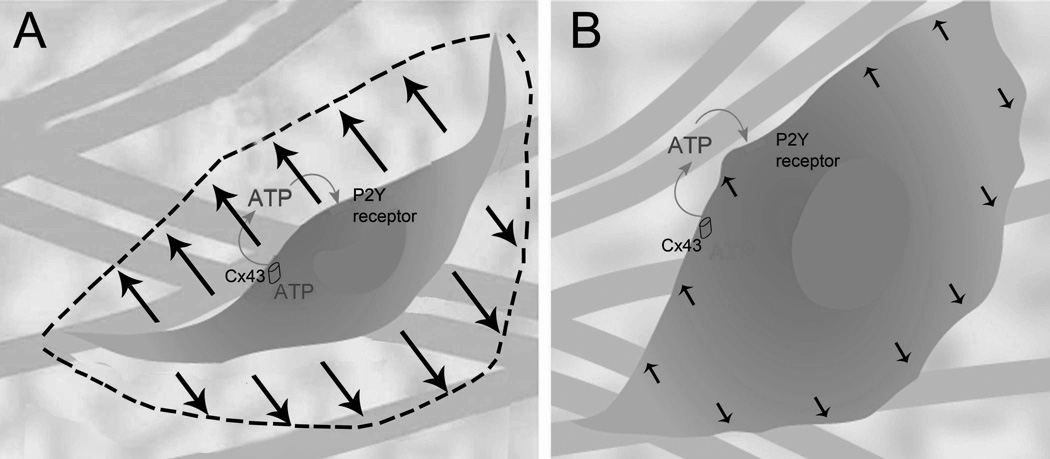
In summary, we found that static stretching of whole areolar connective tissue ex vivo resulted in a sustained Rho dependent increase in extracellular ATP for 20 minutes that slowly returned to baseline within 50 minutes. During the same time frame, fibroblasts changed shape from stellate to expanded and flattened, and this change in cell shape required functioning connexin channels and ATP binding to cell surface receptors. Taken together, these results support the model, illustrated in Figure 5, that extracellular ATP release and autocrine/paracrine ATP binding may be part of the mechanism by which fibroblasts change shape in response to sustained stretching of the tissue.
Figure 5.
Schematic illustration of proposed model. Cellular expansion in response tissue stretch requires ATP released through connexin hemichannels and binding to cell surface purinergic receptors.
Supplementary Material
Detection of ATP release by bioluminescence imaging. Upper: ATP release was imaged by chemiluminescence as described (Arcuino et al. PNAS 99(14): 9840–9845, 2002). Light production from the luciferin—luciferase reaction was captured every 10 sec by a liquid nitrogen-cooled charge-coupled camera (VersArray 1300B, Princeton Instruments, Trenton, NJ) with a 35mm lens. ATP solutions were applied with glass micropipette (3 µm tip diameter, white line) with pressure (10 psi for 2 sec) into bath of Hanks balanced salt solution containing ATP assay mix (Sigma). Lower: Summary histograms of luminescence intensity captured by the camera. From the curve-fit, the lowest detectable ATP standard was calculated to be 6.5 nM.
Acknowledgements
The authors thank Dr. Alan K. Howe for helpful discussions. This work was funded in part by the National Institutes of Health Center for Complementary and Alternative Medicine research Grant RO1-AT01121. Its contents are solely the responsibility of the authors and do not necessarily represent the official views of the National Institutes of Health.
Footnotes
The authors have no financial conflicts of interest.
REFERENCES
- Burnstock G. Release of vasoactive substances from endothelial cells by shear stress and purinergic mechanosensory transduction. J Anat. 1999;194(Pt 3):335–342. doi: 10.1046/j.1469-7580.1999.19430335.x. [DOI] [PMC free article] [PubMed] [Google Scholar]
- Corriden R, Insel PA. New insights regarding the regulation of chemotaxis by nucleotides, adenosine, and their receptors. Purinergic Signal. 2012;8(3):587–598. doi: 10.1007/s11302-012-9311-x. [DOI] [PMC free article] [PubMed] [Google Scholar]
- Cotrina ML, Lin JH, Lopez-Garcia JC, Naus CC, Nedergaard M. ATP-mediated glia signaling. J Neurosci. 2000;20(8):2835–2844. doi: 10.1523/JNEUROSCI.20-08-02835.2000. [DOI] [PMC free article] [PubMed] [Google Scholar]
- Cotrina ML, Lin JH, Nedergaard M. Cytoskeletal assembly and ATP release regulate astrocytic calcium signaling. J Neurosci. 1998;18(21):8794–8804. doi: 10.1523/JNEUROSCI.18-21-08794.1998. [DOI] [PMC free article] [PubMed] [Google Scholar]
- Goldman N, Chen M, Fujita T, Xu Q, Peng W, Liu W, Jensen TK, Pei Y, Wang F, Han X, Chen JF, Schnermann J, Takano T, Bekar L, Tieu K, Nedergaard M. Adenosine A1 receptors mediate local anti-nociceptive effects of acupuncture. Nat Neurosci. 2010 doi: 10.1038/nn.2562. [DOI] [PMC free article] [PubMed] [Google Scholar]
- Koyama T, Kimura C, Hayashi M, Watanabe M, Karashima Y, Oike M. Hypergravity induces ATP release and actin reorganization via tyrosine phosphorylation and RhoA activation in bovine endothelial cells. Pflugers Arch. 2009;457(4):711–719. doi: 10.1007/s00424-008-0544-z. [DOI] [PubMed] [Google Scholar]
- Koyama T, Oike M, Ito Y. Involvement of Rho-kinase and tyrosine kinase in hypotonic stress-induced ATP release in bovine aortic endothelial cells. J Physiol. 2001;532(Pt 3):759–769. doi: 10.1111/j.1469-7793.2001.0759e.x. [DOI] [PMC free article] [PubMed] [Google Scholar]
- Langevin HM, Bouffard NA, Badger GJ, Churchill DL, Howe AK. Subcutaneous tissue fibroblast cytoskeletal remodeling induced by acupuncture: Evidence for a mechanotransduction-based mechanism. J Cell Physiol. 2006a;207(3):767–774. doi: 10.1002/jcp.20623. [DOI] [PubMed] [Google Scholar]
- Langevin HM, Bouffard NA, Badger GJ, Iatridis JC, Howe AK. Dynamic fibroblast cytoskeletal response to subcutaneous tissue stretch ex vivo and in vivo. Am J Physiol Cell Physiol. 2005;288(3):C747–C756. doi: 10.1152/ajpcell.00420.2004. [DOI] [PubMed] [Google Scholar]
- Langevin HM, Bouffard NA, Churchill DL, Badger GJ. Connective tissue fibroblast response to acupuncture: dose-dependent effect of bidirectional needle rotation. J Altern Complement Med. 2007;13(3):355–360. doi: 10.1089/acm.2007.6351. [DOI] [PMC free article] [PubMed] [Google Scholar]
- Langevin HM, Bouffard NA, Fox JR, Palmer BM, Wu J, Iatridis JC, Barnes WD, Badger GJ, Howe AK. Fibroblast cytoskeletal remodeling contributes to connective tissue tension. J Cell Physiol. 2011;226(5):1166–1175. doi: 10.1002/jcp.22442. [DOI] [PMC free article] [PubMed] [Google Scholar]
- Langevin HM, Cornbrooks CJ, Taatjes DJ. Fibroblasts form a body-wide cellular network. Histochem Cell Biol. 2004;122(1):7–15. doi: 10.1007/s00418-004-0667-z. [DOI] [PubMed] [Google Scholar]
- Langevin HM, Hammerschlag R, Lao L, Napadow V, Schnyer RN, Sherman KJ. Controversies in acupuncture research: selection of controls and outcome measures in acupuncture clinical trials. J Altern Complement Med. 2006b;12(10):943–953. doi: 10.1089/acm.2006.12.943. [DOI] [PubMed] [Google Scholar]
- Lazarowski ER. Vesicular and conductive mechanisms of nucleotide release. Purinergic Signal. 2012;8(3):359–373. doi: 10.1007/s11302-012-9304-9. [DOI] [PMC free article] [PubMed] [Google Scholar]
- Lohman AW, Billaud M, Isakson BE. Mechanisms of ATP Release and Signaling in the Blood Vessel Wall. Cardiovasc Res. 2012 doi: 10.1093/cvr/cvs187. [DOI] [PMC free article] [PubMed] [Google Scholar]
- Lu D, Soleymani S, Madakshire R, Insel PA. ATP released from cardiac fibroblasts via connexin hemichannels activates profibrotic P2Y2 receptors. FASEB J. 2012;26(6):2580–2591. doi: 10.1096/fj.12-204677. [DOI] [PMC free article] [PubMed] [Google Scholar]
Associated Data
This section collects any data citations, data availability statements, or supplementary materials included in this article.
Supplementary Materials
Detection of ATP release by bioluminescence imaging. Upper: ATP release was imaged by chemiluminescence as described (Arcuino et al. PNAS 99(14): 9840–9845, 2002). Light production from the luciferin—luciferase reaction was captured every 10 sec by a liquid nitrogen-cooled charge-coupled camera (VersArray 1300B, Princeton Instruments, Trenton, NJ) with a 35mm lens. ATP solutions were applied with glass micropipette (3 µm tip diameter, white line) with pressure (10 psi for 2 sec) into bath of Hanks balanced salt solution containing ATP assay mix (Sigma). Lower: Summary histograms of luminescence intensity captured by the camera. From the curve-fit, the lowest detectable ATP standard was calculated to be 6.5 nM.


