

Abstract
Nuclear factor kappa B (NF-κB)/rel is the family of ubiquitous transcriptional activators involved in regulation of diverse immune and inflammatory responses. It also plays a role in control of cell growth and apoptosis. In its inactive form NF-κB remains in the cytoplasm sequestered through interaction with IκB protein. Rapid translocation of NF-κB from cytoplasm to nucleus that occurs in response to extracellular signals is considered to be a hallmark feature of its activation. The translocation of NF-κB in HL-60, U-937 and Jurkat leukemic cells as well as in human fibroblasts induced by tumor necrosis factor α (TNF-α) or phorbol myristate acetate (PMA) was presently measured by laser scanning cytometry (LSC). NF-κB was detected immunocytochemically with FITC-tagged antibody and its presence in the nucleus vis-a-vis cytoplasm was monitored by measuring the green fluorescence integrated over the nucleus, which was counter-stained with propidium iodide (PI), and over the cytoplasm, respectively. Activation of NF-κB led to a rapid increase in NF-κB-associated fluorescence measured over the nucleus (FN) concomitant with a decrease in fluorescence over the cytoplasm (FC), which was reflected by an increase in FN/FC ratio. This rapid assay of NF-κB activation can be combined with morphological identification of the activated cells or with their immunophenotype. Bivariate analysis of NF-κB expression versus cellular DNA content makes it possible to correlate its activation with the cell cycle position. The described method has a potential to be used as a functional assay to monitor intracellular translocation of other transcriptional activators such as p53 tumor suppressor protein or signal transduction molecules.
Key terms: nucleus, cytoplasm, tumor necrosis factor
The transcriptional activator nuclear factor kappa B (NF-κB) plays a critical role in cellular response to a variety of stimuli such as pro-inflammatory cytokines, cytotoxic agents, bacterial or viral components as well as other physiological and nonphysiological agents (1–3,9,22,25,27). The factor is involved not only in regulation of the inflammatory response but also in a wide spectrum of other physiological and pathological states, including cancer, tissue injury, sepsis and immunological diseases. With exception of B lymphocyte lineage cells where NF-κB is also localized in the nucleus, in other cell types it remains in the cytoplasm sequestered through interaction with one of the inhibitory proteins of IκB family (1–3, 22,27). The mechanism of activation of NF-κB involves formation of the reactive oxygen intermediates, which act downstream along the activation pathway, triggering phosphorylation and degradation of IκB (1,3,21). Phosphorylation, which is carried out by specific kinase complexes, occurs at critical serine residues of IκB and results in a release of NF-κB which then moves into the nucleus. Free NF-κB is a dimer consisting of p65 (product of RelA gene) and p50 (product of NFκB-1 gene). The rapid translocation of NF-κB from cytoplasm to nucleus triggered by extracellular signals is one of the most characteristic features of this ubiquitous transcription factor (1–3,9,22,25,27).
Current methods of detection of NF-κB activation suffer shortcomings. Measurement of the presence of the DNA-bound factor in the nucleus (i.e. active form of the factor) requires nuclear isolation, followed by bulk analysis of NF-κB in the nuclear fraction or its binding to DNA by the DNA gel mobility shift assay (19,24). This approach does not provide any information on cellular heterogeneity, activation of different cell subpopulations, relationship of the activation to cell cycle position, etc. Microscopic observation of the translocation of NF-κBs into the nucleus (following its immunocytochemical staining) is subjective, not quantitative, and not always possible without confocal microscopy.
A flow cytometric method was recently described to detect activation of NF-κB in granulocytes and mononuclear cells of human peripheral blood by endotoxin (12). The active, nuclear bound, fraction of NF-κB was detected by lysing the cells and using “washless” procedure to immunocytochemically label this factor in the isolated nuclei (12,16). Based on differences in light scatter of the isolated nuclei it was possible to distinguish activation of granulocytes from mononuclear cells (12).
In the present study we describe an approach to analyze activation of NF-κB using the microscope-based laser scanning cytometer (LSC; 15). Similar to flow cytometry, LSC allows one to measure large cell populations rapidly and with high accuracy (4–6,13–15,17). Because there is no cell loss during cell preparation prior to fluorescence measurement, LSC can be used to analyze cell samples containing relatively few cells such as fine needle aspirates (13). In addition, the instrument offers a possibility to perform repeated measurements of the same of cells, a feature useful for kinetic studies or for sequential cell staining with different fluorochromes (6). Among other advantages, LSC allows one to morphologically identify the cells whose fluorescence has been measured as well as to reveal the intracellular distribution of the fluorescence, e.g. its localization in the nucleus or cytoplasm. The latter feature tempted us to test utility of LSC in assaying the activation of NF-κB. The translocation of this factor from cytoplasm to nucleus was presently studied in U-937, HL-60 and Jurkat cells as well as in normal human fibroblasts during their activation by tumor necrosis factor α (TNF-α) or phorbol myristate acetate (PMA). The data indicate that LSC offers a possibility of rapid assay of NF-κB activation, which also can be combined with morphological identification of the activated cells. Bivariate analysis of NF-κB expression in nucleus or cytoplasm makes it also possible to correlate NF-κB activation with the cell cycle position.
MATERIALS AND METHODS
Cells
Human leukemia cell line HL-60, human lymphoma cell line U-937, and human fibroblasts 2077 were obtained from American Type Culture Collection (Rockville, MD). Human T cell leukemic Jurkat SN cells were kindly provided by Dr. Douglas Green of the La Jolla Institute for Allergy and Immunology (La Jolla, CA). The cells were cultured in RPMI 1640 supplemented with 10% fetal bovine serum and antibiotics, as described by us previously (4–6,11). All media, supplements, and antibiotics were obtained from Life Technologies (Grand Island, NY). The cultures were periodically tested for Mycoplasma infection. To maintain asynchronous exponential growth, the cultures were passaged by diluting to a concentration of 1×10⁵ cells/ml density and were repassaged before approaching 5×10⁵ cells/ml density.
Drugs
Human recombinant TNF-α was obtained from Sigma Chemical Company (St. Louis, MO). The stock solution was prepared according to the manufacturer’s recommendation and was used at 10 or 20 ng/ml final concentration in cultures for 1 h. PMA, N-α-p-tosyl-l-lysine chloro-methyl ketone (TLCK) and genistein also were obtained from Sigma and were dissolved in dimethyl sulfoxide (DMSO; Sigma) at 0.1, 1.0 and 0.1 M respectively. Stock solutions of these reagents were stored at −20 °C and the reagents were used at final concentrations of 40 nM, 300 μM and 50 μM respectively. Exponentially growing cells were preincubated with either TLCK or genistein for 1 h before adding TNF-α. Control cultures were treated with equivalent volumes of DMSO. Other details of the treatment are given in Figure legends.
Antibodies to NF-κB
The purified mouse IgG3 anti-NF-κB mAb (clone 12H11) was obtained from Boehringer Mannheim (Indianapolis, IN). This antibody (p65bm), recognizes an epitope overlapping the nuclear location signal (NLS) of the human p65 subunit of NF-κB. Rabbit polyclonal NF-κB p65 antibody (p65sc), which recognizes amino acids 3–19 within the NH2 terminus of p65 subunit of human NF-κB (also referred to as RelA p65), was obtained from Santa Cruz Biotechnology, Inc. (Santa Cruz, CA). Both anti-p65 Ab were applicable to immunocytochemical detection of NF-κB.
Immunocytochemical detection of NF-κB
NF-κB was immunocytochemically detected either on the cells that were first attached to the microscope slides, then fixed and incubated with the antibody on slides, or by incubating the cells in suspension with the antibody, then placing them on microscope slides for analysis by LSC. In the first case, the cells were attached to microscope slides by cytocentrifugation at 1000 rpm for 6 min, using a Shandon Cytospin 3 centrifuge (Shandon Co., Pittsburgh, PA), then fixed in methanol free 1 % formaldehyde in phosphate buffered saline (PBS) for 15 min on ice, washed with PBS, transferred into 70 % ethanol at −20 °C and stored for up to 24 h before subjecting to incubations with antibody. The cells in suspension also were fixed in 1 % formaldehyde, then washed in PBS, suspended in 70% ice-cold ethanol and stored at −20 °C for up to 24 h. After fixation, the cells were washed twice with PBS containing 1 % bovine serum albumin (BSA) and 0.1 % sodium azide (PBS-BSA). The cell pellets were then resuspended in 100 μl PBS-BSA containing 2 μg of anti-NF-κB Ab and incubated for 2 h at room temperature. Mouse anti-IgG and rabbit anti-Ig served as isotype negative controls. After incubation with primary Ab, the cells were rinsed with PBS-BSA and incubated with 100 μl of FITC-conjugated goat-anti mouse F(ab′)2 (DAKO Corp., Carpinteria, CA). Diluted 1:20 in PBS-BSA or 100 μl of FITC-conjugated anti rabbit Ig and diluted 1:50 (Santa Cruz) were added respectively for 1 h at room temperature. Cellular DNA was then counter-stained by addition of 1 ml of a solution containing 5 μg/ml of propidium iodide (PI; Molecular Probes Inc., Eugene, OR) and 100 μg/ml RNase A (Sigma) for 25 min at room temperature. The cells were placed on microscope slides mounted under coverslips and analyzed by LSC. At least 5 ×10³ cells were analyzed by LSC per slide. Details of cells analysis by LSC are provided in recent publications (4–6, 13,14).
RESULTS
Figure 1 illustrates the strategy used to measure the NF-κB-associated (FITC) fluorescence separately in the cell nucleus and the cytoplasm by LSC. The triggering threshold (“threshold contour”) was set on red fluorescence of the cells whose DNA (nucleus) was counterstained with PI. The green fluorescence (integrated value) was then measured in two distinct areas. The first (nuclear) area was within the triggering threshold plus four pixels towards the outside of the threshold (“integration contour”; i). This area essentially covered the whole cell nucleus. The green fluorescence integrated over it, and thus, represented NF-κB-fluorescence localized predominantly within the nucleus. The second area (“peripheral contour”; p) consisted of a rim of cytoplasm of 8 pixels width located outside of the measured nuclear area. The green fluorescence integrated over this area, therefore, represented the cytoplasm-bound NF-κB. A background fluorescence, which was automatically measured outside of the cell, as shown in Figure 1 (“background contour”; b), was subtracted from both, nuclear and cytoplasmic fluorescence. Integrated red and green fluorescence over the nuclear area as well as integrated green fluorescence over the cytoplasm were recorded.
Fig. 1.

Measurement of nuclear and cytoplasmic NF-κB- associated fluorescence by LSC. Green (FITC) fluorescence was measured separately over the nucleus (FN) and cytoplasm (FC). FN (integrated fluorescence) was measured within the area outlined by the “integration contour” which was located in all experiments except these shown in Figure 6, four pixels (i) outside the “threshold contour”. The latter was the red fluorescence (PI) triggering threshold, placed at one-third distance from the edge of the nucleus towards the nucleus center, as described in the manual for LSC. FC (integrated “peripheral fluorescence”) was measured within the rim of cytoplasm 8 pixels wide (p) located outside the measured nuclear area. The background green fluorescence (b) was automatically measured outside the cell (15) and was subtracted from both, nuclear and cytoplasmic green fluorescence, to obtain final values of FN and FC, respectively.
The changes in fluorescence of U-937 cells treated with TNF-α are shown in Figure 2. Administration of TNF-α led to the increase in integrated green (FITC) fluorescence measured over nuclear area (FN) and a concomitant decrease in green fluorescence over cytoplasmic area (FC). As a result, the FN/FC ratio was markedly increased in TNF-α treated cells (Fig. 2E). Because based on differences in DNA content it was possible to distinguish G1, S and G2/M cells, the FN/FC ratio could be estimated for cells in each of these phases, by gating analysis. As is evident, the TNF-α induced increase in FN/FC ratio was similar regard-less of the phase of the cell cycle (Fig. 2F). The “Compu-Sort” feature of LSC, which allows morphological identification of the measured cells (15), revealed a correlation between the cell and nuclear size and cell cycle position, as the cells with a G1 DNA content were the smallest, G2/M cells were larger, had large nucleus and some were in mitosis, and S phase cells were of the intermediate size (not shown).
Fig. 2.

Changes in FN, FC and FN/FC ratio of U-937 cells treated with 10 ng/ml of TNF-α for 1 h. Panels A and B show scattergrams representing FN and FC, respectively, versus DNA content prior to the treatment; panels C and D, FN and FC, respectively, after the treatment. Panel E shows the change in FN, panel F, the change in FN/FC. The G1, S and G2/M cells were sorted based on differences in their DNA content for morphological evaluation. Bars indicate FN/FC of the cells gated in G1, S and G2/M based on differences in their PI fluorescence (DNA content) as shown in panel A. Striped bars, prior to TNF-α treatment; shaded bars, after the treatment.
The TNF-α induced increase in FN/FC also was observed in human promyelocytic HL-60 and Jurkat T-cell leukemic cells as well as in normal fibroblasts (Figs. 3 and 4). In the case of fibroblasts, the increase in FN was of a greater magnitude that the increase in FN/FC. Preincubation of cells with TLCK, the inhibitor of chymotrypsin-like enzymes (10), an agent known to prevent activation of NF-κB (20) abolished the TNF-α induced increase in FN/FC (Fig. 3G, H). Genistein, another inhibitor of NF-κB activation (20) also prevented the increase in FN/FC of Jurkat cells after the induction by TNF-α (not shown).
Fig. 3.

Changes in FN and FN/FC of HL-60 cells (panels A, B), human fibroblasts (C, D) and Jurkat cells (E, F) treated with 10 ng/ml of TNF-α for 1 h. Panels G and H show FN and FN/FC of U-937 cells pretreated with TLCK for 1 h and then treated with TNF-α for an additional 1 h.
Fig. 4.

Percent increase in FN and FN/FC ratio of U-937, HL-60, fibroblasts and Jurkat cells treated with 10 (U-937, HL-60, Jurkat) or 20 ng/ml (fibroblasts) of TNF-α for 1 h. The last set of bars shows represents Jurkat cells pretreated with TLCK to inhibit activation of NF-κB (20).
Figure 5 shows changes in FN and FN/FC ratio as a function of time of incubation with TNF-α. The kinetics of the response to TNF-α were somewhat different when expressed by the increase in nuclear fluorescence compared to the change in FN/FC ratio. The peak of FN was observed at 40 min after administration of TNF-α, which was followed by rather a steep decline. In contrast, FN/FC ratio peaked at 60 min, and the decline was less pronounced compared to that of FN.
Fig. 5.

Changes in FN and FN/FC during incubation of Jurkat cells with 20 ng/ml of TNF-α for up to 120 min.
We have also tested how a variation in the LSC setting defining conditions of measurement of nuclear versus cytoplasmic fluorescence may affect the observed increase of FN/FC induced by activation of NF-κ B. Towards this end U-937 cells were treated with PMA while fibroblasts with TNF-α, and their FN and FC were measured under different settings of the threshold contour, intergration contour and different width of the peripheral contour, as described in the legend to Figure 6.
Fig. 6.
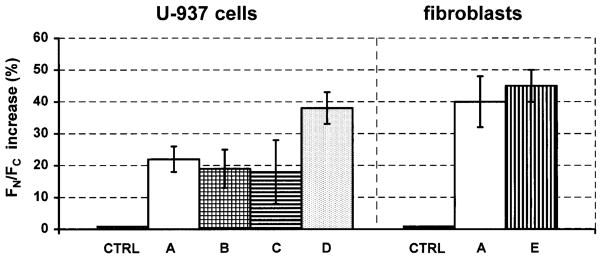
Effect of a variation in the setting that defines conditions of the measurement of nuclear versus cytoplasmic fluorescence on the degree of increase of FN/FC induced by activation of NF-κB. To activate NF-κB U-937 cells were treated with 40 nM PMA for 45 min while fibroblasts with 20 ng/ml of TNF-α for1 h. Their FN and FC before and after the treatment were measured under different settings of the threshold contour (tc), integration contour (i) and different width of the peripheral contour (width of the measured cytoplasmic rim; p) as marked in Figure 1. At setting A, tc was at 300 units, i was 2 pixels ouside tc and p was 8 pixels. At setting B, tc was at 500 units, i was 2 pixels and p was 8 pixels. At setting C, tc was at 300 units, i was 4 pixels and p was 4 pixels. At setting D, the tc was at 500 units, i was 4 pixels and p was 4 pixels. At setting E, tc was at 300 units, i was 4 pixels and p was 8 pixels. Control (CTRL) represents analysis of the cells which were treated with the respective diluents instead of PMA or TNF-α; their FN and FC was measured at setting A. Mean values of triplicate cultures ± SE.
As is evident, the increase in FN/FC ratio as a result of NF-κB activation was observed for both, U-937 cells as well as fibroblasts, at each setting (Fig. 6). The increase in FN/FC ratio, however, was greater when the threshold contour was set at higher level (500 units), the nuclear integration area was larger (stretching to four pixels outside the threshold contour) and the peripheral contour (cytoplasmic rim) was narrow (four pixels; U-937 cells, setting D). These conditions, apparently, provided optimal discrimination between the nuclear and cytoplasmic area.
DISCUSSION
Activation of NF-κB plays a pivotal role in a variety of cellular processes which include inflammation, immune reactions and cytotoxic responses of tumor cells to a variety of drugs. The cell survival genes are often recruited by NF-κB, which results in protection of cells from apoptosis and increased resistance of tumor cells to treatment (7,8,18,23,26). A simple and rapid assay of NF-κB activation, thus, is of special value in immunology and oncology. The present results indicate that NF-κB activation, as expressed by its translocation from the cytoplasm to nucleus, can be conveniently assayed by LSC by measuring intensity of the NF-κB-associated immunofluorescence over the area of cell nucleus and comparing it with the intensity over the cytoplasm. The observed increase in FN, or increase in FN/FC ratio, as a result of cell treatment with TNF-α or PMA, appears to be a sensitive indicator of the translocation.
The assay of NF-κB activation by LSC offers several advantages over currently used methods. It also provides an insight into the mechanism of activation itself, not available by other methods. Thus for example, comparison of U-937 or HL-60 cells with fibroblasts (Fig. 2) reveals different responses of these cells to TNF-α. Namely, while in the case of U-937 or HL-60 cells the increase in FN/FC was of a greater magnitude that the increase in FN, fibroblasts responded to TNF-α by a greater increase in FN than in the FN/FC ratio. This indicates that while in U-937 cells the FN increase was accompanied by FC decrease, in fibroblasts both FN and FC were increased, though FN to a greater degree than FC. This observation suggests that activation of NF-κB in U-937 cells involved primarily its translocation from cytoplasm into the nucleus. Its activation in fibroblasts, on the other hand, in addition to translocation also seemed to involve its synthesis and accumulation in cytoplasm. An alternative explanation of this observation is that the NF-κB epitope in the cytoplasm of fibroblasts was not fully accessible to the used mAb but become unmasked and accessible after their activation with TNF-α. Similar interpretation can be advanced to explain the observed differences in kinetics of FN vs. FN/FC response to TNF-α (Fig. 4). Namely, the rapid decrease in FN seen after 40 min may indicate NF-κB degradation in the nucleus or its tight binding to chromatin that results in restriction of accessibility of its epitope. The still increased FN/FC after 40 min reflects a continuing decrease in the level of NF-κB in the cytoplasm.
Unlike visual inspection of cells under a fluorescent microscope, the present assay is objective, and rapid, which allows measures of large numbers of cells per sample. Subpopulations of cells can be then identified based on differences in their morphology or DNA content. Thus, activation of NF-κB can be related to a particular cell type or correlated with the cell cycle position (Fig. 2G, H) or DNA ploidy. Furthermore, the assay may be combined with an additional immunocytochemical marker to identify subpopulations of cells responding or nonresponding by NF-κB activation to a particular treatment, e.g. based on their surface immunophenotype, cytokine production, or proliferation marker. Because the assay can be done on cells that are attached to microscope slides, there is no cell loss which otherwise occurs and which may be selective to particular cell types, during repeated centrifugations, e.g. in preparation of cell samples for flow cytometry (6). Also, the same specimens may be re-analyzed by other techniques and/or stored indefinitely for possible future retrieval.
The degree of NF-κB activation can be expressed by the present assay either as percent increase in FN or FN/FC ratio. Both indices reveal the extent of translocation of the factor to the nucleus. Such quantitation, although in relative terms, makes it possible to investigate a correlation between the degree of activation of NF-κB and a variety of functional or molecular changes related to an immunological or apoptotic response of the cell to a particular stimulus. It is unknown, at present, what are the consequences when different amounts of NF-κB are translocated from cytoplasm into nucleus in response to different stimuli, or to the same stimulus but at different intensity.
It should be stressed, however, that because quantitation of the NF-κB translocation by the present assay is expressed in relative and not absolute units, the method does not allow to quantify the number of NF-κB molecules translocated into the nucleus. Furthermore, the percent increase in FN or FN/FC ratio is influenced by the thickness of a layer of the cytoplasm above and below the nucleus of the attached cell as well as by the contribution from nonspecific fluorescence. For example, subtraction of the fluorescence of isotype controls from the nuclear and cytoplasmic fluorescence of the cells stained with anti-NF-κB enhances the response to TNF-α, measured by the increase in FN/FC, by 10 – 20 % (data not shown). Also, because for technical reason FC is measured within a rim of cytoplasm rather than in all cytoplasm, even when no new NF-κB is synthesized, the numerical value of FC decrease is not compensated by the FN increase. The comparison of a degree of NF-κB activation by the present assay, to be quantitative, has to be limited to cells with similar geometry. Stretched cells, such as the cells growing attached to microscope slides or coverslips or the cells that were flattened by cytocentrifugation have more advantageous geometry to measure NF-κB translocation compared to cells that are spherical.
The present assay can be adapted to detect translocation of other than NF-κB molecules from cytoplasm to nucleus or vice versa. Experiments are underway in our laboratory to monitor translocation of the tumor suppressor p53 protein to the nucleus in response to DNA damage by antitumor modalities.
Acknowledgments
Contract grant sponsor: NIH; Contract grant number: CA 28704; Contract grant sponsor: Chemotherapy Foundation; Contract grant sponsor: Alfred Jurzykowski Foundation.
Dr. A. Deptala is on leave from the Department of Internal Medicine and Hematology, Warsaw Medical University, Warsaw, Poland. Dr. E. Bedner, who is the recipient of an Alfred Jurzykowski Foundation fellowship, is on leave from the Department of Pathology, Pomeranian School of Medicine, Szczecin, Poland.
LITERATURE CITED
- 1.Baeuerle PA, Baltimore D. NF-κB: Ten years after. Cell. 1996;87:13–20. doi: 10.1016/s0092-8674(00)81318-5. [DOI] [PubMed] [Google Scholar]
- 2.Baeuerle PA, Henkel T. Function and activation of NF-κB in the immune system. Annu Rev Immunol. 1994;12:141–179. doi: 10.1146/annurev.iy.12.040194.001041. [DOI] [PubMed] [Google Scholar]
- 3.Baldwin AS., Jr The NF-κB and IκB proteins: New discoveries and insights. Annu Rev Immunol. 1996;14:649–681. doi: 10.1146/annurev.immunol.14.1.649. [DOI] [PubMed] [Google Scholar]
- 4.Bedner E, Burfeind P, Gorczyca W, Melamed MR, Darzynkiewicz Z. Laser scanning cytometry distingushes lymphocytes, monocytes and granulocytes by differences in their chromatin structure. Cytometry. 1997;29:191–196. [PubMed] [Google Scholar]
- 5.Bedner E, Burfeind P, Hsieh T-C, Wu JM, Augero-Rosenfeld M, Melamed MR, Horowitz HW, Wormser GP, Darzynkiewicz Z. Cell cycle effects and induction of apoptosis caused by infection of HL-60 cells with human granulocytic Egrlichiosis (HGE) pathogen measured by flow and laser scanning cytometry (LSC) Cytometry. 1998;33:47–55. [PubMed] [Google Scholar]
- 6.Bedner E, Melamed MR, Darzynkiewicz Z. Enzyme kinetic reactions and fluorochrome uptake rates measured in individual cells by laser scanning cytometry (LSC) Cytometry. 1998;33:1–9. doi: 10.1002/(sici)1097-0320(19980901)33:1<1::aid-cyto1>3.0.co;2-p. [DOI] [PubMed] [Google Scholar]
- 7.Beg AA, Baltimore D. An essential role for NFκB in preventing TNF-α-induced cell death. Science. 1996;274:782–784. doi: 10.1126/science.274.5288.782. [DOI] [PubMed] [Google Scholar]
- 8.Boland MP, Foster SJ, O’Neill LAJ. Daunarubicin activates NFκB and induces κB-dependent gene expression in HL-60 promyelocytic and Jurkat T lymphoma cells. J Biol Chem. 1997;272:12952–12960. doi: 10.1074/jbc.272.20.12952. [DOI] [PubMed] [Google Scholar]
- 9.Bours V, Franzoso G, Brown K, Park S, Azarenko V, Tomita-Yamaguchi M, Kelly K, Siebenlist U. Lymphocyte activation and the family of NF-κB transcription factor complexes. Curr Top Microbiol Immunol. 1992;182:411–420. doi: 10.1007/978-3-642-77633-5_52. [DOI] [PubMed] [Google Scholar]
- 10.Darzynkiewicz Z, Barnard EA. Specific proteases of rat mast cells. Nature. 1967;213:1198–1203. [Google Scholar]
- 11.Deptala A, Halicka HD, Ardelt B, Ardelt W, Mikulski SM, Shogen K, Darzynkiewicz Z. Potentiation of tumor necrosis factor induced apoptosis by onconase. Int J Oncol. 1998;13:11–16. doi: 10.3892/ijo.13.1.11. [DOI] [PubMed] [Google Scholar]
- 12.Foulds S. Novel flow cytometric method for quantifying nuclear binding of the transcription factor nuclear factor kappa B in unseparated human monocytes and polymorphonuclear cells. Cytometry. 1997;29:182–186. [PubMed] [Google Scholar]
- 13.Gorczyca W, Darzynkiewicz Z, Melamed MR. Laser scanning cytometry in pathology of solid tumors. Acta Cytol. 1997;41:98–108. doi: 10.1159/000332313. [DOI] [PubMed] [Google Scholar]
- 14.Gorczyca W, Melamed MR, Darzynkiewicz Z. Laser scanning cytometer (LSC) analysis of fraction of labeled mitoses (FLM) Cell Prolif. 1996;29:539–547. doi: 10.1111/j.1365-2184.1996.tb00969.x. [DOI] [PubMed] [Google Scholar]
- 15.Kamentsky LA, Burger DE, Gershman RJ, Kamentsky LD, Luther E. Slide-based laser scanning cytometry. Acta Cytol. 1997;41:123–143. doi: 10.1159/000332315. [DOI] [PubMed] [Google Scholar]
- 16.Larsen JK. “Washless” procedures for nuclear antigen detection. In: Darynkiewicz Z, Robinson JP, Crissman HA, editors. Methods in Cell Biology: Flow Cytometry, Part A. San Diego: Academic Press; 1994. pp. 380–381. [PubMed] [Google Scholar]
- 17.Luther E, Kamentsky LA. Resolution of mitotic cells using laser scanning cytometry. Cytometry. 1996;23:272–278. doi: 10.1002/(SICI)1097-0320(19960401)23:4<272::AID-CYTO2>3.0.CO;2-J. [DOI] [PubMed] [Google Scholar]
- 18.Nagata S. Apoptosis by death factor. Cell. 1997;88:355–365. doi: 10.1016/s0092-8674(00)81874-7. [DOI] [PubMed] [Google Scholar]
- 19.Packham G, Lahti JM, Fee BE, Gawn JM, Coustan-Smith E, Campana D, Douglas I, Kidd VJ, Ghosh S, Cleveland JL. Fas activates NF-κB and induces apoptosis in T-cell lines by signaling pathways distinct from those induced by TNF-α. Cell Growth Differ. 1997;4:130–139. doi: 10.1038/sj.cdd.4400217. [DOI] [PubMed] [Google Scholar]
- 20.Parikh AA, Salzman AL, Kane CD, Fischer JE, Hasselgren PO. IL-6 production in human intestinal epithelial cells following stimulation with IL-1β is associated with activation of the transcription factor NF-κB. J Surgical Res. 1997;69:139–144. doi: 10.1006/jsre.1997.5061. [DOI] [PubMed] [Google Scholar]
- 21.Schreck R, Baeuerle P. Assesing oxygen free radicals as mediators in activation of inducible eukaryotic transcription factor NF-κB. Methods Enzymol. 1994;243:151–163. doi: 10.1016/0076-6879(94)34085-4. [DOI] [PubMed] [Google Scholar]
- 22.Siebenlist U, Franzoso G, Brown K. Structure, regulation and function of NF-κB. Annu Rev Cell Biol. 1994;10:405–455. doi: 10.1146/annurev.cb.10.110194.002201. [DOI] [PubMed] [Google Scholar]
- 23.van Antwerp DJ, Martin SJ, Kafri T, Green DG, Verma IM. Suppression of TNF-α-induced apoptosis by NFκB. Science. 1996;274:787–789. doi: 10.1126/science.274.5288.787. [DOI] [PubMed] [Google Scholar]
- 24.Venaille TJ, Misso NI, Philips MJ, Robinson BW, Thompson PJ. Effects of different density gradient separation techniques on neutrofil function. Scand J Clin Lab Invest. 1994;54:385–391. doi: 10.3109/00365519409088438. [DOI] [PubMed] [Google Scholar]
- 25.Verma IM, Stevenson JK, Schwarz EM, van Antwerp D, Miyamoto S. Rel/NF-κB/IκB family: Intimate tales of association and dissociation. Gen Dev. 1995;9:2723–2735. doi: 10.1101/gad.9.22.2723. [DOI] [PubMed] [Google Scholar]
- 26.Wang C-Y, Mayo MM, Baldwin AS., Jr TNF-and cancer therapy -induced apoptosis: Potentiation by inhibition of NFκB. Science. 1996;274:784–787. doi: 10.1126/science.274.5288.784. [DOI] [PubMed] [Google Scholar]
- 27.Zabel U, Henkel T, dos Santois Silva M, Baeuerle PA. Nuclear uptake control of NF-κB by MAD-3, an IκB protein present in the nucleus. EMBO J. 1993;12:201–211. doi: 10.1002/j.1460-2075.1993.tb05646.x. [DOI] [PMC free article] [PubMed] [Google Scholar]