

Abstract
This paper describes a rapid diagnostic platform for pathogen detection based on the acetylcholinesterase-catalyzed hydrolysis reaction. Owing to the signal amplification strategies, the sensitivity of this assay is comparable to that of PCR. In addition, the readout of this assay is based on the color change of solutions, which can be easily observed by the naked eye alone.
Keywords: acetylcholinesterase-catalyzed hydrolysis, pathogen detection, high-sensitivity, gold nanoparticle, clinical samples
We present a colorimetric assay for pathogen detection based on acetylcholinesterase (AChE)-catalyzed hydrolysis reaction with ultrahigh sensitivity that is comparable to the sensitivity of polymerase chain reaction (PCR). Rapid detection of pathogen is essential for the timely clinical decision-making and management of epidemics for infectious diseases. In resource-constrained settings, however, it still remains a great challenge to identify and control the outbreak of infectious diseases at their earliest stages because of the lack of convenient and reliable diagnostic technologies.[1]
Over the past decades, many approaches have been developed for pathogen detection, including the loop-mediated isothermal amplification (LAMP),[2] electrochemistry,[3] and nanotechnology,[4] just to name a few. However, most of the detection systems failed to monitor the pathogens in clinical samples where their concentrations are generally very low. Presently, PCR amplification of viral RNA has been used as the gold standard for molecular identification of infectious diseases.[5] Although the PCR strategy exhibits ultrahigh sensitivity for pathogen detection, it requires expensive instruments and reagents and skilled labor, which limits its applications in remote settings such as developing countries where the acute infection appears to be increasing in recent years. Therefore, it is of urgent need to develop a high-sensitivity approach that can be an alternative to PCR for pathogen detection.
Here, we provide an ultrasensitive colorimetric assay aimed at providing rapid detection of pathogens, and demonstrating its utility in clinical samples. This sensing platform is virtually based on an improved heterogeneous sandwich-type enzyme-linked immunosorbent assay (ELISA). In this study, the detection sensitivity is expected to be considerably enhanced due to two rounds of amplification. In the first round, detection antibodies (denoted as Ab2) were conjugated with AChE, which catalyzes its substrate acetylthiocholine (ATC, an analogue of acetylcholine) to generate thiocholine. Thiocholine can induce aggregation of citrate-capped gold nanoparticles (citrate-AuNPs) via electrostatic interactions. This aggregation event can be reflected by the color change of the AuNP solutions from red to purple, which can be observed by the naked eye (Figure 1).[6] In the second round, magnetic beads (MBs) were used to load many thousands of AChE (31,000 AChE per MB in this study) and Ab2. This Ab2-AChE-MB format can specifically recognize the analyte that was captured by capture antibody (denoted as Ab1). Very small amount of the analytes can thus be detected because of the high density of AChE on MB where the AChE activity is highly maintained.
Figure 1.

The design of acetylcholinesterase (AChE)-catalyzed hydrolysis reaction for the colorimetric detection of enterovirus 71 (EV71). a) AChE catalyzes the hydrolysis of acetylcholine to generate acetate and choline. b) Scheme of the improved sandwich ELISA format. EV71 is pulled down onto the polystyrene (PS) substrate by capture antibody (Ab1) and recognized by detection antibody (Ab2) which was conjugated with AChE on magnetic beads (MB). In the presence of acetylthiocholine (ATC) and citrate-covered AuNPs, AChE catalyzes the hydrolysis of ATC to generate thiocholine, thus inducing the aggregation of AuNPs via electrostatic interaction.
We first demonstrated that thiocholine is capable of inducing the aggregation of citrate-AuNPs. By incubating citrate-AuNPs (15 nm in diameter, 2.3 nM) with 1 μM of thiocholine (known as 2-mercapto-N,N,N-trimethylethanaminium, 2-MTA), the chemisorbed citrate molecules can be partially removed from Au surface by means of ligand exchange, and finally the thiol ligands can be adsorbed onto the Au surfaces via Au–S bonds.[7] The positively charged groups of the ligands may interact with the negatively charged citrate residues that are still covered on the Au surfaces, causing the cross-linking of AuNPs. This process resulted in color change of the AuNP solution from red to blue and a simultaneous change of the absorption band in the visible region of the electromagnetic spectrum (Figure S1 in Supporting Information).
Then, we prepared the Ab2 and AChE-functionalized MB (Ab2-AChE-MB) using a step-by-step procedure (Scheme 1). Firstly, we chose N-hydroxysuccinimide (NHS)-activated MB to load AChE and used AChE assay kit to measure the AChE activity before and after conjugation with MB (Figure S2 in Supporting Information). The results indicate that 89.1% of the original AChE activity was maintained after the conjugation, based on which, the number of AChE on each MB was calculated to be around 31,000, similar to the work previously reported.[8] Later, we attempted to functionlize the AChE layer with Ab2 via copper-free click chemistry. Copper-free click chemistry is an effective strategy to join two molecules in a one-step procedure without generating side products. This strategy depends on the reaction of the dibenzocyclooctyl (DBCO) reagent with an azide linker to form a stable triazole in aqueous buffered media, yielding a high efficiency conjugation.[9] In this study, azide was labeled onto AChE layer by the reaction between NHS-activated azide and the remainning amines on AChE. The obtained MBs were subsequently conjugated with DBCO-labeled Ab2 (DBCO-Ab2) by means of copper-free click chemistry.
Scheme 1.
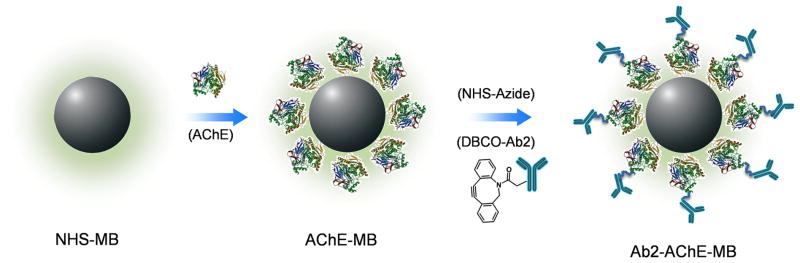
Procedure of preparing Ab2-AChE-MB. AChE molecules were coated onto MB through NHS chemistry. AChE-MB conjugate further reacted with NHS-azide, and then conjugated with DBCO-Ab2 via copper-free click chemistry to form Ab2-AChE-MB.
We investigated the sensitivity of the AuNP-based colorimetric assay for the Ab2-AChE-MB, and compared with the conventional AChE assay kit. We first applied the AuNP-based colorimetric assay to measure the activity of Ab2-AChE-MB by serial dilution of the obtained MBs to result in final concentrations of the beads ranging from 1.0 to 20×103 particles/mL. The aggregation process of AuNPs can be easily visualized by the color change of AuNP solutions from red to purple (Figure S3a in Supporting Information). Simutaneously, the UV-vis absorption (Figure S3b in Supporting Information) suggests that, with the increase of Ab2-AChE-MB concentration, the absorbance at around 520 nm decreased gradually along with the increase of the absorbance between 600 and 800 nm, indicating the formation of AuNP aggregates. The plot of A700/A520 (the ratio of absorbance at 700 nm and 520 nm) versus various concentrations of Ab2-AChE-MB reflected the linear concentration-dependent aggregation process (Figure S3c in Supporting Information). Moreover, we found that the aggregation is a time-dependent process. Figure S4 in Supporting Information shows the plots of A700/A520 values versus the incubation time (0–10 min) for various concentrations of Ab2-AChE-MB. Within the incubation time, the A700/A520 values increased except for the blank sample, whose A700/A520 values had negligible changes. By both UV-vis absorption and the naked eye, the lowest detectable concentration of Ab2-AChE-MB is 1.0 × 10³ particles/mL.
To analyze the aggregation process at the nanoscale, we applied transmission electron microscopy (TEM) to characterize the states of AuNPs before and after aggregation induced by Ab2-AChE-MB (Figure S5 in Supporting Information). The aggregation process was also supported by dynamic light scattering (DLS) data (Figure S6a in Supporting Information). The average hydrodynamic diameter of the well-dispersed citrate-AuNPs was 29.1 ± 2.51 nm, while that of the AuNP aggregates increased to 415.2 ± 23.3 nm, congruent with the TEM analysis. Additionally, the change of surface charges was monitored by zeta potential measurement (Figure S6b in Supporting Information). As reported elsewhere,[10] the citrate-AuNPs are negative in charge (−35.8 ± 1.9 mV in this study). In the presence of thiocholine (produced by the Ab2-AChE-MB-catalyzed hydrolysis of ATC), the surface charge of AuNPs was neutralized to be −2.2 ± 0.9 mV, which was attributed to the positively-charged quaternary ammonium group on thiocholine. All the measurements highly supported that a small number of Ab2-AChE-MBs can induce massive aggregation of citrate-AuNPs in the presence of ATC, making this system very promising for ultrasensitive detection of pathogens.
This AuNP-based colorimetric assay was compared with the conventional AChE assay kit for Ab2-AChE-MB detection. The principle of AChE assay kit is based on an improved Ellman method.[11] The absorbance at 412 nm is proportional to AChE activity. As shown in Figure S7 in Supporting Information, the lowest detectable concentration of Ab2-AChE-MB using AChE assay kit was determined to be 2.5 × 10⁵ particles/mL (250-fold higher than that of our assay). The high sensitivity of our assay was attributed to the very high extinction coefficient (108–1010 M−1cm−1) of AuNPs, which is at least three orders of magnitude higher than those of common organic dyes.[12]
After demonstrating that the colorimetric assay is much more sensitive than the conventional AChE assay kit, we adapted this assay into detecting enterovirus 71 (EV71) in complex samples. EV71 is the major causative agent of hand, foot and mouth disease (HFMD). Acute EV71 infection may cause severe neurological complications, leading to high mortality rate (82–94%) in severe cases.[13] Therefore, the rapid identification of EV71 infection is extremely important to enable timely treatment and predict the severity of the epidemics.
Herein, varying concentrations of EV71 ranging from 104 to 108 copies/mL were first spiked into phosphate buffered saline (PBS) and healthy human throat swab (HTS) solutions. PBS-only and HTS-only samples were set as the blanks. HTS was used to spike EV71 in that HTS is the most common clinical sample used for EV71 detection. In both cases of EV71 spiked samples, the color of AuNP solutions changed from red to purple, which can be easily differentiated by the naked eye (Figure 2a). In terms of the blank sample, the solution remained red because neither Ab1 nor Ab2 can specifically recognize the unknown matrices in HTS solutions, demonstrating that the unknown components in clinical samples have negligible effects on the detection. Therefore, we can conclude that the color change of the solutions is based on the biospecific interactions between EV71 and its antibodies rather than the nonspecific interactions between Ab2-AChE-MB and the polystyrene (PS) surfaces. The lowest concentration of EV71 where the color change can be discriminated by the naked eye was 104 copies/mL. Moreover, the color change of solutions was highly associated with the change of UV-vis absorbance (Figure 2b). By measuring the A700/A520 value for each sample, we observed that the A700/A520 values for both EV71-spiked PBS and HTS samples had the similar trend, i.e., increasing gradually from around 0.5 to 1.0 along with the increase of the spiked EV71.
Figure 2.

Detection of EV71 in spiked samples by different methods. a) The naked-eye detection of EV71 with various concentrations from 104 to 108 copies/mL in phosphate buffered saline (PBS) and human throat swab (HTS) by AuNP-based sandwich ELISA assay. The absence of EV71 in PBS and HTS was set as the blank. b) A700/A520 values versus different concentrations of EV71 in PBS and. c) Real-time polymerase chain reaction (RT-PCR) detection of EV71 in HTS and (d) Horseradish peroxidase (HRP)-based ELISA detection of EV71. Error bars show the standard deviations of three independent measurements.
It is worth noting that, when we applied Ab2-coated MB instead of Ab2-AChE-MB to perform the EV71 detection, no color change was observed (Figure S8 in Supporting Information). The results indicated that the color change of AuNP slutions was attributed to the presence of AChE on MB, and the MB itself has negligible interference on the colorimetric assay.
Presently, real-time PCR (RT-PCR) is the gold standard for diagnosing HFMD as well as many other infectious diseases in the clinic. As shown in Figure 2c, the lowest detectable concentration of the spiked EV71 using RT-PCR was 103 copies/mL, about one order of magnitude lower than that of the AuNP-based colorimetric assay. Although RT-PCR is an outstanding amplification platform for the detection of RNA residing in the EV71 particles, it requires expensive equipment and reagents and complex analysis techniques, which may not be available in resource-poor settings. Horseradish peroxidase (HRP)-based ELISA, the most commonly used approach for clinical biomarker detection, was applied to compare with our colorimetric assay. The lowest detectable concentration of the spiked EV71 using HRP-based ELISA was found to be 108 copies/mL (Figure 2d), which was four orders of magnitude higher than that of the AuNP-based colorimetric assay.
Encouraged by the outstanding sensitivity of this AuNP-based colorimetric assay that is comparable to RT-PCR, we tested the capability of this assay in the clinical diagnosis of HFMD patients (see Table S1 in Supporting Information) that suffered from EV71 infection. These cases had been positively diagnosed by using RT-PCR. Five unrelated HTS samples collected from patients who suffered from influenza A and another 5 healthy HTS samples were used as controls. HRP-based ELISA was used to screen the same clinical samples to compare with our assay. We differentiated positive and negative samples on the basis of the clinical threshold which was indicated by the horizontal dotted line. As shown in Figure 3a, 28 out of 34 EV71 cases were positively detected by the AuNP-based colorimetric assay; that is, the A700/A520 values are above the clinical threshold (where the A700/A520 value was 0.53). Meanwhile, the A700/A520 values for both influenza A and healthy HTS samples were below the clinical threshold, indicating that our assay offers excellent clinical specificity (100%) and sensitivity (82.3%). In comparison, the HRP-based ELISA format failed to give positive absorbance signals for any of the clinical samples (Figure 3b). The ELISA results are not surprising because of its moderate detection sensitivity, which cannot reach the clinical threshold concentrations of EV71 in clinical samples.
Figure 3.

Clinical detection of EV71 by the AuNP-based assay. HTS clinical samples collected from 34 EV71-infectious HFMD patients, 5 influenza A patients (control), and 5 healthy individuals (control) were used to evaluate the detection performance of the AuNP-based colorimetric assay (a) and the conventional HRP-based ELISA (b). Error bars show the standard deviations of three independent measurements.
Coxsackievirus A16 (CA16) is another etiological agent of HFMD that is closely related to EV71 but causes much less infection outcomes than EV71.[14] The accurate differentiation of these two types of virus is extremely meaningful for making the clinical decision. We developed two parallel sets of assays based on the AuNP-based colorimetric strategy for CA16 (17 HTS samples) and EV71 (18 HTS samples), respectively, and evaluated their detection sensitivity and specificity. As to the assay specifically designed for EV71, the sensitivity was found to be 83.3%, along with specificity of 94.1% (with 95% confidence interval of 81.9–100.0%) (Figure S9a,c in Supporting Information). Meanwhile, the sensitivity and specificity for CA16, where the Ab1 and Ab2 were specifically designed for CA16, were 76.5% and 83.3% (with 95% confidence interval of 69.8–97.6%) respectively (Figure S9b,d in Supporting Information). More details were shown in Table S2 and S3 in Supporting Information. These results revealed that our colorimetric assay has the ability to specifically diagnose HFMD infected by EV71 or CA16. Given the distinct advantages of high sensitivity and specificity, convenient readout (with the naked-eye and/or UV-vis absorption), rapidness, and economy, this AuNP-based colorimetric assay holds great promise as an alternative to RT-PCR for clinical diagnosis of HFMD and other infectious diseases.
In conclusion, we developed an ultrasensitive colorimetric assay for pathogen detection based on AChE-catalyzed hydrolysis reaction. The detection sensitivity of this assay is comparable to that of RT-PCR. Moreover, this assay offers at least two advantages over RT-PCR: (1) this assay does not require the handling of RNA and accurate control of temperature, thus cross-contamination can be avoided; (2) RT-PCR not only requires expensive instruments and reagents to acquire the results, but also needs an in-depth understanding of normalization techniques for analyzing the obtained results, while the colorimetric assay is based on the naked-eye alone, without resorting to advanced instruments or complex analysis techniques. Considering the high detection sensitivity and convenient readout, our assay has great potential to replace RT-PCR in many cases. In addition, this assay is conducted in the 96-well plate, the most popular detection format in clinical laboratories, making this assay easily adaptable into the currently available ELISA platforms that are popularly used in resource-poor settings.
Supplementary Material
Figure S1. Color and corresponding UV-vis spectra of citrate-capped AuNP solutions (15 nm, 2.3 nM) (a) and those incubated with thiol ligands (1 μM) terminated in different chemical groups: (b) 2-mercapto-N,N,N-trimethylethanaminium (2-MTA); (c) 3-mercaptopropanoic acid (3-MPA); (d) 2-mercaptoethanol (2-ME).
Figure S2. AChE assay kit was used to measure the amount of AChE before and after anchoring onto surfaces of magnetic bead (MB). Red circle: the added AChE before incubation with NHS-activated MB; Green circle: the excess AChE after incubation with NHS-activated MB; blue circle: the AChE-coated MB; purple: the uncoated NHS-activated MB. The OD values at 412 nm were recorded every 1 min by a Synergy 2 Multi-Mode Microplate Reader.
Figure S3. Sensitivity evaluation of the AuNP-based colorimetric assay for Ab2-AChE-MB. a) Color change of the AuNP solutions (15 nm, 2.3 nM) when added ATC (20 μM) and an increase of concentrations of Ab2-AChE-MB (1.0–20 ×103 particles/mL) from left to right. b) The corresponding UV-vis absorption of (a). c) A700/A520 values versus different concentrations of Ab2-AChE-MB, where A700 and A520 represent the absorbances at 700 and 520 nm respectively. Error bars show the standard deviations of three independent measurements.
Figure S4. Plots of A700/A520 values of citrate-AuNP solutions incubated with ATC (20 μM) and different concentrations (1.0–20 × 103 particles/mL) of Ab2-AChE-MB versus incubation time (0–10 min). The absorbance at 520 and 700 nm was collected simultaneously every 1 min by a Synergy 2 Multi-Mode Microplate Reader. The citrate-AuNP solution incubated with ATC (20 μM) alone was set as the blank.
Figure S5. Transmission electron microscopy (TEM) images of (a) dispersed AuNPs and (b) aggregated AuNPs in the presence of Ab2-AChE-MB (1.0 ×10⁴ particles/mL) and ATC (20 μM).
Figure S6. a) Dynamic light scattering and (b) zeta potential measurements of AuNPs before (red bars) and after (purple bars) adding Ab2-AChE-MB (1.0 ×10⁴ particles/mL) and ATC (20 μM). Error bars show the standard deviations of three independent measurements.
Figure S7. AChE assay kit was used to detect various concentrations (2.5– 40×105 particles/mL) of Ab2-AChE-MB by recording the OD values at 412 nm in a Synergy 2 Multi-Mode Microplate Reader. Error bars show the standard deviations of three independent measurements.
Figure S8. a) Color of the AuNP solutions (15 nm, 2.3 nM) when using Ab2-decorated MB (0.1 mg/mL) instead of AB2-AChE-MB to perform the ELISA detection of EV71. The color of the solutions remained red due to the lack of AChE. b) The corresponding A700/A520 values versus different concentrations of EV71. Error bars show the standard deviations of three independent measurements.
Figure S9. Field results of the AuNP-based assay. Vertical scatter plots of A700/A520 values for positive (filled circles) and negative (filled squares) HTS samples, where EV71 (a) and CA16 (b) were collected from HFMD patients who had been diagnosed to be EV71-positive and CA16-positive respectively by RT-PCR. The positive signals were set to be or above the clinical threshold, where the A700/A520 value is 0.53. Received-operating characteristic (ROC) curves were employed to test the sensitivity and specificity of the colorimetric assay for EV71 (c) and CA16 (d) in clinical samples.
Figure S10. UV-vis absorption spectra of purified EV71 detection antibody (Ab2, blue line) and that labeled with DBCO moieties (DBCO-Ab2, green line). The absorption band at 309 nm indicates the DBCO moieties on Ab2.
Figure S11. Fluorescent images of azide-AChE-modified magnetic beads after incubation with DBCO-activated fluorescent dyes (a) and azide-activated fluorescent dyes (b) respectively. DBCO-activated fluorescent dyes were conjugated with azide-AChE-modified magnetic beads by means of copper-free click chemistry, demonstrated by the very strong fluorescence.
Figure S12. Representative AFM images of NHS-MB, AChE-MB, and Ab2-AChE-MB were shown in (a), (b), and (c) respectively. Particle size histograms for NHS-MB, AChE-MB, and Ab2-AChE-MB were obtained from the height of the beads (d, e, and f).
Table S1 Information of HTS samples collected from 34 EV71-infectious HFMD patients, 5 influenza A patients, and 5 healthy individuals and their detection results by conventional ELISA, the AuNP-based colorimetric assay, and RT-PCR.
Table S2 Information of HTS samples collected from 18 EV71-infectious HFMD patients and their detection results by conventional ELISA, the AuNP-based colorimetric assay, and RT-PCR.
Table S3 Information of HTS samples collected from 17 CA16-infectious HFMD patients and their detection results by conventional ELISA, the AuNP-based colorimetric assay, and RT-PCR.
Table S4. EV71-specific primers used for RT-PCR in this study
Footnotes
This work was supported in part, by the Intramural Research Program (IRP) of the National Institute of Biomedical Imaging and Bioengineering (NIBIB), National Institutes of Health (NIH). D. Liu was supported by a postdoctoral fellowship from NIH-NIBIB/NIST NRC.
Supporting information for this article is available on the WWW under http://www.angewandte.org or from the author.
Contributor Information
Dingbin Liu, Laboratory of Molecular Imaging and Nanomedicine (LOMIN), National Institute of Biomedical Imaging and Bioengineering (NIBIB), National Institutes of Health (NIH), Bethesda, Maryland 20892 (USA).
Zhantong Wang, National Institute of Diagnostics and Vaccine Development in Infectious Disease, School of Public Health, Xiamen University, Xiamen 361005 (China). Center for Molecular Imaging and Translational Medicine, School of Public Health, Xiamen University, Xiamen 361005 (China).
Dr. Albert Jin, Laboratory of Cellular Imaging and Macromolecular Biophysics, National Institute of Biomedical Imaging and Bioengineering, National Institutes of Health, Bethesda, Maryland 20982 (USA)
Xinglu Huang, Laboratory of Molecular Imaging and Nanomedicine (LOMIN), National Institute of Biomedical Imaging and Bioengineering (NIBIB), National Institutes of Health (NIH), Bethesda, Maryland 20892 (USA).
Xiaolian Sun, Laboratory of Molecular Imaging and Nanomedicine (LOMIN), National Institute of Biomedical Imaging and Bioengineering (NIBIB), National Institutes of Health (NIH), Bethesda, Maryland 20892 (USA).
Fu Wang, Laboratory of Molecular Imaging and Nanomedicine (LOMIN), National Institute of Biomedical Imaging and Bioengineering (NIBIB), National Institutes of Health (NIH), Bethesda, Maryland 20892 (USA).
Qiang Yan, National Institute of Diagnostics and Vaccine Development in Infectious Disease, School of Public Health, Xiamen University, Xiamen 361005 (China).
Shengxiang Ge, National Institute of Diagnostics and Vaccine Development in Infectious Disease, School of Public Health, Xiamen University, Xiamen 361005 (China).
Prof. Ningshao Xia, National Institute of Diagnostics and Vaccine Development in Infectious Disease, School of Public Health, Xiamen University, Xiamen 361005 (China)
Gang Niu, Laboratory of Molecular Imaging and Nanomedicine (LOMIN), National Institute of Biomedical Imaging and Bioengineering (NIBIB), National Institutes of Health (NIH), Bethesda, Maryland 20892 (USA).
Gang Liu, Center for Molecular Imaging and Translational Medicine, School of Public Health, Xiamen University, Xiamen 361005 (China).
Dr. A. R. HightWalker, Optical Technology Division, Physics Laboratory, National Institute of Standards and Technology, Gaithersburg, Maryland 20899 (USA)
Dr. Xiaoyuan Chen, Email: shawn.chen@nih.gov, Laboratory of Molecular Imaging and Nanomedicine (LOMIN), National Institute of Biomedical Imaging and Bioengineering (NIBIB), National Institutes of Health (NIH), Bethesda, Maryland 20892 (USA)
References
- 1.a) Rusling JF. Anal Chem. 2013;85:5304–5310. doi: 10.1021/ac401058v. [DOI] [PMC free article] [PubMed] [Google Scholar]; b) Rosi NL, Mirkin CA. Chem Rev. 2005;105:1547–1562. doi: 10.1021/cr030067f. [DOI] [PubMed] [Google Scholar]; c) Xiang Y, Lu Y. Nat Chem. 2011;3:697–703. doi: 10.1038/nchem.1092. [DOI] [PMC free article] [PubMed] [Google Scholar]; d) Song S, Liang Z, Zhang J, Wang L, Li G, Fan C. Angew Chem. 2009;121:8826–8830. doi: 10.1002/anie.200901887. [DOI] [PubMed] [Google Scholar]; Angew Chem, Int Ed. 2009;48:8670–8674. doi: 10.1002/anie.200901887. [DOI] [PubMed] [Google Scholar]
- 2.Hsieh K, Patterson AS, Ferguson BS, Plaxco KW, Soh HT. Angew Chem. 2012;124:4980–4984. doi: 10.1002/anie.201109115. [DOI] [PMC free article] [PubMed] [Google Scholar]; Angew Chem, Int Ed. 2012;51:4896–4900. doi: 10.1002/anie.201109115. [DOI] [PMC free article] [PubMed] [Google Scholar]
- 3.a) Lam B, Das J, Holmes RD, Live L, Sage A, Sargent EH, Kelley SO. Nat Commun. 2013;4:2001. doi: 10.1038/ncomms3001. [DOI] [PubMed] [Google Scholar]; b) Guo X, Kulkarni A, Doepke A, Halsall HB, Iyer S, Heineman WR. Anal Chem. 2012;84:241–246. doi: 10.1021/ac202419u. [DOI] [PubMed] [Google Scholar]
- 4.a) Chen L, Zhang X, Zhou G, Xiang X, Ji X, Zheng Z, He Z, Wang H. Anal Chem. 2012;84:3200–3207. doi: 10.1021/ac203172x. [DOI] [PubMed] [Google Scholar]; b) Zagorovsky K, Chan WCW. Angew Chem. 2013;125:3250–3253. [Google Scholar]; Angew Chem, Int Ed. 2013;52:3168–3171. doi: 10.1002/anie.201208715. [DOI] [PubMed] [Google Scholar]; c) Jung JH, Cheon DS, Liu F, Lee KB, Seo TS. Angew Chem. 2010;122:5844–5847. doi: 10.1002/anie.201001428. [DOI] [PubMed] [Google Scholar]; Angew Chem, Int Ed. 2010;49:5708–5711. doi: 10.1002/anie.201001428. [DOI] [PubMed] [Google Scholar]; d) Chung HJ, Castro CM, Im H, Lee H, Weissleder R. Nat Nanotechnol. 2013;8:369–375. doi: 10.1038/nnano.2013.70. [DOI] [PMC free article] [PubMed] [Google Scholar]
- 5.Tan EL, Yong LL, Quak SH, Yeo WC, Chow VT, Poh CL. J Clin Virol. 2008;42:203–206. doi: 10.1016/j.jcv.2008.01.001. [DOI] [PubMed] [Google Scholar]
- 6.a) Elghanian R, Storhoff JJ, Mucic RC, Letsinger RL, Mirkin CA. Science. 1997;277:1078–1081. doi: 10.1126/science.277.5329.1078. [DOI] [PubMed] [Google Scholar]; b) de la Rica R, Stevens MM. Nat Nanotechnol. 2012;7:821–824. doi: 10.1038/nnano.2012.186. [DOI] [PubMed] [Google Scholar]; c) Laromaine A, Koh LL, Murugesan M, Ulijn RV, Stevens MM. J Am Chem Soc. 2007;129:4156–4157. doi: 10.1021/ja0706504. [DOI] [PubMed] [Google Scholar]; d) Liu JW, Lu Y. Angew Chem. 2006;118:96–100. [Google Scholar]; Angew Chem, Int Ed. 2006;45:90–94. [Google Scholar]; e) Li D, Wieckowska A, Willner I. Angew Chem. 2008;120:3991–3995. [Google Scholar]; Angew Chem, Int Ed. 2008;47:3927–3931. doi: 10.1002/anie.200705991. [DOI] [PubMed] [Google Scholar]; f) Liu D, Chen W, Sun K, Deng K, Zhang W, Wang Z, Jiang X. Angew Chem. 2011;123:4189–4193. doi: 10.1002/anie.201008198. [DOI] [PubMed] [Google Scholar]; Angew Chem, Int Ed. 2011;50:4103–4107. doi: 10.1002/anie.201008198. [DOI] [PubMed] [Google Scholar]; g) Jiang Y, Zhao H, Lin Y, Zhu N, Ma Y, Mao L. Angew Chem. 2010;122:4910–4914. [Google Scholar]; Angew Chem, Int Ed. 2010;49:4800–4804. doi: 10.1002/anie.201001057. [DOI] [PubMed] [Google Scholar]
- 7.Liu D, Qu W, Chen W, Zhang W, Wang Z, Jiang X. Anal Chem. 2010;82:9606–9610. doi: 10.1021/ac1021503. [DOI] [PubMed] [Google Scholar]
- 8.a) Krishnan S, Mani V, Wasalathanthri DP, Kumar CV, Rusling JF. Angew Chem. 2011;123:1207–1210. doi: 10.1002/anie.201005607. [DOI] [PMC free article] [PubMed] [Google Scholar]; Angew Chem, Int Ed. 2011;50:1175–1178. doi: 10.1002/anie.201005607. [DOI] [PMC free article] [PubMed] [Google Scholar]; b) Mani V, Wasalathanthri DP, Joshi AA, Kumar CV, Rusling JF. Anal Chem. 2012;84:10485–10491. doi: 10.1021/ac3028257. [DOI] [PMC free article] [PubMed] [Google Scholar]
- 9.Baskin JM, Prescher JA, Laughlin ST, Agard NJ, Chang PV, Miller IA, Lo A, Codelli JA, Bertozzi CR. Proc Natl Acad Sci USA. 2007;104:16793–16797. doi: 10.1073/pnas.0707090104. [DOI] [PMC free article] [PubMed] [Google Scholar]
- 10.Wang M, Gu X, Zhang G, Zhang D, Zhu D. Langmuir. 2009;25:2504–2507. doi: 10.1021/la803870v. [DOI] [PubMed] [Google Scholar]
- 11.Ellman GL, Courtney KD, Andres V, Featherstone RM. Biochem Pharmacol. 1961;7:88–95. doi: 10.1016/0006-2952(61)90145-9. [DOI] [PubMed] [Google Scholar]
- 12.Liu X, Atwater M, Wang J, Huo Q. Colloids Surf B. 2007;58:3–7. doi: 10.1016/j.colsurfb.2006.08.005. [DOI] [PubMed] [Google Scholar]
- 13.Zhu FC, Liang ZL, Li XL, Ge HM, Meng FY, Mao QY, Zhang YT, Hu YM, Zhang ZY, Li JX, Gao F, Chen QH, Zhu QY, Chu K, Wu X, Yao X, Guo HJ, Chen XQ, Liu P, Dong YY, Li FX, Shen XL, Wang JZ. Lancet. 2013;381:1037–1045. doi: 10.1016/S0140-6736(12)61764-4. [DOI] [PubMed] [Google Scholar]
- 14.Wu S, Duan N, Ma X, Xia Y, Yu Y, Wang Z, Wang H. Chem Commun. 2012;48:4866–4868. doi: 10.1039/c2cc00092j. [DOI] [PubMed] [Google Scholar]
Associated Data
This section collects any data citations, data availability statements, or supplementary materials included in this article.
Supplementary Materials
Figure S1. Color and corresponding UV-vis spectra of citrate-capped AuNP solutions (15 nm, 2.3 nM) (a) and those incubated with thiol ligands (1 μM) terminated in different chemical groups: (b) 2-mercapto-N,N,N-trimethylethanaminium (2-MTA); (c) 3-mercaptopropanoic acid (3-MPA); (d) 2-mercaptoethanol (2-ME).
Figure S2. AChE assay kit was used to measure the amount of AChE before and after anchoring onto surfaces of magnetic bead (MB). Red circle: the added AChE before incubation with NHS-activated MB; Green circle: the excess AChE after incubation with NHS-activated MB; blue circle: the AChE-coated MB; purple: the uncoated NHS-activated MB. The OD values at 412 nm were recorded every 1 min by a Synergy 2 Multi-Mode Microplate Reader.
Figure S3. Sensitivity evaluation of the AuNP-based colorimetric assay for Ab2-AChE-MB. a) Color change of the AuNP solutions (15 nm, 2.3 nM) when added ATC (20 μM) and an increase of concentrations of Ab2-AChE-MB (1.0–20 ×103 particles/mL) from left to right. b) The corresponding UV-vis absorption of (a). c) A700/A520 values versus different concentrations of Ab2-AChE-MB, where A700 and A520 represent the absorbances at 700 and 520 nm respectively. Error bars show the standard deviations of three independent measurements.
Figure S4. Plots of A700/A520 values of citrate-AuNP solutions incubated with ATC (20 μM) and different concentrations (1.0–20 × 103 particles/mL) of Ab2-AChE-MB versus incubation time (0–10 min). The absorbance at 520 and 700 nm was collected simultaneously every 1 min by a Synergy 2 Multi-Mode Microplate Reader. The citrate-AuNP solution incubated with ATC (20 μM) alone was set as the blank.
Figure S5. Transmission electron microscopy (TEM) images of (a) dispersed AuNPs and (b) aggregated AuNPs in the presence of Ab2-AChE-MB (1.0 ×10⁴ particles/mL) and ATC (20 μM).
Figure S6. a) Dynamic light scattering and (b) zeta potential measurements of AuNPs before (red bars) and after (purple bars) adding Ab2-AChE-MB (1.0 ×10⁴ particles/mL) and ATC (20 μM). Error bars show the standard deviations of three independent measurements.
Figure S7. AChE assay kit was used to detect various concentrations (2.5– 40×105 particles/mL) of Ab2-AChE-MB by recording the OD values at 412 nm in a Synergy 2 Multi-Mode Microplate Reader. Error bars show the standard deviations of three independent measurements.
Figure S8. a) Color of the AuNP solutions (15 nm, 2.3 nM) when using Ab2-decorated MB (0.1 mg/mL) instead of AB2-AChE-MB to perform the ELISA detection of EV71. The color of the solutions remained red due to the lack of AChE. b) The corresponding A700/A520 values versus different concentrations of EV71. Error bars show the standard deviations of three independent measurements.
Figure S9. Field results of the AuNP-based assay. Vertical scatter plots of A700/A520 values for positive (filled circles) and negative (filled squares) HTS samples, where EV71 (a) and CA16 (b) were collected from HFMD patients who had been diagnosed to be EV71-positive and CA16-positive respectively by RT-PCR. The positive signals were set to be or above the clinical threshold, where the A700/A520 value is 0.53. Received-operating characteristic (ROC) curves were employed to test the sensitivity and specificity of the colorimetric assay for EV71 (c) and CA16 (d) in clinical samples.
Figure S10. UV-vis absorption spectra of purified EV71 detection antibody (Ab2, blue line) and that labeled with DBCO moieties (DBCO-Ab2, green line). The absorption band at 309 nm indicates the DBCO moieties on Ab2.
Figure S11. Fluorescent images of azide-AChE-modified magnetic beads after incubation with DBCO-activated fluorescent dyes (a) and azide-activated fluorescent dyes (b) respectively. DBCO-activated fluorescent dyes were conjugated with azide-AChE-modified magnetic beads by means of copper-free click chemistry, demonstrated by the very strong fluorescence.
Figure S12. Representative AFM images of NHS-MB, AChE-MB, and Ab2-AChE-MB were shown in (a), (b), and (c) respectively. Particle size histograms for NHS-MB, AChE-MB, and Ab2-AChE-MB were obtained from the height of the beads (d, e, and f).
Table S1 Information of HTS samples collected from 34 EV71-infectious HFMD patients, 5 influenza A patients, and 5 healthy individuals and their detection results by conventional ELISA, the AuNP-based colorimetric assay, and RT-PCR.
Table S2 Information of HTS samples collected from 18 EV71-infectious HFMD patients and their detection results by conventional ELISA, the AuNP-based colorimetric assay, and RT-PCR.
Table S3 Information of HTS samples collected from 17 CA16-infectious HFMD patients and their detection results by conventional ELISA, the AuNP-based colorimetric assay, and RT-PCR.
Table S4. EV71-specific primers used for RT-PCR in this study