

Abstract
Problem addressed
Chronic neural recording in behaving animals is an essential method for studies of neural circuit function. However, stable recordings from small, densely packed neurons remains challenging, particularly over time-scales relevant for learning.
Methodology
We describe an assembly method for a 16 channel electrode array consisting of carbon fibers (<5 μm diameter) individually insulated with Parylene-C and fire-sharpened. The diameter of the array is approximately 26 microns, along the full extent of the implant.
Results
Carbon fiber arrays were tested in HVC (used as a proper name), a song motor nucleus, of singing zebra finches where individual neurons discharge with temporally precise patterns. Previous reports of activity in this population of neurons has required the use of high impedance electrodes on movable microdrives. Here, the carbon fiber electrodes provided stable multi-unit recordings over time-scales of months. Spike-sorting indicated that the multi-unit signals were dominated by one, or a small number of cells. Stable firing patterns during singing confirmed the stability of these clusters over time-scales of months. In addition, from a total of 10 surgeries, 16 projection neurons were found. This cell type is characterized by sparse - stereotyped firing firing patterns, providing unambiguous confirmation of single cell recordings.
Significance
Carbon fiber electrode bundles may provide a scalable solution for long-term neural recordings of densely packed neurons.
Keywords: carbon fiber, microthread, ultramicroelectrode, single-unit recording, electrode technology
Introduction
A powerful approach to the study of learning involves tracking neural firing patterns across time. Optical methods for stable recording are developing rapidly (Harvey, Coen, & Tank, 2012) but the temporal resolution of electrical recordings remains unsurpassed, and chronically implanted microelectrodes are central to scientific studies of neural circuit function in behaving animals, and central to the development of intracranial brain-machine interfaces in humans (Donoghue, 2008). In primate motor cortex, relatively large neurons can be tracked for weeks (Dickey, Suminski, Amit, & Hatsopoulos, 2009; Fraser & Schwartz, 2012; Tolias et al., 2007) using commercially available electrode arrays. This has enabled researchers to study the stability of motor tuning (Chestek et al., 2007; Rokni, Richardson, Bizzi, & Seung, 2007) and the process of memory formation (Kentros, Agnihotri, Streater, Hawkins, & Kandel, 2004; Thompson & Best, 1990); and it has provided the basis for brain machine interface technologies (Koralek, Jin, Long, Costa, & Carmena, 2012).
Over time, chronically implanted electrodes are severely limited by a tissue reaction that eventually encapsulates the electrode, killing neurons in the vicinity of the electrode. The limitations of this tissue response are particularly acute if the goal is recording from densely packed neurons in small brains. For a silicone array whose cross-section is 15×200 microns, histological markers of gliosis and neuron death reveal tissue damage extending up to 300 microns or more from the implant (Biran, Martin, & Tresco, 2005).
This length-scale of tissue damage does not prohibit long term recording from pyramidal neurons in primate cortex whose large polarized dendrites and large somas (up to 100 microns) produce a strong signal for extracellular recording. However, the length scale of tissue damage becomes prohibitive when recording from many cell types in smaller organisms. For example, in the songbird nucleus HVC (used here as a proper name), somas are only 8-15 microns in diameter (Mooney, 2005) and closely-packed in clusters making soma-soma contact (Scott, Gardner, Ji, Fee, & Lois, 2012). Dendrites in HVC are also compact (40-100 micron radius), and spherical in shape rather than polarized (Katz & Gurney, 1981; Lewicki, 1996; Mooney, 2005). To isolate the weak signal generated from these cells, electrodes with small recording surfaces are advanced with motorized microdrives, allowing micron-scale control over electrode positioning. The absence of any report of single neuron isolation in HVC with a fixed chronic electrode implant underscores the difficulty of recording small cells with an implant whose damage length scale is large relative to the target neurons. Examples of multi-day recordings in mouse hippocampus can be found (Kentros et al., 2004; Koralek et al., 2012) that employ movable tetrode microwires, but recording methods that make this process more efficient are needed. Ultimately, to facilitate long term recordings from densely packed neurons in small animals, and to improve the longevity of human and primate neural interfaces, electrode designs are needed that reduce chronic tissue damage. Increasing attention to the limitations of current microelectrode technologies have led to a strong conclusion that the cross-section of implanted electrodes must be minimized to reduce chronic disruption of the blood brain barrier (Biran et al., 2005; Polikov, Tresco, & Reichert, 2005). Orthogonal pressures are driving an increase in the number of recording sites per implant, but increasing the density of recording sites may be counter-productive if the implant size also increases.
Recently proposed carbon fiber “ultramicroelectrodes” promise to reduce damage upon implantation, and may partially evade immune rejection (T. D. T. Y. Kozai et al., 2012; T. K. Kozai et al., 2010). Glass insulated carbon fibers have been used for cyclic voltammetry and extracellular recording for some time (Armstrong-James & Millar, 1979; Garris, Ciolkowski, Pastore, & Wightman, 1994), but the essential advance of the proposed “microthread” electrode involves doing away with the large-diameter glass insulation in favor of a thin (1 micron) layer of parylene deposited over a small (3-7) micron diameter carbon fiber. This also serves to dramatically reduce the stiffness of the implant, another factor hypothesized to contribute to tissue damage (Subbaroyan, Martin, & Kipke, 2005). The small profile over the full length of the electrode, in principle, could provide for minimal chronic tissue damage and neuron death. The small scale of the proposed carbon “microthread” electrode makes implantation challenging. Practical methods for building and implanting high channel-count carbon fiber electrodes remain undefined. The present study describes one such design.
The 16 channel carbon fiber array described here has a final cross-section of approximately 26 microns, on par with single micro-wires in commercial microwire arrays (30-50 micron wires in all Tucker-Davis microwire arrays, for example.) The principle innovations of this work arise from carbon fiber manipulations using the elements of fire, air and water: burning partially submerged carbon fibers leads to a consistent electrode tip preparation. Drawing carbon fibers through an air-water interface leads to surface-tension driven bundling of the fibers, resulting in an implantable array.
To test the design, we examined song coding in zebra finches–a uniquely tractable test-bed for assessing chronic electrode stability. Zebra finch song is a stereotyped natural behavior produced by a distinctive learned pattern of neural activity. As the bird sings, each of three cell types in pre-motor nucleus HVC—interneurons, basal ganglia-projecting neurons, and motor output neurons—discharge in a stereotyped, characteristic pattern with minimal spike-time jitter (< 1ms for motor output neurons) between renditions of the same song (Hahnloser, Kozhevnikov, & Fee, 2002a; Kozhevnikov & Fee, 2007).
The various cell types in HVC are small (8-15 microns), and synchronous elevated firing rates of interneurons during song make isolation of single units challenging. Current approaches to recording the three cell types in HVC require the use of high impedance electrodes positioned close to individual cells using a motorized microdrive (Fee & Leonardo, 2001). Neurons isolated in this manner in HVC are typically not recorded for a time-scale longer than tens of minutes. Using fixed implants of the carbon fiber arrays described here, we recorded unambiguous single units in HVC over timescales of 4-12 hours, and “sorted” multi-unit clusters over time-scales of months. We find that the precise temporal patterns recorded in HVC are stable over the time-scales of our recordings. This feature provides a means of validating signal stability independently of spike waveforms, providing a useful test-bed to assess chronic recording methods.
Methods
Carbon microthread arrays
4.5-micron diameter carbon fiber threads (Goodfellow USA, http://www.goodfellowusa.com/ Grade UMS2526) form the basis of the array. (Young's modulus of 380 GPa compared to tungsten's 400 GPa: volume resistivity 1000 μΩcm compared with 5.4 μΩcm for tungsten.). Epoxy sizing was removed by heating fibers at 400° C for 6 hours (Schulte & Chow, 1998) using a Paragon SC2 kiln (Paragon http://www.paragonweb.com/SC2.cfm). A 1 μm layer of Parylene-C (di-chloro-di-p-xylylene) (Kisco, http://www.kisco-net.com/english/kasei.htm) was then deposited using an SCS Labcoter 2 (PDS-2010, Specialty Coating Systems, http://scscoatings.com/) using 2.3g of parylene and factory settings as follows: Furnace, 690° C; Chamber Gauge, 135° C; Vaporizer, 175° C; and Vacuum at 15 vacuum units above base pressure. The integrity of the coating was verified through bubble testing initially, and defects were never found. Fourteen coated fibers and 1 coated or uncoated fiber (for the reference) were threaded through a custom plastic block designed in SolidWorks (Dassault Systems, http://www.solidworks.com/) and 3-D printed using stereolithography (Realize Inc, http://www.realizeinc.com/) (one channel out of the possible 16 was used for the microphone trace and one was shorted with the reference, making a total of 14 electrophysiology channels) (Figure 1a, left). The block contains 16 wells (18×27 mils) that funnel the carbon fibers through a small aperture (12 mils in diameter) (block design files are available upon request). At this stage the carbon fibers exiting the aperture are splayed. On the top side, the block was cut to fit the straight tails of an Omnetics connector (A79038-001, Omnetics, http://www.omnetics.com/). Fibers at the mating end of the carbon were briefly passed through a gas/oxygen torch to remove insulation for making electrical contact (Smith Equipment, http://www.littletorch.com/) (Figure 1a, middle). The fibers were then connected to an Omnetics connector using conductive silver paint (Silver Print part no. 842-20G, MG Chemicals, http://www.mgchemicals.com/), which was spread into the wells housing the carbon fibers. The connector was pressed into the silver-filled wells and glued to the plastic block using light bonded dental acrylic (Flow-It ALC, Pentron Clinical, http://www.pentron.com/) (Figure 1a, right).
Figure 1. Array assembly.
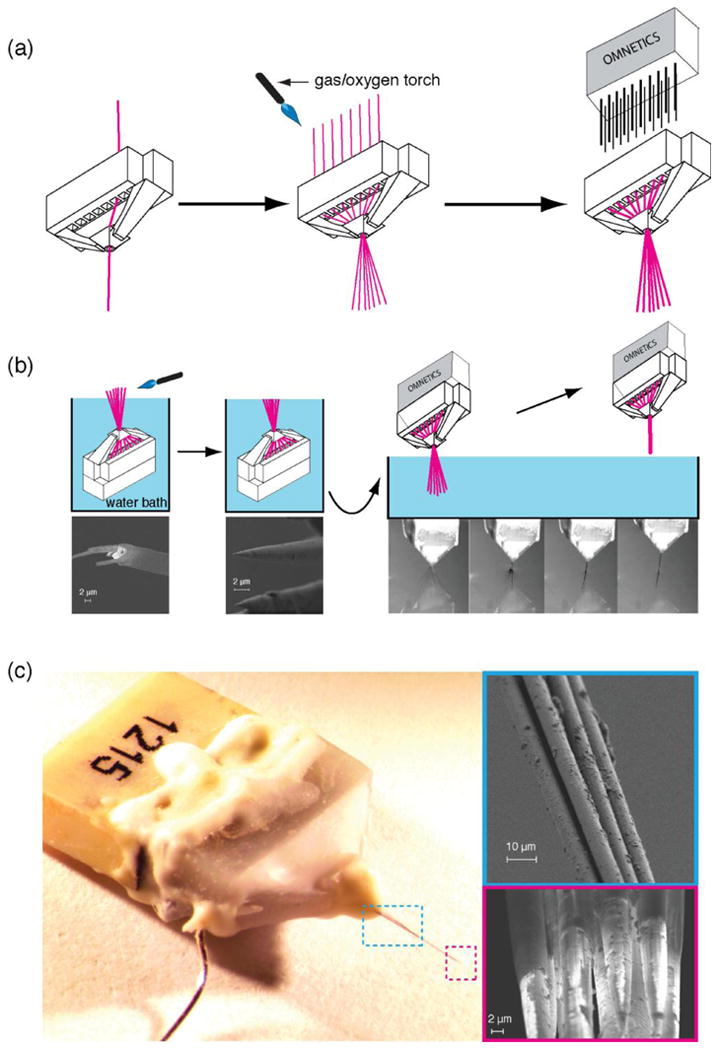
A, Left, Diagram of the 3D-printed plastic block with wells for 16 carbon fibers. Fibers are threaded through the wells on the top of the block and exit through the hole on the bottom. Middle, To expose the connector-side ends of the fibers from parylene, the fibers are heated by passing them through a gas/oxygen torch. Right, The wells are then filled with conductive silver paint to make electric contact with an Omnetics connector, which slides into the plastic block wells. B, Fire-sharpening of electrode tips. Left, the assembled array is lowered into a water bath with the tips of the carbon fibers protruding above the surface of the water. Bottom, SEM image of a a blunt cut carbon fiber electrode, with insulation frayed near the tip. Middle, A gas/oxygen torch is passed over the surface of the water, burning the carbon and the insulating parylene down to the water surface. Bottom, After passing the torch over the exposed tips, the carbon fiber tapers to a sharp point. Right, The array is then taken out of the water, with the tips pointing down; surface tension acts to bring the carbon fibers into a single tight bundle. C, The assembled array. The 16-electrode bundle is approximately 26 μm in diameter (upper right). The immersion tip burning process exposes approximately 89 μm of carbon (lower right).
Initially, the carbon fiber bundle was blunt cut with surgical scissors (Fine Science Tools, http://www.finescience.com/) or a razor blade to expose the insulation. This resulted in widely varying impedances, often as high as 4 MΩ (measured at 1kHz with a Bak Electronics IMP-2 impedance tester (http://www.bakelectronicsinc.com/). All impedance measures reported here are in phosphate buffered saline solution (Sigma Aldrich D5773 SIGMA, http://www.sigmaaldrich.com/catalog/product/sigma/d5773?lang=en®ion=US). We next tried embedding the wires in carbowax (polyethylene glycol) and cutting using a vibratome, but this also did not reduce impedance. We then tried grinding the tips of the fibers on a spinning plate (a modified hard drive) for up to 30 minutes, but this did not produce desirable impedance either. To produce a consistent low-impedance tip, we developed a process of fire-sharpening with a gas/oxygen torch (flame ∼4.5 mm across, 7.5 mm in length). The key innovation involves holding the array underwater while burning exposed tips (Figure 1b). With the array secured in a water bath with carbon fiber tips protruding above the surface of the water (Figure 1b, left), the carbon was burned down to the surface of the water with the torch (Figure 1b, middle). The water acted as a flame retardant/insulator, providing control over the amount of Parylene-C taken off of the tip of the carbon. This had two desirable effects: (1) sharpening the tip of the bundle, and (2) lowering the tip-impedance to an acceptable range for extracellular recording (Figure 2). By comparison, we found blunt-cutting of the Parylene insulated electrodes to produce widely varying impedance values and unreliable signals. Figure 1b, left panel, shows one blunt-cut electrode, revealing a carbon recording surface recessed from the cut Parylene surface. A recent study found it necessary to surface treat parylene-insulated carbon fibers with PEDOT for recording chronic extracellular signals (T. D. T. Y. Kozai et al., 2012). The large surface area of the exposed carbon in the fire sharpened electrode may explain why chronic signals were found in the present study without additional surface modifications required in the previous study.
Figure 2. Electrode impedances.
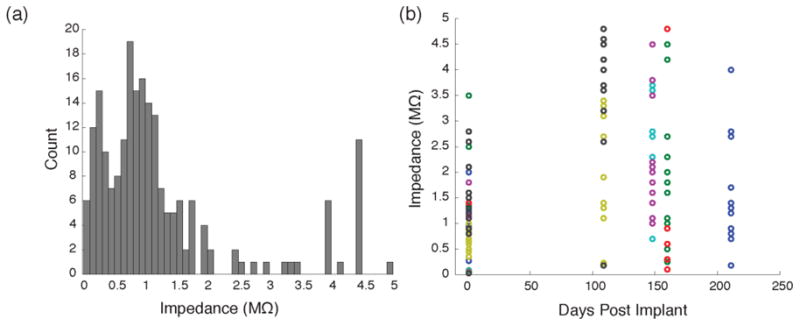
A, Histogram of the fire-sharpened pre-implant electrode impedance (n = 210 fibers; median = 1.0MΩ). B, Impedance of fibers in 7 implanted arrays measured at various time points after implanting. Colors indicate fibers' grouping into arrays. The pre-implant impedances (in saline) in corresponding colors are shown at Day 0.
In a final step, the array was slowly drawn out of the bath with the wires facing down. In this step, surface tension pulls together the splayed fibers into a single bundle, and this bundle remains together after the fibers dry (Fig 1b, right), allowing the entire bundle to be implanted. Figure 1c shows the (∼250mg) assembled 16-channel array. This final weight is comparable to commercially available electrode arrays with a similar number of contacts (300 mg for a 16 channel Omnetics TDT array, 140 mg for a 16 channel H-style probe from Neuronexus, and 130 mg for a 16 channel microwire array from Microprobes). In the final construction, the wires converged in one bundle with a bundle diameter of ∼26 μm (Figure 1c). Each fiber terminated in uninsulated carbon, in a conical profile. The length of this cone was 89 ±17 (SD) μm. The diameter of the bundle, along the full length of the array, is smaller than single wires in most commercial arrays (33-50 microns for all Tucker Davis microwire arrays. http://www.tdt.com/products/MW16.htm, and 25-50 microns for all Microprobes microwire arrays http://www.microprobes.com/index.php/support-download/custom-design-forms/micro-wire-array-mwa).
Considering the time required to insulate the carbon, burn the fibers, and test impedance, array construction typically takes 3-4 hours for an experienced electrode builder. In a sample of 16 arrays constructed by an expert, an average of 92 ± 8% (± indicates SD) of the wires were functional (n = 210 fibers), where functional electrodes are defined as having an impedance lower than 4 M-Ohm. For an experienced electrode builder, the failure rate is low.
Surgical Procedure
All procedures were approved by the Institutional Animal Care and Use Committee of Boston University (protocol number 09-007). Zebra finches (n = 14; 4 for acute experiments, 10 for chronic HVC recordings and 2 for intracellular-like recordings) (>120 days post-hatch) were anesthetized with 4.0% isoflurane and maintained at 1-2% isoflurane during the aseptic surgical procedure. The analgesic Meloxicam (120 μL) was injected intramuscularly into the breast at the start of the procedure and the animal was placed into a stereotaxic instrument. Feathers were removed from the scalp and a Betadyne solution applied. Bupivicane (50μL) was then injected subcutaneously into the scalp before an incision was made along the AP axis.
The skull over HVC was localized using stereotactic coordinates (30° head angle; 0.7 mm AP, 2.3 mm ML, 0.4-0.7 mm DV), and the the outer bone leaflet removed at the location of HVC with a dental drill. The lower bone leaflet was carefully removed with an opthalamic scalpel, similar to implant procedures for recording with microdrives (M. A. Long, Jin, & Fee, 2010), exposing a hole of ∼100 μm diameter. A minimal durotomy was performed using an opthalamic scalpel (typical durotomy was less than 50 microns.). Electrodes were mounted on a digital manipulator attached to the stereotax and slowly lowered through the durotomy. During insertion into the brain, the carbon fibers would occasionally begin to visibly splay. After lowering the array to the appropriate depth, the position in the song nucleus HVC was verified using antidromic stimulation from a bipolar electrode implanted in downstream Area X (Hahnloser, Kozhevnikov, & Fee, 2002b). After verifying the position of the array, the craniotomy was covered with the silicone elastomer Kwik-Sil (World Precision Instruments, http://www.wpiinc.com/) and the array was glued into place using light-bonded acrylic (Flow-It ALC, Pentron) along the entire length of the electrode shank, such that no portion of the carbon fiber bundle was left exposed or loose.
The same surgical procedure was followed for the acute recordings in Area X and HVC. For acute recordings in auditory area Field L, adult (>120 DPH) female zebra finches were anesthetized with 4% isoflurane (maintained at 1-2%) and a custom-made stainless steel head-post was glued to the scalp over the left hemisphere. The birds were then given several hours to recover, after which they were head-fixed in a soundproof chamber. Recordings were made from spontaneously active cells in Field L. Following the acute recordings, birds were euthanized using 200 μL sodium pentobarbital (250mg/kg) injected into the breast muscle.
Electrophysiological Recording
Acute recordings were performed using an RZ-5 BioAmp Processor and Medusa PreAmplifier (Tucker-Davis Technologies, http://www.tdt.com). Data was sampled at 25 kHz with filter cutoffs set to 300 Hz and 20 kHz. (Data from the acute recordings were not impacted by any aliasing due to the proximity of the high frequency filter and the sampling rate. See Figure S1.) To record from behaving birds, we used the Intan Technologies 16-channel multiplexing headstage (RHA2116 with unipolar inputs) paired with the RHA2000-EVAL board (http://www.intantech.com) for acquisition at 25 kHz. These head stages were configured with a fixed 11kHz lowpass filter. To send signals from the headstage to the evaluation board (RHA2000-EVAL), a custom flex PCB cable was designed that connected the headstage to a commutator (9-Channel SwivElectra, Crist Instruments, http://www.cristinstrument.com/), which then passed signal to the RHA2000-EVAL. All data was analyzed off-line using a series of custom MATLAB (Mathworks, http://www.mathworks.com/) scripts. During the experiment birds were recorded continuously for five days each week and left off the flex-PCB cable for two days a week. To record singing, a miniature microphone (Knowles Acoustics; Digi-Key catalog # EM-23046-P16, http://www.digikey.com) was glued to the Intan headstage and recorded through an electrode channel, following a protocol that is now available online (http://www.intantech.com/files/Intan_RHA2000_microphone_app_note.pdf). For the data recorded here, the reference electrode for all channels and microphone was an uninsulated carbon fiber bundled along with 15 insulated fibers. Prior to spike sorting, this reference signal was occasionally replaced offline with a common average reference subtraction (Ludwig et al., 2009). In preliminary tests, referencing to one of the insulated electrodes also works fine. In practice, the referencing is accomplished by bridging the reference channel on the Intan headstage to an arbitrary electrode pin on the Intan headstage. (Note that the online protocol for microphone recording referenced above should be modified to ground one of the electrodes, so that the reference signal can be recorded. Subtracting the reference from the microphone signal offline will provide a cleaner microphone signal, though in practice referencing the mic to the brain works well most of the time, since the two signal amplitudes are of very different scales.)
Data Analysis
Song bouts were detected by looking for threshold crossings in the average power of the microphone trace between 2-6 kHz. Song syllables were clustered using previously defined methods (Poole, Markowitz, & Gardner, 2012). We used a manual cluster cut to train a support vector machine (Cortes & Vapnik, 1995), which subsequently identified all instances of that syllable automatically.
To analyze single-unit activity, voltage traces were aligned to singing and high pass filtered with an 800 Hz cutoff (2nd order Butterworth filter). A threshold was set to a 4σn, where σN is an estimate of the noise level, (Quiroga, Nadasdy, & Ben-Shaul, 2004). After detecting positive- and negative-going threshold crossings, we took a 1.1 ms window centered on the threshold crossing and re-centered on the absolute minimum after interpolating by a factor of 8 using cubic splines. Features of the aligned spike windows were computed using principal components analysis (Abeles & Goldstein, 1977). We fit a mixture of Gaussians model to the features using the Expectation Maximization algorithm (Dempster, Laird, & Rubin, 1977), and to detect the number of components in the mixture we fit models with 2-7 components, and chose the best model by minimum description length (Rissanen, 1978).
We assessed the quality of clustering using signal-to-noise ratio (SNR), defined as the peak-to-peak voltage of mean spike waveform divided by the six times the standard deviation of the signal with all spikes removed. Only units exceeding a SNR of 1.1 were included for additional analysis (Ludwig et al., 2009). Additionally, inter-spike-interval histograms (ISIHs) were checked for refractory period violations, and the L-ratio and Isolation Distance were used to assess the quality of unit isolation (Schmitzer-Torbert, Jackson, Henze, Harris, & Redish, 2005). The spike-sorting analysis described above applies an accepted standard for “sorted” single units that results in signals of varying degrees of isolation
In addition to this analysis, we applied a more stringent analysis for unambiguous single units which required a minimum SNR of 2.8 and 0% ISI violations, which is sortable based on amplitude-threshold alone. For these “rigorous” single units, we also required stability of firing pattern as illustrated in Figure 7. In what follows we report both on “standard single units”, or sorted multi-unit, and “rigorous single units,” making clear which criteria applies to each statement.
Figure 7. Example stability of spike features and firing pattern in rigorous single units.
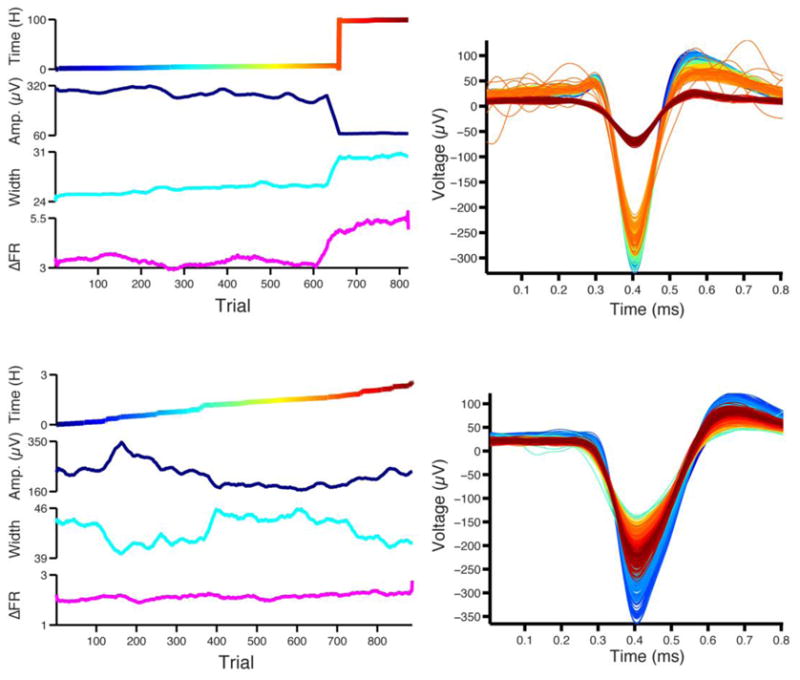
Left, The total elapsed time from the first trial (top), peak amplitude (second from top), spike width (second from bottom, in samples at 200 kHz) and root-mean-square error of the average instantaneous firing rate estimated in a sliding 25 trial window (bottom, see Methods) are shown across trials. Right, trial-averaged spike waveform. Colors match the elapsed time shown on the left. In the top example, both spike features and the firing pattern sharply change on the same trial. The bottom example demonstrates the utility of a stable firing pattern (see Figure S10 for the spike raster). Though the spike features drift from trial to trial, the firing pattern remains stable, allowing for reliable unit identification through continuous changes in the waveform. The firing variability measure used here is sensitive to variability in song duration, and the 15% change seen over the course of the day is accurate, and not the result of imprecision in spike identification.
Sorted multi-unit and single-unit stability using spike features and spike train statistics
A critical question in chronic studies is whether two different clusters on separate days represent the same neuron. To approach this problem quantitatively, we used methods developed in (Dickey et al., 2009; Fraser & Schwartz, 2012; Tolias et al., 2007). In brief, the similarity between mean waveforms and inter-spike-interval histograms were used as measures of the likelihood that clusters across recordings sessions represent the sorted multi-unit ensemble site. For waveform similarity, we used the Fisher-transformed peak normalized cross-correlation; for ISIH similarity, we used the Jensen Shannon divergence (Lin, 1991), a commonly used probability distance measure.
In HVC of an adult songbird, it is also possible to confirm recording stability by examining raster patterns across time. For neurons classified as stable by the methods described above, we found consistent firing patterns across time (Figure S8). This point is discussed in greater detail in the results section.
To verify the stability of rigorous single-units, we continuously tracked the spike height, spike width, and change in firing pattern across bouts of singing. The change in firing pattern was assessed by computing the average smoothed instantaneous firing rate (Gaussian window, σ=5 ms) (Leonardo & Fee, 2005) over a 25 trial sliding window and taking the root-mean-square error between successive window averages. Synchronous changes in spike features and the firing pattern indicated that the single-unit signal had been lost or contaminated by other cells.
Imaging
Scanning Electron Microscopy images of the carbon fiber arrays were taken at the Boston University Photonics Center using a Zeiss Supra 55VP Field Emission Scanning Electron Microscope. Confocal images were taken with an Olympus 1×70 microscope. For fluorescence imaging of electrode tips, we coated UMS carbon fibers with Parylene-C containing 1% anthracene (141062 Sigma Aldrich) which fluoresces in ultraviolet light. Images were acquired using Olympus MagnaFIRE software and measurements of the length of the carbon fiber tip exposed from Parylene were made in Adobe Illustrator CS6 by merging the fluorescence with wide-field images.
Results
Fire sharpening the array
The underwater firing process exposed 89 ±17 (SD) μm of insulation as measured by confocal microscopy (n = 34 tips), leaving sharpened, uniform tips (see SEM images in Fig 1c and fluorescent parylene images in Figure S1). The torching process produced tips with an average impedance of 1.26 MΩ (n = 210 tips) (Figure 2a). Impedances measured in vivo after implanting showed a wide range of values in the weeks following implant (Figure 2b).
Acute Recordings
To initially assess the viability of carbon fiber electrode arrays for recording at various depths we recorded extracellular signal acutely in anesthetized or awake head-fixed birds (n=4 cells from 4 birds). Figure S2 shows average waveforms from well-isolated neurons and spike trains recorded in auditory area Field L in awake head-fixed birds with an SNR of 9.18 and 3.00 (Figure S2a and S2d, respectively); in premotor nucleus HVC in an anesthetized bird with an SNR of 21.64 (Figure S2b) and in basal ganglia nucleus Area X in an anesthetized bird with an SNR of 3.50 (Figure S2c). Carbon fiber arrays were thus able to measure signals from a range of cell types across a variety of brain regions, including a recording zone 3.0 mm deep (Area X).
Single-Unit Recordings in Freely Behaving Birds
Our primary goal was to develop an electrode capable of tracking single units and small multi-unit clusters over extended periods of time. Thus, to assess the reliability and longevity of single cell signal, we implanted sixteen-channel carbon fiber arrays into the premotor nucleus HVC (n=10 birds), an area that produces precise neural firing patterns that ultimately drive muscular sequences to produce song (M. A. Long et al., 2010). Spikes were aligned to all renditions of a given vocal element for a single day and displayed as a raster plot (Figure 3). Figure 4 shows one such raster from a putative HVC interneuron (classified as single-unit by the standard criterion - see Methods) recorded over a period of 15 days. Average waveforms and ISIHs from the 1st, 7th and 14th days are consistent throughout the period (Figure S3). The average firing patterns are also stable over these time-scales.
Figure 3. Single unit recording in singing bird.
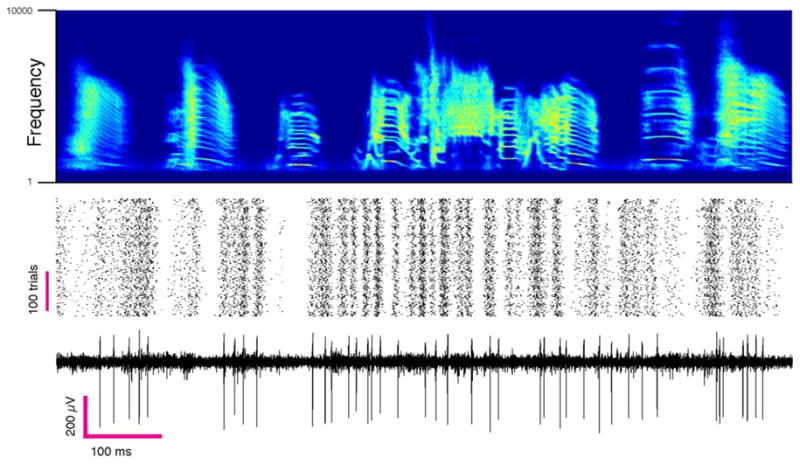
Example of a putative interneuron recorded in the pre-motor nucleus HVC aligned to song. Top, the time frequency histogram of aligned renditions of the same song motif. Middle and Bottom, spike raster from a single unit aligned to song and a raw trace from the same channel.
Figure 4. Chronic recording stability in the singing bird.
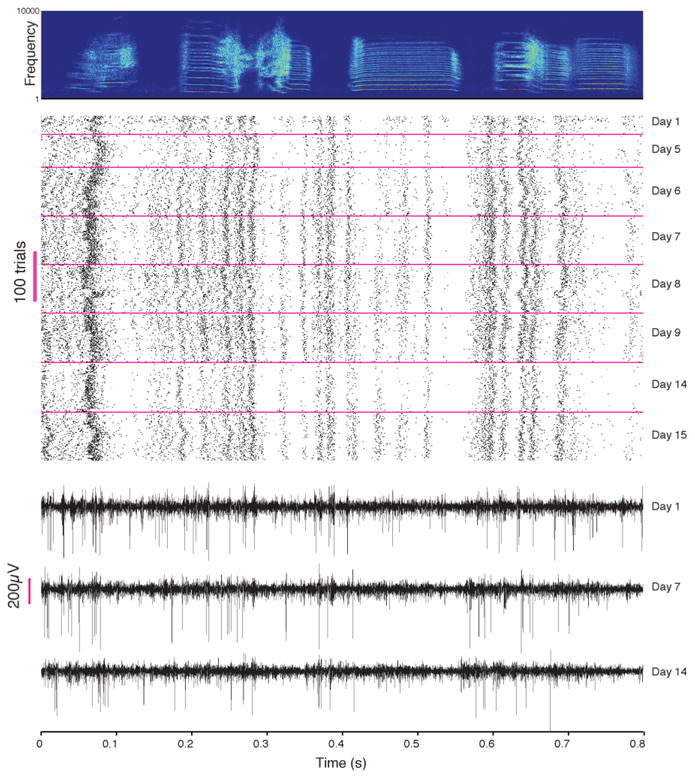
Top, A putative HVC interneuron (single unit by the standard criterion) in bird recorded over 15 days. Bottom, raw traces from the same channel on Days 1, 7 and 14. Signal fading (as on day 14) indicates periods of partial loss of cell isolation.
Additionally, in some cells we found distinctive waveforms and discharge patterns characteristic of principal neurons; that is, sparse high-frequency bursting aligned to a single point in the bird's song (Figure 5). The cell recorded for this figure met the standard criterion for single unit isolation (projection neurons of various signal qualities are shown in Figure S4-5). Prior recordings of this neuron type have required high impedance electrodes mounted on motorized microdrives that allow for fine positioning of the electrode in the vicinity of the neuron (Hahnloser, Kozhevnikov, & Fee, 2002b). This is the first report of HVC projection neuron recordings from immobile chronic implants. The yield and longevity of all recorded neuron types are reported below. On two occasions, a portion of the sharpened tip of an electrode apparently entered a cell, yielding intracellular-like traces that were stably held for 12 hours in one case and 36 hours in the next (Figure S6). The intracellular-like cells recorded in area X and HVC were characterized by high amplitude spikes and positive subthreshold voltage ramps prior to spikes or bursts and stereotyped hyperpolarizing potentials following the burst in the area X cell. In these rare recordings a portion of the uninsulated (80 micron) tip must have remained outside the cell (Angle & Schaefer, 2012).
Figure 5. A principal cell recorded in HVC.
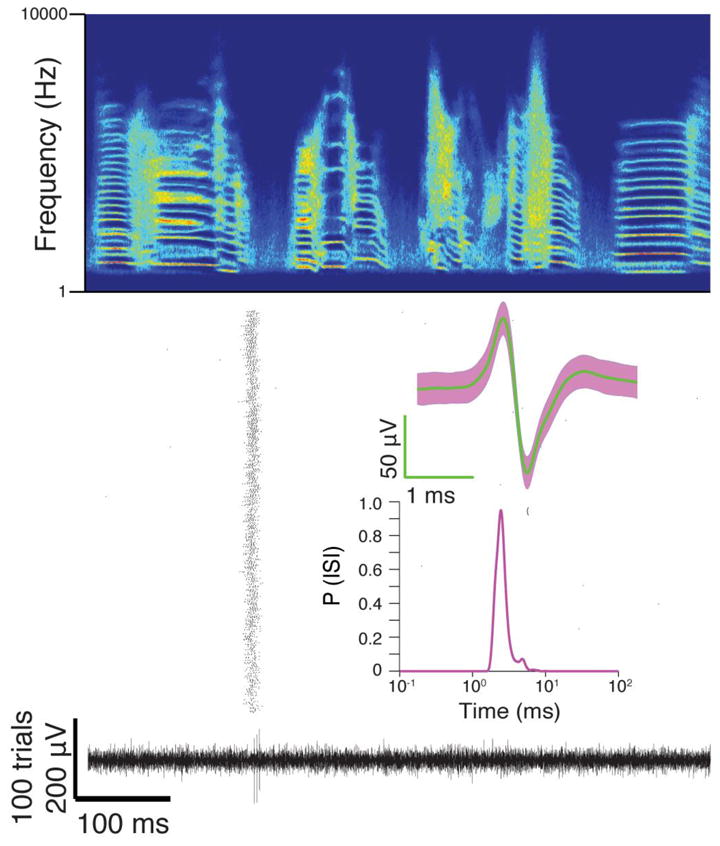
Top, Song-aligned spike raster of a putative RA-projecting neuron. Bottom, The raw voltage trace from rendition 199 out of 500 song renditions recorded across 1 hour and 26 minutes. Insets show the average waveform with SD and ISI distribution.
Simultaneously Recorded Traces
Of particular interest in multi-electrode recordings is not only the longevity of single-unit signal, but the ability to record multiple signals at once. In chronic implants of carbon fiber arrays, high quality multi-unit signal was often present on the majority of electrode contacts, though multiple “rigorous” single units were not recorded simultaneously on any implant. Figure 6 shows fifteen simultaneously recorded multi-unit channels five days post-implant out of sixteen total channels (fourth channel from the top is bridged to reference; channel not shown is the microphone trace). With the small diameter and proximity of electrodes, individual neurons were occasionally visible on multiple channels simultaneously. Features of correlated signal across channels (i.e. tetrode effect) are commonly necessary to isolate densely packed neurons, but these features were not used here. However, Figure S7 shows two examples of channels with common signal on two channels from birds implanted with 16-channel arrays. This figure illustrates the potential of improving single unit isolation based on multi-electrode features in future carbon fiber electrode designs.
Figure 6. Simultaneously recorded activity.
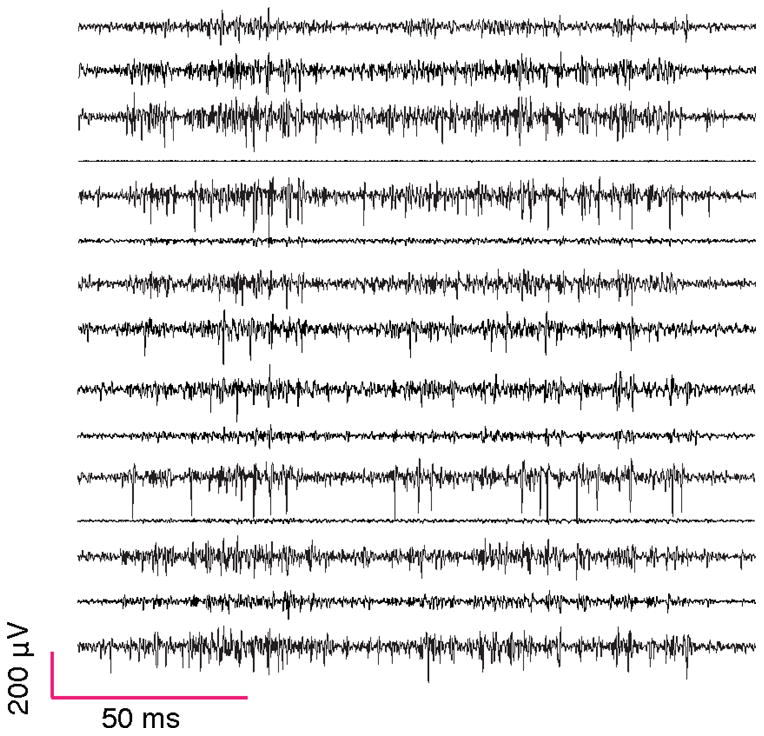
Signal from 15 simultaneously recorded channels during singing (one channel was used for the microphone trace). Fourth trace from the top is the reference electrode. (The reference electrode is always one of the carbon fibers in the bundle.) These signals were not sortable by our criteria.
Yield and single unit stability
Single units defined by standard criteria were defined as containing (1) adequate SNR (>1.1) and (2) a minimal fraction of ISIs shorter than a refractory period of 1 ms (<5%). After discarding clustered units that did not meet these criteria, we recorded an average of 5.3 neurons per bird as defined by the standard criterion (see Methods) (n=6) that ranged from as few as 2 neurons to as many as 8. This count includes both putative interneurons and projection neurons, classified according to their firing patterns.
Four rigorous single units (n=3 interneurons and n=1 projection neuron) (SNR > 2.8 and 0% ISI violations) were found in a set of n=4 implants. Finally, 16 projection neurons that did not meet the rigorous single unit criteria were recorded in at total of n=10 implants (SNR<2.8, though for this population all cells had 0% ISI violations except two, which had 0.3%). These cells produce a single burst one or two stereotyped times in the song, and single unit isolation could be confirmed in spite of the low SNR values. For this population of cells, we computed the fraction of contaminating spikes (spikes occurring within 100ms of the burst, but outside a 10ms window around the average burst time). The fraction of contaminating spikes ranged from F=0.425 in the most marginal case to F=0.008 in the best case, with an average of 0.128 ±.135 (SD). Examples of these raster plots are illustrated in Figure S4.
To assess the stability of isolated units, we followed the methodology of (Dickey et al., 2009; Fraser & Schwartz, 2012) (see Methods). From one day to the next, a stable waveform indicated continuity of recording from a single neuron. However, considering the population of all neurons recorded, waveform shapes were not unique, nor were ISIHs. One solution is to increase the dimensionality of the waveform shape by considering projections of the waveform on additional channels. However, in HVC of adult songbirds, a more powerful approach is possible based on the unique spike patterns produced by different neurons in HVC (Hahnloser, Kozhevnikov, & Fee, 2002b; Kozhevnikov & Fee, 2007). For each neuron observed here, spike timing patterns were unique and stable across time (Figure S8 and S9.). This is true both for clusters consisting of small numbers of cells (Figure S8), single interneurons (Figure 7), and projection neurons (Figure S4).
Of the 27 neurons that passed the standard SNR and ISIH quality criteria (n=6 implants), we analyzed the 18 standard quality cells that were stable for more than one day (for the other 9, no suitable clusters on the same electrode channel were found after the first recording session). Of this set of 18, the cluster quality varied, with 5/18 having <1% ISI violations and the rest <5%. The longevity of each recording is shown for each of 18 standard cells in Figure 8. Of this total, 11/18 were stable for one week, 6/18 for two weeks, and 4/18 for 30 days. Projection neurons were not recorded for more than 2 days.
Figure 8. Stability of sorted multi-units and single-units.
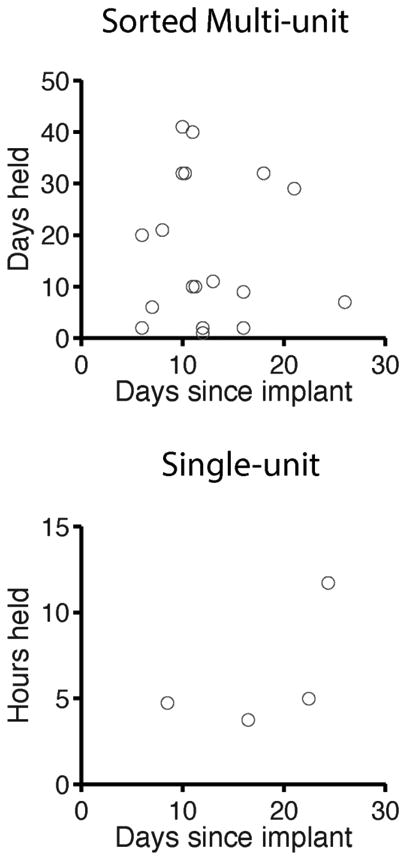
Top, Stability of sorted multi-units. These points represent single units by standard criteria. The 107 day example from Figure S9 is excluded from this plot. Bottom, Stability of rigorous single-units, which were isolatable based on threshold alone.
For the rigorous single units (n=4) we analyzed all putative cell types. The longevity of each single unit recording is shown for each of 4 neurons in Figure 8, which ranges from 4 to 12 hours. (Outside of this time-scale, the cells fell below the threshold for rigorous single units, though they were still isolatable based on standard criteria that allowed for some error.)
Discussion
The carbon “microthread” electrode array provides a stable interface to record small neurons in singing birds. We have shown that the arrays yield stable signals over time-scales of weeks, with occasional examples over time-scales of months (Figure S9). The process of unit isolation described here did not take advantage of the occasional appearance of neurons on multiple channels of the electrode bundle; exploiting multichannel features (through the tetrode effect, Figure S7) would likely increase the yield and stability of single units recording with this array. Over the time-scale of our recordings, individually unique firing patterns consisting of small multi-unit clusters were stable, allowing confirmation of the independent measures of stability based on waveform and ISI distributions. For the zebra finch, ground truth for neural stability is available; distinctive firing patterns provided the added information needed to confirm recording stability in an automated analysis. This approach can be compared to the utility of studying neural interfaces in areas with distinct sensory, motor, or place-field responses that can aid in single neuron identification.
The carbon fiber electrodes differ from commercially available arrays in a number of respects–the most obvious is the small scale. The constraint of planar wiring patterns in silicon arrays leads to relatively wide shanks in most electrode geometries (minimum 47 μm shank width (e.g. the Neuronexus Buzsaki64sp probe; 125μm shank spacing; 15 μm thickness). In other silicon arrays, the electrode tips are small, but the taper on each electrode expands rapidly (e.g. the Utah array: electrodes are 80μm in diameter at the base and taper down to a point - (Jones, Campbell, & Normann, 1992)). This large diameter can lead to significant tissue damage and gliosis (Biran et al., 2005; Polikov et al., 2005). The carbon fiber bundle is comparable in diameter (26 microns) to many single microwires (12-50 microns (Gray, Maldonado, Wilson, & McNaughton, 1995; Nicolelis, Lehew, & Nicolelis, 2008)), and the thin profile holds not only for the tip, but along the full length of the electrode. The process of implanting the electrode is, as a result, minimally invasive (T. K. Kozai et al., n.d.). The dense tip geometry and thin shank may be particularly useful for targeting deep brain structures. Carbon fiber is available in a range of stiffnesses, and the relative ease of implanting the carbon bundle suggests that even more flexible fibers may be implantable in the same geometry, particularly if they are first stiffened by a dissolvable substrate (Chorover & DeLuca, 1972; Kim et al., 2010).
With practice, assembly times for a 16 channel array are 3-4 hours, per array, including all steps from carbon insulation through tip preparation. If the small geometry or other material properties of the carbon bundle can be definitively associated with increased stability of neural recordings, then a search for manufacturing processes that can scale up the number of contacts or efficiency of construction is well-motivated.
The carbon bundles reported here provide the first long-term recordings in nucleus HVC of singing birds, and the first report of projection neurons in HVC isolated with immobile implants. The chronic stability of the carbon fiber signal is striking, but the biggest limitation in the present data set is the scarcity of high SNR single unit recordings that allow for unambiguous isolation of single cells based on spike threshold alone. While cells of this “rigorous single unit” quality did appear in our data set, they were rare, and most of the data reported here is “single unit” by standard spike clustering measures that allow for a significant degree of mislabeled spikes. (For example, the small drift in firing patterns shown in Figure 7 may be due to imperfect isolation rather than changes in the underlying biological signal.) The recording tip of the electrode is 80 microns long, and given the length scale of this uninsulated tip, it is surprising that single unit isolation in HVC is possible in singing birds. In HVC,10-15 micron diameter projection neurons fire in a background of highly synchronous interneuronal activity, making isolation of this cell type extremely challenging. The path forward for this design will require improved control of the electrode bundle geometry so that multi-channel features can be used more frequently for single cell isolation. In parallel, smaller tip geometries could improve isolation, though maintaining low impedance for smaller tip geometries will require modifications of the recording surface through conductive polymers (T. D. T. Y. Kozai et al., 2012), attachment of carbon nanotubes (Keefer, Botterman, Romero, Rossi, & Gross, 2008), or other surface modifications. Systematic comparisons of this design with other fixed electrode technologies are also needed in preparations such as rodent hippocampus where background data is available for other electrode types. With the current carbon fiber electrode bundle, firing patterns of small clusters of cells in HVC can be tracked over time-scales of learning in songbirds. Occasionally, rigorous single units can be isolated over time-scales of hours to days, but numerous improvements are needed to increase the yield and longevity of these high quality units. Carbon fiber electrodes may provide a scalable solution for chronic recording of densely packed cells in small animals.
Supplementary Material
Figure S1. A, Left, wide-field image of a carbon fiber coated in fluorescent Parylene-C, after it had been fire-sharpened. Middle, UV filter image for the same fiber. Right, Merged images of the wide-field and fluorescence view shows that the fire sharpening method exposes an average of 89 ± 17 microns. B, Another example fiber. The length of the exposed carbon tip was taken to be the distance from the point to the boundary of the full intensity Parylene edge.
Figure S2. Average waveforms of isolated single units recorded acutely with 16-channel carbon fiber arrays. A, A unit recorded in auditory area Field L in an awake head-fixed bird (SNR=9.18). B, A unit from the pre-motor nucleus HVC in an anesthetized bird (SNR=21.64). C, An isolated unit found in the basal ganglia of an anesthetized bird (SNR=3.50). D, A unit recorded in Field L of an awake, head-fixed bird (SNR=3). Insets show corresponding spike trains. Inset scale bars: (A) 200 μV, 50 s; (B) 400 μV, 100 s; (C) 100 μV, 1 s; (D) 100 μV, 5 s. Pink indicates standard deviation.
Figure S3. Clusters for the chronic signal shown in Figure 3b. Top row, overlaid spike waveforms. Middle row, spike waveform histograms. Bottom row, spike ISIHs. The SNR changed from 2.39 on Day 1 of recording (left column) to 3.29 on Day 7 (middle column) and 2.09 on Day 14 (right column).
Figure S4. Example projection neuron recordings of various signal qualities. Song-aligned rasters from 6 neurons show the effect of signal quality on unit isolation. As signal quality decreases, the number of contaminating non-burst “error” spikes increases. All units except the one shown in the bottom left raster meet the standard criteria for single units (see Methods). The raster in the top left met the more stringent criterion
Figure S5. Single trial voltage traces from 3 rasters show in Figure S4. The single trial voltage traces are shown with the identified spikes indicated by a red asterisk. Colors match rasters from Figure S4.
Figure S6. A, a bursting cell with high amplitude positive peaks recorded from a bird implanted in Area X. Top: sonogram of the song; middle: spike raster; bottom: low-pass filtered traces showing prominent LFP modulation during spiking. B, A similar cell recorded from a bird implanted in HVC. Unfiltered traces during a call, across two days (top); and during singing (bottom).
Figure S7. Tetrode Effect. A and C, Example traces recorded from a chronically implanted bird showing correlated signal on two channels. Pink stars indicate example times for spikes present on both channels. B and D, scatter plots of spikes amplitudes on the two channels showing correlated signal. Events do not fall on the unity line (dotted line), suggesting that the common signal is not explained by cross-talk.
Figure S8. Sorted Multi-unit Stability. A, Four signals recorded in HVC on different channels in one bird. Each site was recorded on two sessions for each neuron. (Units were sortable by the standard criterion). Firing patterns on different electrodes are distinct across the small ensembles, but similar for any given ensemble's two recording sessions. Days post implant of recordings are shown to the right of each raster. B, Principal components analysis of the firing rate patterns shown in A. Each dot indicates the average projection of the firing patterns for an entire day and colors indicate separate channels.
Figure S9. An HVC interneuron recorded on sessions 107 days apart. Analysis on waveform shape, ISI distribution and firing pattern classifies the recordings as the same sorted cell, based on the standard criterion. Dates post implant are shown on the left of each raster.
Figure S10. Spike raster for bottom example from Figure 7. All trials included in the analysis for the bottom example from Figure 7 are shown in order from top to bottom.
Acknowledgments
We wish to thank Julia Kerner for help with bird care, Alexey Nikiforov for help with SEM imaging, and Ian Davison for comments on the manuscript.
Grants: This work is supported by the NSF Science of Learning Center CELEST (SBE-0354378), a Career Award at the Scientific Interface to TG from the Burroughs Wellcome Fund, a Smith family award to TG, an NIH R90DA033460 grant to WAL and by the Boston University Center for Neuroscience.
Footnotes
Disclosures: We declare that we have no conflicts of interest, financial or otherwise.
References
- Abeles M, Goldstein MH., Jr Multispike train analysis. Presented at the Proceedings of the IEEE.1977. [Google Scholar]
- Angle MR, Schaefer AT. Neuronal recordings with solid-conductor intracellular nanoelectrodes (SCINEs) PLoS ONE. 2012;7(8):e43194–e43194. doi: 10.1371/journal.pone.0043194. [DOI] [PMC free article] [PubMed] [Google Scholar]
- Armstrong-James M, Millar J. Carbon fibre microelectrodes. Journal of Neuroscience Methods. 1979;1(3):279–287. doi: 10.1016/0165-0270(79)90039-6. [DOI] [PubMed] [Google Scholar]
- Biran R, Martin DC, Tresco PA. Neuronal cell loss accompanies the brain tissue response to chronically implanted silicon microelectrode arrays. Experimental Neurology. 2005;195(1):115–126. doi: 10.1016/j.expneurol.2005.04.020. [DOI] [PubMed] [Google Scholar]
- Chestek CA, Batista AP, Santhanam G, Yu BM, Afshar A, Cunningham JP, Gilja V, et al. Single-neuron stability during repeated reaching in macaque premotor cortex. Journal of Neuroscience. 2007;27(40):10742–10750. doi: 10.1523/JNEUROSCI.0959-07.2007. [DOI] [PMC free article] [PubMed] [Google Scholar]
- Chorover SL, DeLuca AM. A sweet new multiple electrode for chronic single unit recording in moving animals. Physiology & behavior. 1972;9(4):671–674. doi: 10.1016/0031-9384(72)90030-3. [DOI] [PubMed] [Google Scholar]
- Cortes C, Vapnik V. Support-vector networks. Machine learning 1995 [Google Scholar]
- Dempster AP, Laird NM, Rubin DB. Maximum likelihood from incomplete data via the EM algorithm. Journal of the Royal Statistical Society Series B (Methodological) 1977:1–38. [Google Scholar]
- Dickey AS, Suminski A, Amit Y, Hatsopoulos NG. Single-unit stability using chronically implanted multielectrode arrays. Journal of Neurophysiology. 2009;102(2):1331–1339. doi: 10.1152/jn.90920.2008. [DOI] [PMC free article] [PubMed] [Google Scholar]
- Donoghue JP. Bridging the brain to the world: a perspective on neural interface systems. Neuron. 2008;60(3):511–521. doi: 10.1016/j.neuron.2008.10.037. [DOI] [PubMed] [Google Scholar]
- Fee MS, Leonardo A. Miniature motorized microdrive and commutator system for chronic neural recording in small animals. Journal of Neuroscience Methods. 2001;112(2):83–94. doi: 10.1016/s0165-0270(01)00426-5. [DOI] [PubMed] [Google Scholar]
- Fraser GW, Schwartz AB. Recording from the same neurons chronically in motor cortex. Journal of Neurophysiology. 2012;107(7):1970–1978. doi: 10.1152/jn.01012.2010. [DOI] [PMC free article] [PubMed] [Google Scholar]
- Garris PA, Ciolkowski EL, Pastore P, Wightman RM. Efflux of dopamine from the synaptic cleft in the nucleus accumbens of the rat brain. The Journal of neuroscience : the official journal of the Society for Neuroscience. 1994;14(10):6084–6093. doi: 10.1523/JNEUROSCI.14-10-06084.1994. [DOI] [PMC free article] [PubMed] [Google Scholar]
- Gray CM, Maldonado PE, Wilson M, McNaughton B. Tetrodes markedly improve the reliability and yield of multiple single-unit isolation from multi-unit recordings in cat striate cortex. Journal of Neuroscience Methods. 1995;63(1-2):43–54. doi: 10.1016/0165-0270(95)00085-2. [DOI] [PubMed] [Google Scholar]
- Hahnloser RHR, Kozhevnikov AA, Fee MS. An ultra-sparse code underlies the generation of neural sequences in a songbird. Nature. 2002a;419(6902):65–70. doi: 10.1038/nature00974. [DOI] [PubMed] [Google Scholar]
- Hahnloser RHR, Kozhevnikov AA, Fee MS. An ultra-sparse code underlies the generation of neural sequences in a songbird. Nature. 2002b:1–7. doi: 10.1038/nature00974. [DOI] [PubMed] [Google Scholar]
- Harvey CDC, Coen PP, Tank DWD. Choice-specific sequences in parietal cortex during a virtual-navigation decision task. Nature. 2012;484(7392):62–68. doi: 10.1038/nature10918. [DOI] [PMC free article] [PubMed] [Google Scholar]
- Jones KE, Campbell PK, Normann RA. A glass/silicon composite intracortical electrode array. Annals of biomedical engineering. 1992;20(4):423–437. doi: 10.1007/BF02368134. [DOI] [PubMed] [Google Scholar]
- Katz LC, Gurney ME. Auditory responses in the zebra finch's motor system for song. Brain Research. 1981;221(1):192–197. doi: 10.1016/0006-8993(81)91073-8. [DOI] [PubMed] [Google Scholar]
- Keefer EW, Botterman BR, Romero MI, Rossi AF, Gross GW. Carbon nanotube coating improves neuronal recordings. Nature nanotechnology. 2008;3(7):434–439. doi: 10.1038/nnano.2008.174. [DOI] [PubMed] [Google Scholar]
- Kentros CG, Agnihotri NT, Streater S, Hawkins RD, Kandel ER. Increased attention to spatial context increases both place field stability and spatial memory. Neuron. 2004;42(2):283–295. doi: 10.1016/s0896-6273(04)00192-8. [DOI] [PubMed] [Google Scholar]
- Kim DH, Viventi J, Amsden JJ, Xiao J, Vigeland L, Kim YS, Blanco JA, et al. Dissolvable films of silk fibroin for ultrathin conformal bio-integrated electronics. Nature materials. 2010;9(6):511–517. doi: 10.1038/nmat2745. [DOI] [PMC free article] [PubMed] [Google Scholar]
- Koralek AC, Jin X, Long JD, II, Costa RM, Carmena JM. Corticostriatal plasticity is necessary for learning intentional neuroprosthetic skills. Nature. 2012;483(7389):331–335. doi: 10.1038/nature10845. [DOI] [PMC free article] [PubMed] [Google Scholar]
- Kozai TDTY, Langhals NBN, Patel PRP, Deng XX, Zhang HH, Smith KLK, Lahann JJ, et al. Ultrasmall implantable composite microelectrodes with bioactive surfaces for chronic neural interfaces. Nature materials. 2012;11(12):1065–1073. doi: 10.1038/nmat3468. [DOI] [PMC free article] [PubMed] [Google Scholar]
- Kozai TK, Langhals NB, Patel PR, Deng X, Zhang H, Lahann J, Kotov NA, et al. In vivo chronic cortical recordings using novel ultra-small carbon fiber based implantable microthread ultramicroelectrodes. Presented at the 2010 Neuroscience Meeting Planner; San Diego, CA. 2010. Society for Neuroscience, 2010. Online. [Google Scholar]
- Kozhevnikov AA, Fee MS. Singing-Related Activity of Identified HVC Neurons in the Zebra Finch. Journal of Neurophysiology. 2007;97(6):4271–4283. doi: 10.1152/jn.00952.2006. [DOI] [PubMed] [Google Scholar]
- Leonardo A, Fee MS. Ensemble coding of vocal control in birdsong. Journal of Neuroscience. 2005;25(3):652–661. doi: 10.1523/JNEUROSCI.3036-04.2005. [DOI] [PMC free article] [PubMed] [Google Scholar]
- Lewicki MS. Intracellular characterization of song-specific neurons in the zebra finch auditory forebrain. The Journal of neuroscience : the official journal of the Society for Neuroscience. 1996;16(18):5855–5863. [PubMed] [Google Scholar]
- Lin J. Divergence measures based on the Shannon entropy. Information Theory 1991 [Google Scholar]
- Long MA, Jin DZ, Fee MS. Support for a synaptic chain model of neuronal sequence generation. Nature. 2010;468(7322):394–399. doi: 10.1038/nature09514. [DOI] [PMC free article] [PubMed] [Google Scholar]
- Ludwig KA, Miriani RM, Langhals NB, Joseph MD, Anderson DJ, Kipke DR. Using a Common Average Reference to Improve Cortical Neuron Recordings From Microelectrode Arrays. Journal of Neurophysiology. 2009;101(3):1679–1689. doi: 10.1152/jn.90989.2008. [DOI] [PMC free article] [PubMed] [Google Scholar]
- Mooney R. The HVC Microcircuit: The Synaptic Basis for Interactions between Song Motor and Vocal Plasticity Pathways. Journal of Neuroscience. 2005;25(8):1952–1964. doi: 10.1523/JNEUROSCI.3726-04.2005. [DOI] [PMC free article] [PubMed] [Google Scholar]
- Nicolelis MA, Lehew G, Nicolelis MAL. State-of-the-Art Microwire Array Design for Chronic Neural Recordings in Behaving Animals. 2nd. Boca Raton (FL): CRC Press; 2008. [PubMed] [Google Scholar]
- Polikov VS, Tresco PA, Reichert WM. Response of brain tissue to chronically implanted neural electrodes. Journal of Neuroscience Methods. 2005;148(1):1–18. doi: 10.1016/j.jneumeth.2005.08.015. [DOI] [PubMed] [Google Scholar]
- Poole BB, Markowitz JEJ, Gardner TJT. The song must go on: resilience of the songbird vocal motor pathway. PLoS ONE. 2012;7(6):e38173–e38173. doi: 10.1371/journal.pone.0038173. [DOI] [PMC free article] [PubMed] [Google Scholar]
- Quiroga RQ, Nadasdy Z, Ben-Shaul Y. Unsupervised spike detection and sorting with wavelets and superparamagnetic clustering. Neural computation. 2004;16(8):1661–1687. doi: 10.1162/089976604774201631. [DOI] [PubMed] [Google Scholar]
- Rissanen J. Modeling by shortest data description. Automatica 1978 [Google Scholar]
- Rokni U, Richardson AG, Bizzi E, Seung HS. Motor learning with unstable neural representations. Neuron. 2007;54(4):653–666. doi: 10.1016/j.neuron.2007.04.030. [DOI] [PubMed] [Google Scholar]
- Schmitzer-Torbert N, Jackson J, Henze D, Harris K, Redish AD. Quantitative measures of cluster quality for use in extracellular recordings. Neuroscience. 2005;131(1):1–11. doi: 10.1016/j.neuroscience.2004.09.066. [DOI] [PubMed] [Google Scholar]
- Schulte A, Chow RH. Cylindrically etched carbon-fiber microelectrodes for low-noise amperometric recording of cellular secretion. Analytical chemistry. 1998;70(5):985–990. doi: 10.1021/ac970934e. [DOI] [PubMed] [Google Scholar]
- Scott BB, Gardner T, Ji N, Fee MS, Lois C. Wandering Neuronal Migration in the Postnatal Vertebrate Forebrain. Journal of Neuroscience. 2012 doi: 10.1523/JNEUROSCI.2145-11.2012. [DOI] [PMC free article] [PubMed] [Google Scholar]
- Subbaroyan J, Martin DC, Kipke DR. A finite-element model of the mechanical effects of implantable microelectrodes in the cerebral cortex. Journal of Neural Engineering. 2005;2(4):103–113. doi: 10.1088/1741-2560/2/4/006. [DOI] [PubMed] [Google Scholar]
- Thompson LT, Best PJ. Long-term stability of the place-field activity of single units recorded from the dorsal hippocampus of freely behaving rats. Brain Research. 1990;509(2):299–308. doi: 10.1016/0006-8993(90)90555-p. [DOI] [PubMed] [Google Scholar]
- Tolias AS, Ecker AS, Siapas AG, Hoenselaar A, Keliris GA, Logothetis NK. Recording chronically from the same neurons in awake, behaving primates. Journal of Neurophysiology. 2007;98(6):3780–3790. doi: 10.1152/jn.00260.2007. [DOI] [PubMed] [Google Scholar]
Associated Data
This section collects any data citations, data availability statements, or supplementary materials included in this article.
Supplementary Materials
Figure S1. A, Left, wide-field image of a carbon fiber coated in fluorescent Parylene-C, after it had been fire-sharpened. Middle, UV filter image for the same fiber. Right, Merged images of the wide-field and fluorescence view shows that the fire sharpening method exposes an average of 89 ± 17 microns. B, Another example fiber. The length of the exposed carbon tip was taken to be the distance from the point to the boundary of the full intensity Parylene edge.
Figure S2. Average waveforms of isolated single units recorded acutely with 16-channel carbon fiber arrays. A, A unit recorded in auditory area Field L in an awake head-fixed bird (SNR=9.18). B, A unit from the pre-motor nucleus HVC in an anesthetized bird (SNR=21.64). C, An isolated unit found in the basal ganglia of an anesthetized bird (SNR=3.50). D, A unit recorded in Field L of an awake, head-fixed bird (SNR=3). Insets show corresponding spike trains. Inset scale bars: (A) 200 μV, 50 s; (B) 400 μV, 100 s; (C) 100 μV, 1 s; (D) 100 μV, 5 s. Pink indicates standard deviation.
Figure S3. Clusters for the chronic signal shown in Figure 3b. Top row, overlaid spike waveforms. Middle row, spike waveform histograms. Bottom row, spike ISIHs. The SNR changed from 2.39 on Day 1 of recording (left column) to 3.29 on Day 7 (middle column) and 2.09 on Day 14 (right column).
Figure S4. Example projection neuron recordings of various signal qualities. Song-aligned rasters from 6 neurons show the effect of signal quality on unit isolation. As signal quality decreases, the number of contaminating non-burst “error” spikes increases. All units except the one shown in the bottom left raster meet the standard criteria for single units (see Methods). The raster in the top left met the more stringent criterion
Figure S5. Single trial voltage traces from 3 rasters show in Figure S4. The single trial voltage traces are shown with the identified spikes indicated by a red asterisk. Colors match rasters from Figure S4.
Figure S6. A, a bursting cell with high amplitude positive peaks recorded from a bird implanted in Area X. Top: sonogram of the song; middle: spike raster; bottom: low-pass filtered traces showing prominent LFP modulation during spiking. B, A similar cell recorded from a bird implanted in HVC. Unfiltered traces during a call, across two days (top); and during singing (bottom).
Figure S7. Tetrode Effect. A and C, Example traces recorded from a chronically implanted bird showing correlated signal on two channels. Pink stars indicate example times for spikes present on both channels. B and D, scatter plots of spikes amplitudes on the two channels showing correlated signal. Events do not fall on the unity line (dotted line), suggesting that the common signal is not explained by cross-talk.
Figure S8. Sorted Multi-unit Stability. A, Four signals recorded in HVC on different channels in one bird. Each site was recorded on two sessions for each neuron. (Units were sortable by the standard criterion). Firing patterns on different electrodes are distinct across the small ensembles, but similar for any given ensemble's two recording sessions. Days post implant of recordings are shown to the right of each raster. B, Principal components analysis of the firing rate patterns shown in A. Each dot indicates the average projection of the firing patterns for an entire day and colors indicate separate channels.
Figure S9. An HVC interneuron recorded on sessions 107 days apart. Analysis on waveform shape, ISI distribution and firing pattern classifies the recordings as the same sorted cell, based on the standard criterion. Dates post implant are shown on the left of each raster.
Figure S10. Spike raster for bottom example from Figure 7. All trials included in the analysis for the bottom example from Figure 7 are shown in order from top to bottom.