

Abstract
Olfactomedin 1 (Olfm1) is a secreted glycoprotein that is preferentially expressed in neuronal tissues. Here we show that deletion of exons 4 and 5 from the Olfm1 gene, which encodes a 52 amino acid long region in the N-terminal part of the protein, increased neonatal death and reduced body weight of surviving homozygous mice. Magnetic resonance imaging analyses revealed reduced brain volume and attenuated size of white matter tracts such as the anterior commissure, corpus callosum, and optic nerve. Adult Olfm1 mutant mice demonstrated abnormal behavior in several tests including reduced marble digging, elevated plus maze test, nesting activity and latency on balance beam tests as compared with their wild-type littermates. The olfactory system was both structurally and functionally disturbed by the mutation in the Olfm1 gene as shown by functional magnetic resonance imaging analysis and a smell test. Deficiencies of the olfactory system may contribute to the neonatal death and loss of body weight of Olfm1 mutant. Shotgun proteomics revealed 59 candidate proteins that co-precipitated with wild-type or mutant Olfm1 proteins in postnatal day 1 brain. Olfm1-binding targets included GluR2, Cav2.1, Teneurin-4 and Kidins220. Modified interaction of Olfm1 with binding targets led to an increase in intracellular Ca2+ concentration and activation of ERK1/2, MEK1 and CaMKII in the hippocampus and olfactory bulb of Olfm1 mutant mice compared with their wild-type littermates. Excessive activation of the CaMKII and Ras-ERK pathways in the Olfm1 mutant olfactory bulb and hippocampus by elevated intracellular calcium may contribute to the abnormal behavior and olfactory activity of Olfm1 mutant mice.
Keywords: olfactomedin 1, AMPA receptor, neurobiology, proteomics, cell signaling, mouse, anxiety behavior, olfactory defects
Introduction
Olfm1 (also known as noelin in chicken and Xenopus, pancortin in mice, olfactomedin-related glycoprotein in rats, and hOlfmA in human) is a highly conserved secreted glycoprotein containing an N-terminal signal peptide followed by a coiled-coil domain and an olfactomedin domain located in the C-terminus (Tomarev and Nakaya, 2009). Four structurally distinct mRNAs, named AMY, BMY, AMZ and BMZ, are produced from the Olfm1 gene (Danielson et al., 1994). These mRNAs share a common central region (M), have two different 5′-regions (A and B) transcribed from separate promoters, and two different 3′-regions (Y and Z) produced by alternative splicing of corresponding mRNAs (Danielson et al., 1994). The olfactomedin domain is encoded by the last two 3′-exons found in the AMZ (or pancortin-1) and BMZ (or pancortin-2) forms. Available data suggest that Olfm1 plays a role in promoting neuronal cell death, cortical cell migration and axon growth in mice (Cheng et al., 2007; Nakaya et al., 2012; Rice et al., 2012), neural crest production and cell invasion during epithelial-mesenchymal transition in the embryonic heart in chicken (Barembaum et al., 2000; Lencinas et al., 2012), maintenance of neuronal precursor cells in Xenopus (Moreno and Bronner-Fraser, 2005), eye size regulation and optic nerve arborization in the optic tectum in zebrafish (Nakaya et al., 2008).
The molecular mechanisms underlying Olfm1 activities remain unclear. The identification of Olfm1-interacting proteins and protein complexes containing Olfm1 represents one possible approach to elucidating such mechanisms. Several candidate proteins interacting with Olfm1 have been identified. They include WAVE1 and Bcl-xL (Cheng et al., 2007), β-dystrobrevin (Veroni et al., 2007), Wnt inhibitory factor 1 (WIF1) (Nakaya et al., 2008), NOGO A receptor 1 (NgR1) (Nakaya et al., 2012), amyloid precursor protein (Rice et al., 2012), and AMPA receptors (Schwenk et al., 2012; Shanks et al., 2012). These finding suggest that Olfm1 may be involved in the regulation of the actin cytoskeleton, RhoA activity, microtubule-mediated transport, and the Wnt signaling pathway, as well as in the modulation of fast excitatory neurotransmission, postsynaptic plasticity, or synapse development.
Pancortin-2 knockout mice have been previously generated by the elimination of the exons 4 and 5 encoding the central region (M) that is common to all Olfm1 isoforms (Cheng et al., 2007). In this initial study, the only observed abnormality was that pancortin−/− pairs did not breed well (Cheng et al., 2007). More detailed analyzes of these mice conduced in this report demonstrated that pancortin −/− mice actually express a truncated form of Olfm1 protein. The homozygous mutant mice exhibit structural brain defects and behavioral abnormalities, which may be caused by changes in the protein binding pattern of Olfm1, leading to an elevation of intracellular Ca2+ and activation of the CaMKII and Ras-ERK pathways in the olfactory bulb and hippocampus.
Materials and methods
Animals
All experiments using animals were approved by the NEI Animal Care and Use Committee. Mice of either sex were used. Pancortin−/− knockout mice have been reported previously (Cheng et al., 2007).
Olfm1 antibodies
Three different antibodies against Olfm1 were used. A monoclonal antibody (#7.1) generated against synthetic peptides MRGLESKFKQVEESHKQHLARQ has been previously described (Cheng et al., 2007). The other monoclonal antibody (#5D4-F8-B3-D10) was generated against the peptides SRDARTKQLRQLLEKVQN by the Custom Antibody Production Service of the University of Virginia. Both monoclonal antibodies detect denatured protein on Western blot. A polyclonal antibody (#7148) generated against purified Olfm1 has been described previously (Nakaya et al., 2012). This antibody detected intact Olfm1 and was used for immunoprecipitation experiments.
Western blot and immunoprecipitation
Isolated tissues were homogenized in a lysis buffer (10 mM Tris-HCl, pH 7.5, 1 mM EDTA, 150 mM NaCl, 1% NP-40, 5 mM NaF, 0.5 mM sodium orthovanadate, 10% glycerol, 1 mM PMSF, 1 μg/ml aprotinin, 1 μg/ml leupeptin and 1 μg/ml pepstatin) by repeated pipetting for 20 min on ice. For detections of phosphorylated proteins, Halt phosphatase inhibitor mixture (Thermo Scientific) was also added to the lysis buffer. Following centrifugation, the soluble fraction was collected, 5-15 μg of extracted proteins were separated on a 10% SDS-PAGE gel (Invitrogen) and transferred to a PVDF membrane (Invitrogen). A membrane was incubated with anti-Olfm1 (monoclonal 1:2,000 dilution), anti-GluR1 (Synaptic Systems, 1:2,000 dilution), anti-GluR2 (Millipore, 1:2,000 dilution), anti-GluR3 (Synaptic Systems, 1:2,000 dilution), anti-GluR4 (Millipore, 1:2,000 dilution), or anti-Teneurin 4 (R&D Systems, 1:1,000 dilution), anti-phospho-ERK1/2 (Thr202/Tyr204, Cell Signaling, 1:1,000 dilution), anti-ERK1/2 (Cell Signaling, 1:1,000 dilution), anti-phospho-MEK1/2 (Ser217/221, Cell Signaling, 1:1,000 dilution), anti-phospho Akt (Ser473, Cell Signaling, 1:1,000 dilution), anti-Akt (Cell Signaling, 1:1,000 dilution), anti-phiospho-CaMKII (Thr286/287, Millipore, 1:1,000 dilution), or anti-phospho-CaMKII (Thr305, Millipore, 1:1,000 dilution) antibodies followed by incubation with anti-mouse or rabbit IgG antibody conjugated to horseradish peroxidase (HRP) (Amersham Biosciences, 1:10,000 dilution). The HRP signals were detected using a chemi-luminescence detection kit (SuperSignal Femto Dura Extended Duration Substrate, Pierce) and FluorChem M (Protein Simple). For co-immunoprecipitation, protein A agarose beads (Roche) were blocked with 0.05 % (w/v) bovine serum albumin (BSA, Sigma#A3059) for 1 h, incubated with 0.5 μg of anti-Olfm1, anti-GluR1, anti-GluR2, anti-GluR3, anti-GluR4, anti-Teneurin 4, anti-Kidins220 (Bioss), anti-Cav2.1 (Sigma), anti-Synaptophysin (Millipore), anti-Clip1 (Santa-Cruz Biotechnology), anti-USP19 (Bethyl Laboratories), anti-NR1 (Millipore) or anti-GRIK1 (Sigma) antibodies for 1 h, and washed with the lysis buffer. The cell lysate was incubated with unbound beads for 1 h to pre-clear the sample and with the antibody-bound beads overnight at 4°C on a rotator. The beads were precipitated and washed 5 times with lysis buffer. Bound proteins were analyzed by western blotting as described above.
Mouse behavioral tests
Wild-type, hetero- and homozygous Olfm1 mutant mice (2-12 month-old) were used for behavioral analysis. Animals of the same age were used for each behavioral test. General locomotive activity was measured in the open field test (Basta-Kaim et al., 2011). Mice were placed in the middle of an arena (44.5 × 44.5 cm) and the distance traveled was recorded by 15 infrared beams along the x and y axes during 10 min by Auto-Track software (Columbus Instruments, Opto-Varimex 4). Anxiety-like behavior was tested by placing mice in the arena described above that was divided into dark and light compartments (44.5 × 22 cm each) (Tenk et al., 2013). The compartments were connected by a small opening (10 × 10 cm). Mice were placed in the light compartment and their activity was monitored by infrared beams that recorded time spent in each compartment and the amount of entries into each compartment during the 10 min test. Coordinated motor activities were measured by a rotarod apparatus. Mice were put on a rod rotating at 4 rpm. The speed of rotation was gradually increased up to 40 rpm and the time until mice fall to the floor was measured. Each mouse was tested three times a day for three consecutive days. The motor activity was also measured on a balance beam. Each mouse was put on an end of 12 mm wide and 1 m long balance beam with 50 cm elevation from the floor. The other end of beam was attached to a dark box (20 × 20 × 20 cm) and the time for a mouse to finish walking along the beam to a dark box was measured. The test was repeated using a 6 mm wide beam. Each mouse was tested three times a day for two consecutive days.
Elevated plus maze tests were carried out as previously described (Lister, 1987; Park et.al., 2005) using the H10-35-EPM system (Coulbourn Instruments, PA). Mice were placed in the center area of the plus maze and their movements were monitored. Time spent on the open arms, on the closed arms, and in the center area was quantified. The anxiety of mice was also tested by marble burying behavior. Twenty green marbles were set on a 10 cm deep flake bedding in a clear mouse cage. A mouse was placed in the cage and kept for 20 min. At the end of the test, marbles with more than 2/3 of their surface area covered or completely hidden by the bedding were counted (Thomas et al., 2009). Two tests to assess socializing behaviors were performed. To assess the barbering behaviors, a pair of wild-type and Olfm1 mutant littermates was kept in a cage together for 6 months. The faces of mice were examined for signs of barbering such as plucked whiskers and trimmed hairs and scored by the level of trimming. The nesting behavior was tested according to a described protocol (Deacon, 2006). Briefly, each mouse was kept in a cage with the bedding and a pressed cotton square (Nestlet, 5 × 5 cm) overnight. The next morning the amount of prepared nest was scored as described in the protocol.
Olfactory sensitivity testing was performed as described (Witt et al., 2009). Mice were individually habituated to the experimental environment by keeping them sequentially in 3 clean empty cages for 15 min. Mice were then transferred to a test cage and a filter paper (5 × 5 cm) scented with either water or tested odorant was placed in a cage for 3 min. Mouse behavior was recorded using a digital video camera during a test period. Investigation time was measured in sec and defined as the time when the mouse's nares were < 1 mm from the filter paper.
Shotgun proteomics
Postnatal day 1 (P1) wild-type and Olfm1-mutant mouse brains were dissected and homogenized in a lysis buffer as described above. Affinity-purified anti Olfm1 antibody (10 μg) was cross-linked to protein A/G agarose beads using a crosslink IP kit (Pierce). Brain lysate was incubated with anti-Olfm1 beads or control rabbit IgG beads at 4°C overnight. The beads were washed 5 times with a lysis buffer and proteins bound to the beads were eluted with an elution buffer (60 μl) provided with the IP kit. Samples from three different animals in each group were combined and used for further analysis.
LC-MS/MS analysis was performed as a service by Bioproximity, LLC (Chantilly, VA). Eluted proteins were prepared for digestion using the filter-assisted sample preparation method. Briefly, the samples provided were incubated in a solution of 2% SDS, 50 mM Tris-HCl (pH 7.6) and 10 mM DTT at 95 C° for 10 min. Samples were then transferred to a 30 K Amicon MWCO device (Millipore) and centrifuged at 13,000 g for 30 min. The remaining samples were buffer exchanged with 6 M urea, 100 mM Tris-HCl, pH 7.6, then alkylated with 55 mM iodoacetamide. Concentrations were measured using a Qubit fluorometer (Invitrogen). Trypsin was added at a 1:40 enzyme to substrate ratio and the samples were incubated overnight on a heat block at 37 °C. Digested peptides were desalted using C18 stop-and-go extraction (STAGE) tips. Briefly, C18 STAGE tips were activated with methanol, and conditioned with 60% acetonitrile and 0.5% acetic acid followed by 5% acetonitrile and 0.5% acetic acid. Samples were loaded onto the tips and desalted with 0.5% acetic acid. Peptides were eluted with 60% acetonitrile and 0.5% acetic acid, and lyophilized in a SpeedVac (Thermo Savant) to dryness (approximately 2 h). Peptides were fractionated by strong anion exchange STAGE tip chromatography. Briefly, each sample was dissolved in Britton Robinson buffer pH 10 and loaded on to the STAGE tip. Flow-through was collected using a C18 STAGE tip. Subsequent fractions were taken by eluting peptides with Britton Robinson buffers at pH 8, 6, 5, 4 and 3.2 and capturing with C18 STAGE tips. Peptides were eluted from the C18 STAGE tip and dried as described above.
Each reaction mixture was analyzed by LC-MS/MS. LC was performed on an Easy nanoLC II HPLC system (Thermo). Mobile phase A was 94.5% MilliQ water, 5% acetonitrile, 0.5% acetic acid. Mobile phase B was 80% acetonitrile, 19.5% MilliQ water, 0.5% acetic acid. The 120 min LC gradient ran from 5% A to 35% B over 90 min, with the remaining time used for sample loading and column regeneration. Samples were loaded to a 2 cm × 100 μm I.D. trap column positioned on an actuated valve (Rheodyne). The column was 13 cm × 100 μm I.D. fused silica with a pulled tip emitter. Both trap and analytical columns were packed with 3.5 μm C18 resin (Zorbax SB, Agilent). The LC was interfaced to a dual pressure linear ion trap mass spectrometer (LTQ Velos, Thermo Fisher) via nano-electrospray ionization. An electrospray voltage of 1.8 kV was applied to a pre-column tee. The mass spectrometer was programmed to acquire, by data-dependent acquisition, tandem mass spectra from the top 15 ions in the full scan from 400 - 1400 m/z. Dynamic exclusion was set to 30 s.
Mass spectrometer RAW data files were converted to MGF format using msconvert. Detailed search parameters are printed in the search output XML files. Briefly, all searches required strict tryptic cleavage, 0 or 1 missed cleavages, fixed modification of cysteine alkylation, variable modification of methionine oxidation and expectation value scores of 0.01 or lower. MGF files were searched using X! Hunter (Craig et al., 2006) against the latest library available on the GPM2 at the time. Other searches used the cRAP contaminant library from the GPM and libraries constructed from the latest Ensembl release available at the time. MGF files were searched using X!! Tandem (Li et. al., 2010; (Bjornson et al., 2008) using both the native and k-score scoring. All searches were performed on Amazon Web Services-based cluster compute instances using the Proteome Cluster interface. XML output files were parsed and non-redundant protein sets determined using MassSieve. Proteins were required to have 2 or more unique peptides across the analyzed samples with E-value scores of 0.01 or less, 0.001 for X! Hunter and protein E-value scores of 0.0001 or less.
RT-PCR and quantitative RT-PCR (Q-PCR)
RNA was isolated from mouse brain using Trizol (Invitrogen) following the manufacture's protocol. RNA was dissolved in distilled water at concentrations of 0.1-0.3 μg/μl. Q-PCR was performed using 0.5 μg of total RNA as described previously (Hemish et al., 2003) using a 7900HT Real Time Thermocycler (Applied Biosystems). β-actin was used for normalization. RT-PCR was performed using the Superscript RT-PCR kit (Invitrogen). After reverse transcription, the products were PCR amplified for 35 cycles of 95°C for 30 sec, 56°C for 30 sec and 72°C for 1 min in a thermal cycler (MJ Research). The RT-PCR products were separated using 1% agarose gel electrophoresis.
Primers used for the PCR were as follows:
β-actin (FW): 5-cgtgaaaagatgacccagatca-3′
β-actin (RV): 5-cacagcctggatggctacgta-3′
Olfm1 exon 1 (FW): 5′-atgcaaccggcccggaagct-3′
Olfm1 exon 2 (FW): 5′-atgtcggtgccgctgctgaa-3′
Olfm1 exon 4 (FW): 5′-ggagaagatggagaaccagatga-3′
Olfm1 exon 4 (RV): 5′-tgcctggctagatgctgctt-3′
Olfm1 exon 6 (FW): 5′-gtcagtgcttaacgaactgcaaga-3′
Olfm1 exon 6 (RV): 5′-tggacactctgctctgaagttcat-3′
Olfm1 exon 8 (FW): 5′-aaccgcttcgtccgtgagta-3′
Olfm1 exon 8 (RV): 5′-ggagacggtgagaggtaaagttgt-3′
All Q-PCR reactions were performed in triplicates.
Magnetic resonance imaging (MRI) and manganese-enhanced MRI
Mouse heads were fixed with 4% PFA, wiped with a paper towel to minimize surface moisture, placed in a 13 mm inner diameter glass sample tube and submerged in Fomblin, a proton-free perfluorinated polycarbon oil, for magnetic susceptibility matching. The brain was centered in a 15 mm inner diameter transmit/receive radiofrequency coil in a vertical, 14 Tesla Bruker Avance scanner (Bruker Biospin, Inc.) for MRI. A three-dimensional volume encompassing the whole brain was specified using three orthogonal scout images. T1 weighted, 3-dimensional, gradient echo images of the whole brain were acquired (number of averages = 8, repetition time = 150 ms, echo time = 18 ms, flip angle = 200) to achieve an isotropic image resolution of 50 μm. Obtained images were imported into the ImageJ software with volume viewer plugin and three-dimensional images were constructed to investigate structures of brain regions in detail. Area sizes of target brain regions in every original image slice were measured and the volumes of region were calculated. In order to use Mn2+ MRI during neuronal tract tracing (Silva et al., 2004), 100 mM MnCl2 was administered to each nostril before MRI. Mice were anaesthetized with 1.5% isofluorane and placed prone in a stereotaxic holder with brain centered in a 72/25 mm volume transmit/surface receive coil ensemble. Body core temperature was maintained at 37° C with warm airflow over the mouse. A pressure transducer was used to monitor the respiration cycle. MR imaging was performed on a 21 cm horizontal bore 7 Tesla scanner operating on a Bruker Avance platform (Bruker Biospin Inc. Billerica. MA). Three mutually perpendicular slice images through the brain were acquired as scout images. Using these images, 3-Dimensional, T1 weighted images encompassing the brain were acquired using Modified Driven Equilibrium Fourier Transform pulse sequence (isotropic image resolution = 100 μm, echo time = 2.99 ms, repetition time = 2000 ms, 2 segments, Number of averages = 5, flip angle = 150, inversion delay = 650 ms). This sequence accentuated the hyper intensity due to Mn2+ uptake and transport by further suppressing the surrounding tissue. The inversion time was adjusted so that a low intensity outline of the brain anatomy was retained to facilitate visualizing the Mn2+ transport path. The intensity of manganese signals in the lateral olfactory tract (lot) and anterior commissure anterior part (ACa) were measured using the ImageJ software and the ratio to the originating olfactory bulb signals were calculated.
Ca2+ imaging
Tissue slices (200 μm thick) were obtained from P3 hippocampus and olfactory bulb. Each slice was treated with Fura-2/AM (10 μM, Invitrogen) for 1 hour at 37 °C. Fura-2/AM stock solution (5 mM) was prepared by mixing an equal volume of 10 mM Fura-2/AM and 20% pluronic F-127 (Invitrogen). The Fura-2-1oaded slice was placed in a chamber with a glass coverslip bottom containing 2 ml of Ca2+ imaging buffer (120 mM NaCl, 2.5 mM KCl, 2.5 mM CaCl2, 1.5 mM MgCl2, 15 mM glucose and 20 mM Hepes; pH 7.0). Fluorescence images from a Fura-2/AM-1oaded slice illuminated sequentially with 340 nm and 380 nm light were collected using an inverted fluorescence microscope (DM IRBE, LEICA) with a 20× objective lens, a digital camera and controller (OPCA-ER, Hamamatsu Photonics) and a filter wheel (Sutter Instruments). The intensities and the ratio (R) of 340 nm:380 nm fluorescence of cells at each time point were recorded and calculated using imaging software (SCI image, Hamamatsu Photonics). Resting fluorescence was recorded for about 20 sec, and then 50 μl of 4 mM AMPA and 10 μl of 200 mM glutamate were sequentially added to the chamber to final concentrations of 100 μM and 1 mM, respectively. Fluorescence signals were recorded for about 100 sec following the AMPA application. For some experiments, an inhibitor of AMPA receptors, 1,2,3,4-tetrahydro-6-nitro-2,3-dioxobenzo-qunioxaline-7-sulfonamide (NBQX, 100 μM, Sigma), was added for 10 min before AMPA application. In some experiments, olfactory bulb slices were preincubated at 37° C for 1 hr with or without 7 nM of purified Olfm1 before Fura-2 application. To calculate absolute calcium levels, cells with Fura-2/AM were incubated with ionomycin (1 μM) for maximum Ca2+ concentration and with EGTA-Tris (pH 8.3) for free Ca2+. The fluorescence at 380 nm in high and free Ca2+ gave the Fmax and Fmin, respectively. The 340:380 fluorescence ratio of cells in high calcium and calcium-free media gave the maximum Rmax and minimum Rmin fluorescence ratios, respectively. Absolute Ca2+ concentrations were then calculated using the following formula:[Ca2+]i=140 × (R-Rmin)/(Rmax-R) × Fmin/Fmax.
Statistical analysis
Data were analyzed using the unpaired Student's t test preceded by F test for variances.
Results
Expression of mutant form of Olfm1 leads to elevated neonatal death and body weight loss
Pancortin−/− mice have been produced by elimination of exon 4, which is common to all four forms of Olfm1, and exon 5, which is common to the AMY and BMY forms of Olfm1 (Fig. 1A). However, exon 4 in the Olfm1 gene is in-frame with exon 6 and its elimination produced stable mRNAs and proteins with a deletion in the central part. Indeed, RT-PCR analysis of Olfm1 mRNA from pancortin−/− mouse brain using primers located in exons 1 and 6 or in exon 2 and 6 confirmed the presence of truncated mRNAs without the region corresponding to exons 4 and 5 (Fig. 1B). Translation of these mRNAs produced a truncated Olfm1 protein with a deletion of 52 amino acids in the central part as demonstrated by Western blot analysis using an antibody directed against a peptide sequence in exon 3 (Fig. 1C). In these mice, the amount of mutant Olfm1 protein expressed in the brain was similar to that of wild-type Olfm1, while the level of mutant mRNA expression was half of wild-type Olfm1 mRNA as detected by quantitative RT-PCR (Q-PCR) (Fig. 1D). Since a modified Olfm1 protein with a deletion in the central part was produced in pancortin−/− mice, these mice will be called Olfm1 mutant mice throughout the manuscript.
Fig. 1.
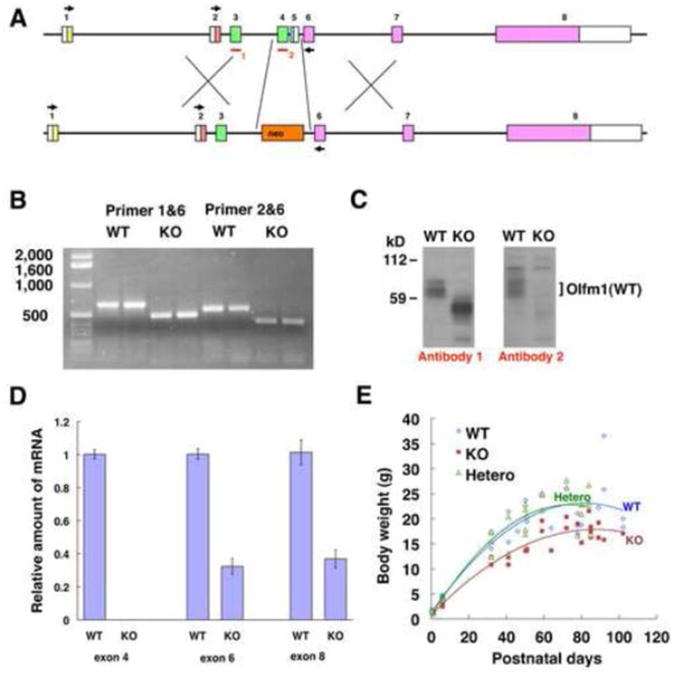
Mice expressing a mutated form of Olfm1 exhibit reduced body weight. A The gene targeting strategy of the mouse Olfm1 gene (modified from (Cheng et al., 2007)). The Olfm1 gene consists of 8 exons. Gene targeting eliminated exon 4 and 5. The monoclonal Olfm1 antibody #5D4-F8-B3-D10 (antibody 1, red bar) detects intact exon 3, while the monoclonal antibody #7.1 (antibody 2, red bar) detects a peptide sequence located in the eliminated exon 4. Black arrows indicate position of primers used for RT-PCR. B RT-PCR results for Olfm1 mRNA in wild-type and Olfm1-KO mouse brains. C Detection of the Olfm1 protein in the brain of wild-type and Olfm1-KO adult mice. Mouse brain lysates were analyzed using 2 different antibodies (antibody 1 and 2). D Relative amounts of Olfm1 mRNAs as judged by quantitative RT-PCR using primers against exon 4, 6 and 8 sequences. E Changes in body weight of wild-type, heterozygous Olfm1 mutant and homozygous Olfm1 mutant mice.
We generated 349 mice by crossing Olfm1 mutant heterozygous male and female mice. The exact numbers and percentage of mice that were born and survived until weaning at 3 weeks versus predicted numbers for each allele are shown in Table 1. The actual number of surviving Olfm1 mutant mice (62) was much lower than the predicted number (101). The number of surviving heterozygous animals was very close to the predicted number. Preliminary analysis of limited amount of embryos did not indicate a prenatal death of Olfm1 mutant embryos (not shown). These data suggest that a deletion of exon 4 and 5 in the Olfm1 gene increased the postnatal lethality of homozygous animals.
Table 1. Genotype of mice surviving until weaning at 3 weeks after mating heterozygous Olfm1 mutant animals.
Total number of mice that were expected to be born was calculated on the basis of actually born wild-type mice (101×4). Percentages of actually surviving mice of different phenotypes were calculated relatively to this number (404).
| Genotype | # Survived | # Expected | % Survived | % Expected | |
|---|---|---|---|---|---|
| Olfml | WT | 101 | 101 | 25.0 | 25 |
| Mut/WT | 186 | 202 | 46.0 | 50 | |
| Mut | 62 | 101 | 15.3 | 25 | |
| Total | 349 | 404 | 86.3 | 100 |
Newborn mice of different genotypes had similar body sizes and weights. Adult Olfm1 mutant mice were smaller than their wild-type and heterozygous littermates. Accordingly, 32-102 day-old Olfm1 mutant mice were lighter than their heterozygous and wild-type littermates (Fig. 1E). These differences in body weight between Olfm1 mutants and their wild-type littermates reached 67% for 90 day-old mice. Olfm1 mutant mice lived into adulthood if they survived during the neonatal period. These data show that the homozygous Olfm1 mutation leads to more severe phenotypic defects than those that were identified in a previous study (Cheng et al., 2007).
Reduction of brain volume and size of major axon bundles in Olfm1 mutant mice
To identify potential morphological changes in the neuronal tissues of the Olfm1 mutant compared with wild-type mice, we used MRI. By this way, the entire three dimensional structure of the brain could be easily evaluated. We examined brain structure of 9-12 week-old wild-type and Olfm1 mutant mice. The total brain volume of Olfm1 mutant mice was about 89.8 ± 1.8% of that of the wild-type littermates (Fig. 2A-A′, F). The size of anterior-posterior axis was significantly decreased, while the lateral axis exhibited only a slight decrease (Fig. 2A, A′). Hippocampal and olfactory bulb volumes of Olfm1 mutant mice were 81.9 ± 2.6 and 75.4 ± 5.6% of those of wild-type mice, respectively (Fig. 2B, B′, C, C′, F). The areas of major axon bundles, such as the corpus callosum, anterior commissure, and optic nerve, were also significantly reduced to 73.7 ± 4.8, 70.7 ± 6.3 and 76.9 ± 6.0% of control values, respectively, indicating that axonal numbers, size and/or myelination are disrupted in the Olfm1 mutant mouse brain. White matter reduction in Olfm1 mutant brains was most severe in the anterior part of the anterior commissure, which was thinner than in wild-type mice (5 out of 5 pairs analyzed) and in cases of the most severe phenotypes split into two or three bundles (3 out of 5 pairs analyzed) (Fig. 2E, E′). We hypothesized that the reduction of hippocampal and olfactory bulb volume and major axon bundles in the Olfm1 mutant could cause a behavior phenotype.
Fig. 2.
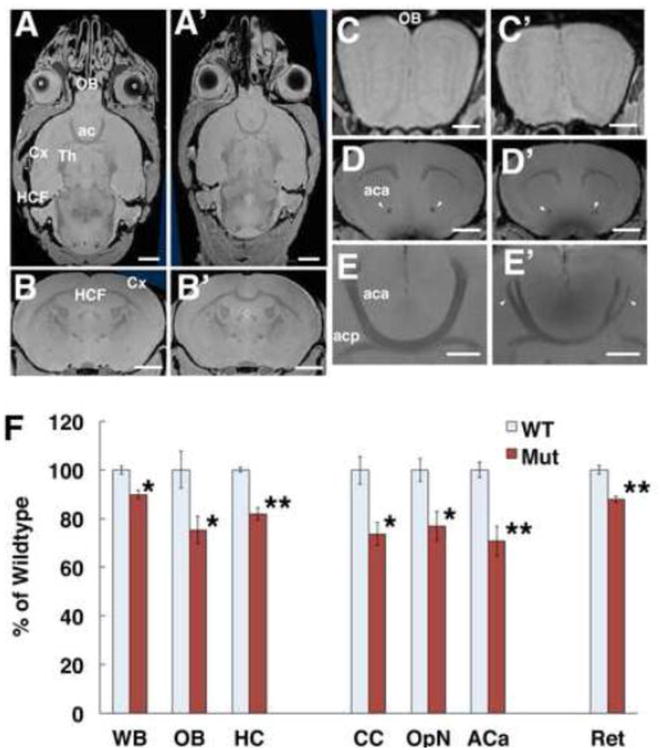
MRI images reveal prominent structural abnormalities in the brains of Olfm1 mutant mice. A-E Representative MRI images of forebrain of wild-type (left) and Olfm1 mutant (right) mice. A, A′ horizontal sections at the level of ACa. Scale bars; 2 mm. B, B′ coronal sections at the level of HC. Scale bars, 2 mm. C, C′ coronal sections of OB. Scale bars; 0.5 mm. D, D′ coronal sections at the level of anterior commissure. Scale bars, 2 mm. E, E′ horizontal section at the level of anterior commissure. Arrowheads indicate normal and defasciculated and thinned aca in wild-type and mutant mice, respectively. Ac, anterior commissure; aca, anterior commissure anterior part; acp, anterior commissure posterior part, Cx, cortex; e, eye; HCF, hippocampal formation; OB, olfactory bulb; Th, thalamus. Scale bars, 1 mm. F Decreased volume of neuronal structures in Olfm1 mutant mice. Four pairs of adult wild-type (WT) and Olfm1 mutant (Mut) mouse littermates were fixed and analyzed by MRI. The data represent percent ratio of each brain region in mutant mice to their wild-type littermates. Values are means ± SEM. ACa, anterior commissure anterior part; CC, corpus callosum; HC, hippocampus; OB, olfactory bulb; OpN, optic nerves; Ret, retina; WB, whole brain. *p<0.05; **p<0.01.
Behavioral phenotype of Olfm1 mutant mice
We performed several behavioral tests using adult wild-type and Olfm1 mutant mice. Olfm1 mutant mice were less active than their wild-type littermates in the open field test (Fig. 3A). However, when mice were tested for motor coordination using a rotarod test, Olfm1 mutant mice did not exhibit any abnormality of locomotor activity compared with wild-type littermates (Fig. 3B). Similarly, Olfm1 mutant mice did not exhibit a deficit in the balance beam test, and even traversed the beam faster than their wild-type littermates on the 12 mm and 6 mm beams (Fig. 3C). These results suggested that Olfm1 mutant mice do not have any defects in coordination of locomotive activity.
Fig. 3.
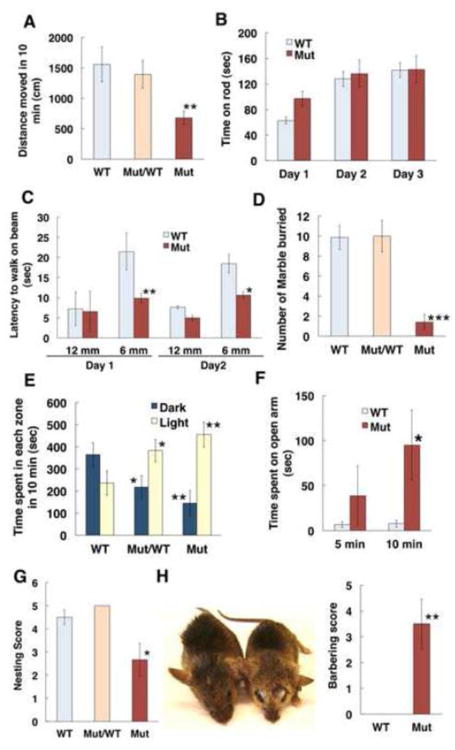
Olfm1 mutant mice exhibit locomotor and anxiety-related behavioral abnormalities. A Average distance traveled in 10 minutes by WT (n=female 12/male 9), Olfm1 heterozygous (n= female 10/male 15) and homozygous (n= female 12/male 12) mutant mice in open field tests. B Average time during which wild-type (n=6) and Olfm1 mutant (n=6) littermates stayed on the rotating rod. The test was repeated for three consecutive days. C Average time required to walk across 12 and 6 mm wide balance beams for wild-type (n=6) and Olfm1 mutant (n=6) littermates. The test was repeated for two consecutive days. D The average number of marbles buried by wild-type (n= female 9/male 6), Olfm1 heterozygous (n= female 7/male 5) and homozygous (n= female 7/male 8) mutant mice in 20 min. E Light-dark compartment test. Time spent in the light and dark compartments as well as the amount of entries into the light and dark compartments during 10 min are shown. Only mice that moved more than 300 cm in the open field test were selected for this test. N= female 12/male 7, female 10/male 11 and female 9/male 8 for wild-type, Olfm1 heterozygous and homozygous mutants, respectively. F Elevated plus maze test. Time spent on the open arms was measured for 5 and 10 minutes. N=6 for each group. G Nesting test. Each mouse was kept in a new cage with Nestlet overnight. The unpacked Nestlet was collected and quantified the next morning. N=7 for each group. H Barbering test. 6 pairs of wild-type and Olfm1 mutant littermates were kept in the same cage for 6 months. Hair removal on the head was scored as described in Materials and methods. Values are means ± SEM. (*p < 0.05; **p < 0.01; ***p<0.001).
We next determined whether Olfm1 mutant mice have abnormal anxiety or fear behavior compared to wild-type mice. Anxiety behavior was analyzed using the marble-burying test. This test showed a dramatic difference between Olfm1 mutant and wild-type mice (Fig. 3D). Wild-type and Olfm1 mutant heterozygous mice actively dug cage bedding and on average buried 10 out of 20 marbles during a 20 min test period, while Olfm1 mutant mice buried on average only 1 out of 20 marbles. Abnormal anxiety behavior of Olfm1 mutant mice was also confirmed in the light-dark compartment test. Olfm1 mutant and Olfm1 mutant heterozygous mice stayed in a light compartment longer than in a dark compartment, while wild-type mice spent more time in a dark compartment compared with a light compartment (Fig. 3E). The number of entries to the other compartment was also reduced in Olfm1 mutant mice, although the difference was not statistically significant. The anxiety of Olfm1 mutant mice was also tested in an elevated plus maze (Fig. 3F). The mutant mice spent more time on the open arms of the maze than wild-type mice that indicated reduced anxiety. In addition, Olfm1 mutant mice demonstrated problems with socialization compared with their wild-type littermates as judged by the nesting and barbering behaviors. Olfm1 mutant mice exhibited significantly reduced nesting behavior compared with with-type and Olfm1 heterozygous mice (Fig. 3G). When Olfm1 mutant and wild-type littermates were kept in the same cage, Olfm1 mutants often obtained strong barbering from wild-type cage mates (Fig. 3H). These results suggest that wild-type mice dominate Olfm1 mutant mice. Larger size of wild-type mice as compared with Olfm1 mutant mice may contribute to this behavioral phenotype. We concluded that Olfm1 mutant mice indeed have abnormal anxiety behavior and social activity.
Defects in the olfactory functions of Olfm1 mutant mice
Reduced volume of the olfactory bulbs in Olfm1 mutant mice compared with wild-type littermates suggested that functional defects in olfaction may also exist. Therefore, we examined the olfactory functions of Olfm1 mutant mice and their wild-type littermates by a simple smell test and by checking the neuronal activity of the olfactory bulb using manganese-enhanced functional MRI analysis. Olfm1 mutant and wild-type mice demonstrated differences with three odorants (peanut butter, urine and cage wipe) used in a smell test, while Olfm1 heterozygous mutant and wild-type mice demonstrated a difference only with the cage wipe (Fig. 4D). In manganese-enhanced MRI, Mn2+ is transported in an anterograde direction and across synapses when administered to specific regions of the brain thus allowing non-invasive tracing of brain connections with MRI (Pautler et al., 1998; Watanabe et al., 2001) and yielding a high degree of anatomical detail (Watanabe et al., 2002; Aoki et al., 2004) as Mn2+ accumulates differentially in sub-regions of different tissues leading to MRI contrast. An increase in the intensity of manganese signal absorbed from the olfactory epithelium was clearly detected in the brain from the olfactory bulb to the lateral olfactory tract (arrows in Fig. 4A, B), anterior olfactory nucleus and anterior commissure (arrowheads) through a time course lasting over 12 h in live adult wild-type animals. In the Olfm1 mutant mouse brains, there was a similar increase of the manganese signal over time, but the transport rate from olfactory bulb to lateral olfactory tract and anterior commissure was slower than in wild-type brain (Fig. 4A). The ratio of manganese signal between olfactory bulb and lateral olfactory tract or anterior commissure were significantly lower in Olfm1 mutant brain, indicating that manganese transport is reduced in the mutant brain (Fig. 4C).
Fig. 4.
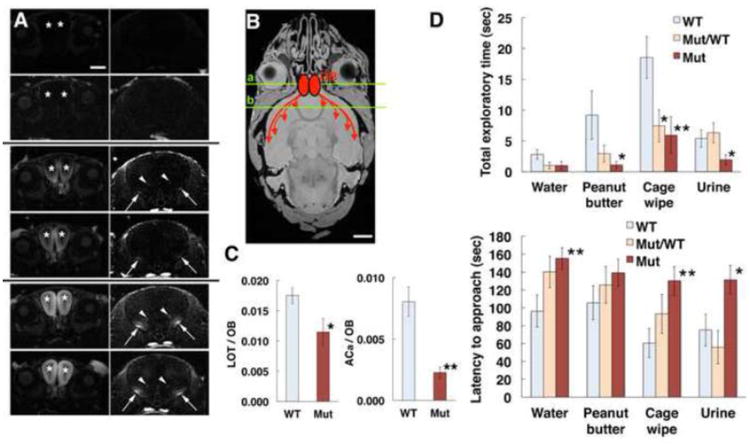
Evidence that olfactory activity is altered in Olfm1 mutant mice. A Olfactory activities in wild-type and Olfm1 mutant mouse brain measured by manganese-enhanced MRI. Images taken at 0 (top 4 panels), 5 (middle 4 panels) and 12 hours (bottom 4 panels) after an injection of MnCl2 solution into the nasal cavity show the uptake and transport of Mn2+ to the olfactory bulb (OB, asterisks), lateral olfactory tract (LOT, arrows) and anterior commissure anterior part (ACa, arrowheads). Two upper images at each time point represent wild-type sections, while two lower images represent Olfm1 mutant sections. Left and right panels represent coronal sections at the level of OB and ACa shown by green lines a and b in panel B, respectively. Scale bar, 0.5 mm. B An image showing the course of manganese transport from OB to LOT and ACa. Scale bar, 2 mm. C The graphs show data for Mn2+ signals in each LOT and ACa at 5 h normalized to the Mn2+ signal in OB. D Olfactory behavioral test using wild-type (WT), Olfm1 heterozygous (Mut/WT) and homozygous (Mut) mice. The latency to approach a piece of paper with a presented odor (lower graph) and the time sniffing the paper (upper graph) were measured.
Shotgun analysis of proteins interacting with wild-type and mutant Olfm1
To gain better insight into the molecular mechanisms underlying Olfm1 actions, we performed shotgun proteomic analysis of proteins that co-immunoprecipitated with Olfm1. Our previous results demonstrated that Olfm1 is highly expressed in several regions of newborn mouse brain including olfactory bulb, thalamus and medulla oblongata. We also showed that elimination of the central region in the N-terminal part of Olfm1 reduces its binding to NgR1 (Nakaya et al., 2012). Therefore, we used lysates of freshly dissected brain of wild-type or Olfm1 mutant P1 mice for co-immunoprecipitation experiments. Anti-Olfm1 antibodies cross-linked to protein A/G beads were used for immunoprecipitation as described in Materials and methods. As an additional control, wild-type P1 brain lysates were immunoprecipitated with normal rabbit IgG cross-linked to protein A/G beads. Immunoprecipitates were eluted from the beads and analyzed by SDS-PAGE followed by silver staining of the gel or Western blotting with anti-Olfm1 antibodies. More than 50 bands were detected in immunoprecipitates by silver staining. In general, the staining pattern was very similar in all samples but several bands in the high molecular weight region were observed only in the samples precipitated with anti-Olfm1 antibody from both wild-type and Olfm1 mutant brains but not in the sample precipitated with normal IgG (Fig. 5A). There was no visible difference between samples from wild-type and Olfm1 mutant brains. Wild-type and Olfm1 mutant bands were not clearly seen after staining most probably because of poor silver staining of the highly glycosylated Olfm1 protein. However, both wild-type and mutant Olfm1 were clearly detected in immunoprecipitates by Western blotting with anti-Olfm1 antibodies but not with control IgG (Fig. 5B). The quantification of Olfm1 bands using different concentrations of purified Olfm1 as a standard showed that nanogram amounts of Olfm1 were present in immunoprecipitates. The precipitated protein mixtures were analyzed by shotgun proteomics analysis. About 700 proteins were identified in these mixtures, of which 59 bound to wild-type or mutant Olfm1 proteins in P1 mouse brain (Table 2, Fig. 6A). Among them, 19 proteins were preferentially bound to wild-type Olfm1, 20 proteins were preferentially bound to the Olfm1 mutant, and 20 proteins were bound to both wild-type and mutant Olfm1.
Fig. 5.
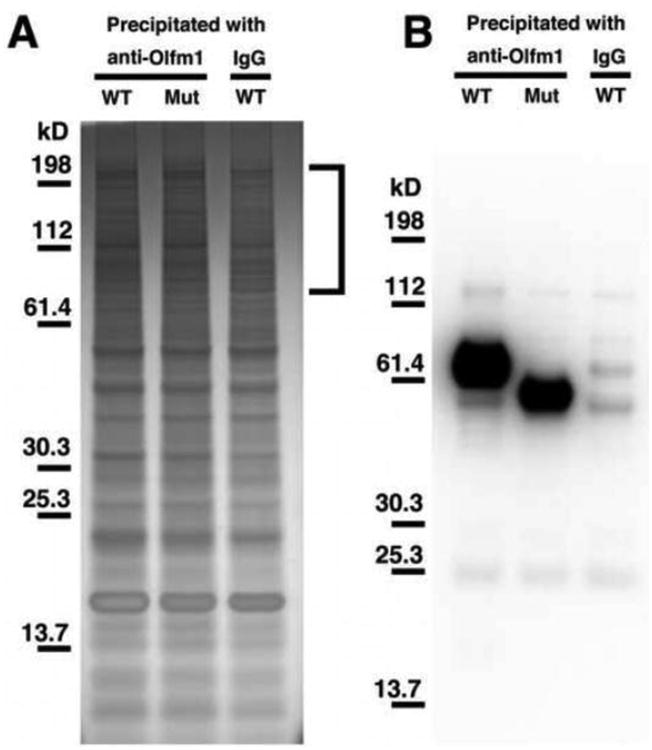
Precipitation of proteins from P1 mouse brain with antibodies against Olfm1. A SDS-PAGE analysis of immunoprecipitates obtained from lysates of wild-type (WT) and Olfm1 mutant (Mut) P1 brains. Affinity purified antibodies against Olfm1 or rabbit IgG were used for immunoprecipitation. Gels were stained with silver stain. Brackets mark the regions of the gel that are different between samples precipitated with Olfm1 antibodies and IgG. B Western blot analysis of samples as in (A) with antibodies against Olfm1.
Table 2. Proteins precipitated with Olfm1 antibodies from lysates of wild-type of Olfm1 mutant P1 brains.
Peptide count and relative abundance of proteins identified by LC-MS/MS are shown. The columns in the spreadsheet accompanying this document are:
Protein Name, the unique protein identifier, usually in the Ensembl or Uniprot format; Associated Gene Name, the name of the gene associated with the protein identifier; Description, a description of the protein identifier; PepHits, the number of confident sequencing events to peptides associated with the listed protein identifier in the sample. This value closely correlates with relative protein abundance and is the basis for quantitation by the spectral counting and derivative methods; log2(Sample#1/Sample#2), Relative fold difference between peptide hits of two samples calculated by LOG2((1+Sample#1)/(1+Sample#2)).
| Protein Name | Associated Gene | Name | Description | WT PepHits | IgG PepH its | Mut PepHits | log2(WT/Mut) | log2(WT/l gG) | log2(Mut/lgG) |
|---|---|---|---|---|---|---|---|---|---|
| E N S M U SP00000006 854 | Uspl9 | ubiquitin specific peptidase 19 | 21 | 0 | 0 | 4.5 | 4.5 | 0.0 | |
| ENSMUSP00000060985 | Olfm3 | olfactomedin 3 | 15 | 0 | 0 | 4.0 | 4.0 | 0.0 | |
| ENSMUSP00000034692 | Olfm2 | olfactomedin 2 | 14 | 0 | 0 | 3.9 | 3.9 | 0.0 | |
| ENSMUSP00000122064 | Clipl | CAP-GLY domain containing linker protein 1 | 11 | 0 | 0 | 3.6 | 3.6 | 0.0 | |
| ENSMUSP00000093965 | Gana b | alpha glucosidase 2 alpha neutral subunit | 8 | 0 | 0 | 3.2 | 3.2 | 0.0 | |
| ENSMUSP00000074787 | Gria2 | glutamate receptor, ionotropic, AMPA2 (alpha 2) | 6 | 0 | 0 | 2.8 | 2.8 | 0.0 | |
| ENSMUSP00000030791 | Smarc d3 | SWI/SNF related, matrix associated, actin dependent regulatoro | 5 | 0 | 0 | 2.6 | 2.6 | 0.0 | |
| ENSMUS P00000043508 | 5 | 0 | 0 | 2.6 | 2.6 | 0.0 | |||
| ENSMUSP00000123588 | Brwd 3 | bromodo main and WD repeat domain containing 3 | 4 | 0 | 0 | 2.3 | 2.3 | 0.0 | |
| ENSMUSP00000042852 | Tmem 33 | transmembrane protein 33 | 4 | 0 | 0 | 2.3 | 2.3 | 0.0 | |
| ENSMUSP00000026547 | Tubgc p2 | tubulin, gamma complex associated protein 2 | 4 | 0 | 0 | 2.3 | 2.3 | 0.0 | |
| ENSMUSP00000021803 | Nupl5 3 | nucleoporin 153 | 4 | 0 | 0 | 2.3 | 2.3 | 0.0 | |
| ENSMUSP00000039351 | Cacna la | calcium channel, voltage-dependent, P/Qtype, alpha 1A subunit | 3 | 0 | 0 | 2.0 | 2.0 | 0.0 | |
| ENSMUSP00000104816 | Dpml | dolichol-phosphate (beta-D) mannosyl transferase 1 | 3 | 0 | 0 | 2.0 | 2.0 | 0.0 | |
| ENSMUSP00000040307 | Map3 k7 | mitogen-activated protein kinase kinase kinase 7 | 3 | 0 | 0 | 2.0 | 2.0 | 0.0 | |
| ENSMUSP00000083341 | Nfrkb | nuclear factor related to kappa B binding protein | 3 | 0 | 0 | 2.0 | 2.0 | 0.0 | |
| ENSMUSP00000018333 | Uchl5 | ubiquitin carboxyl-terminal esterase L5 | 3 | 0 | 0 | 2.0 | 2.0 | 0.0 | |
| ENSMUSP00000010349 | 3 | 0 | 0 | 2.0 | 2.0 | 0.0 | |||
| ENSMUSP00000032172 | Chch d6 | coiled-coil-helix-coiled-coil-helix domain containing 6 | 2 | 0 | 0 | 1.6 | 1.6 | 0.0 | |
| Proteins coprecipitated with wildtype and mutant Olfml | |||||||||
| Protein Name | Associated Gene Name | Description | WT IgG Mut | ||||||
| PepHits PepHits PepHits log2(WT/Mut) log2(WT/lgG) log2(Mut/lgG) | |||||||||
| ENSMUSP00000109553 | Olfml | olfactomedin 1 | 180 | 10 | 91 | 1.0 | 4.0 | 3.1 | |
| ENSMUSP00000058525 | Odz4 | Teneurin-4 | 23 | 0 | 32 | -0.5 | 4.6 | 5.0 | |
| ENSMUSP00000022842 | Cct5 | chaperoni n containing Tcpl, subunit 5 | 20 | 0 | 18 | 0.1 | 4.4 | 4.2 | |
| ENSMUSP00000063999 | Kidin s220 | kinase D-interacting substrate 220 | 13 | 0 | 18 | -0.4 | 3.8 | 4.2 | |
| ENSMUSP00000120976 | Hadh a | hydroxyacyl-Coenzyme Adehydrogenase/3-ketoacyl-Coenzyme | i 10 | 0 | 4 | 1.1 | 3.5 | 2.3 | |
| ENSMUSP00000029803 | Eif4e | eukaryotic translation initiation factor 4E | 8 | 0 | 8 | 0.0 | 3.2 | 3.2 | |
| ENSMUSP00000029082 | Psma 7 | proteasome (prosome, macropain) subunit, alpha type 7 | 8 | 0 | 2 | 1.6 | 3.2 | 1.6 | |
| ENSMUSP00000004554 | Rps5 | ribosomal protein S5 | 7 | 0 | 8 | -0.2 | 3.0 | 3.2 | |
| ENSMUSP00000029686 | Hcn3 | hyperpolarization-activated, cyclic nucleotide-gated K+ 3 | 6 | 0 | 4 | 0.5 | 2.8 | 2.3 | |
| ENSMUSP00000041282 | Map2 k4 | mitogen-activated protein kinase kinase 4 | 5 | 0 | 6 | -0.2 | 2.6 | 2.8 | |
| ENSMUS P00000032143 | Rpnl | ribophorin 1 | 5 | 0 | 4 | 0.3 | 2.6 | 2.3 | |
| ENSMUSP00000046016 | Rps27l | ribosomal protein S27-like | 5 | 0 | 4 | 0.3 | 2.6 | 2.3 | |
| ENSMUSP00000022391 | Ktnl | kinectin 1 | 4 | 0 | 10 | -1.1 | 2.3 | 3.5 | |
| ENSMUSP00000033 484 | Syp | synaptophysin | 4 | 0 | 4 | 0.0 | 2.3 | 2.3 | |
| ENSMUSP00000007236 | Syngr 3 | synaptogyrin 3 | 4 | 0 | 3 | 0.3 | 2.3 | 2.0 | |
| ENSMUSP00000042967 | Ndufv l | NADH dehydrogenase (ubiquinone) flavoprotein 1 | 4 | 0 | 3 | 0.3 | 2.3 | 2.0 | |
| ENSMUSP00000024897 | Vapa | vesicle-associated membrane protein, associate d protein A | 4 | 0 | 2 | 0.7 | 2.3 | 1.6 | |
| ENSMUSP00000003912 | Calr | calreticulin | 3 | 0 | 6 | -0.8 | 2.0 | 2.8 | |
| ENSMUSP00000086783 | Triob p | TRIO and F-actin binding protein | 3 | 0 | 5 | -0.6 | 2.0 | 2.6 | |
| ENSMUSP00000031229 | Rufy3 | RUN and FYVE domain containing 3 | 3 | 0 | 4 | -0.3 | 2.0 | 2.3 | |
| ENSMUSP00000032729 | Tjpl | tight junction protein 1 | 3 | 0 | 4 | -0.3 | 2.0 | 2.3 | |
| Proteins coprecipit ated only with mutant Olfml | |||||||||
| Protein Name | Associated Gene Name | Description | WTIgG Mut | ||||||
| PepHits PepHits PepHits log2(WT/Mut) log2(WT/lgG) log2(Mut/lgG) | |||||||||
| ENSMUSP00000072840 | Sh3kb pl | SH3-domain kinase binding protein 1 | 1 | 2 | 28 | -3.9 | -0.6 | 3.3 | |
| ENSMUSP00000001989 | Ubal | ubiquitin -like modifier activating enzyme 1 | 1 | 0 | 8 | -2.2 | 1.0 | 3.2 | |
| ENSMUSP00000016639 | 50334 14D02 Ri | RIKEN cDNA 5033414D 02 gene | 8 | 5 | 50 | -2.5 | 0.6 | 3.1 | |
| ENSMUSP00000020947 | Rdhl4 | retinol dehydrogenase 14 (all-trans and 9-cis) | 0 | 0 | 5 | -2.6 | 0.0 | 2.6 | |
| ENSMUSP00000029424 | Pdcdl O | programmed cell death 10 | 0 | 0 | 5 | -2.6 | 0.0 | 2.6 | |
| ENSMUSP00000028102 | Kif5c | kinesin family member 5C | 1 | 1 | 10 | -2.5 | 0.0 | 2.5 | |
| ENSMUS P00000026841 | Hadh b | hydroxya cyl-Coenzyme Adehydrog enase/3-ketoacyl-Coenzymei 0 | 0 | 4 | -2.3 | 0.0 | 2.3 | ||
| ENSMUSP00000035158 | Trf | transferrin | 0 | 0 | 4 | -2.3 | 0.0 | 2.3 | |
| ENSMUSP00000048422 | Lphnl | latrophilin 1 | 0 | 0 | 4 | -2.3 | 0.0 | 2.3 | |
| ENSMUSP00000083722 | Rpl31 | ribosomal protein L31 | 0 | 0 | 4 | -2.3 | 0.0 | 2.3 | |
| ENSMUSP00000096775 | Kif5a | kinesin family member 5A | 0 | 0 | 4 | -2.3 | 0.0 | 2.3 | |
| ENSMUSP00000005234 | Wdrl | WD repeat domain 1 | 0 | 1 | 9 | -3.3 | -1.0 | 2.3 | |
| ENSMUSP00000029490 | Ahcyll | S-adenosyl homocysteine hydrolase-like 1 | 0 | 0 | 3 | -2.0 | 0.0 | 2.0 | |
| ENSMUSP00000036053 | Trim46 | tripartite motif-containing 46 | 0 | 0 | 3 | -2.0 | 0.0 | 2.0 | |
| ENSMUSP00000045036 | Myof | myoferlin | 0 | 0 | 3 | -2.0 | 0.0 | 2.0 | |
| ENSMUSP00000072620 | Eno3 | enolase 3, beta muscle | 0 | 0 | 3 | -2.0 | 0.0 | 2.0 | |
| ENSMUSP00000078266 | Csnkl e | casein kinase 1, epsilon | 0 | 0 | 3 | -2.0 | 0.0 | 2.0 | |
| ENSMUSP00000018274 | Csnkl d | casein kinase 1, delta | 0 | 0 | 2 | -1.6 | 0.0 | 1.6 | |
| ENSMUSP00000026328 | Prd×4 | peroxired oxin 4 | 0 | 0 | 2 | -1.6 | 0.0 | 1.6 | |
| ENSMUSP00000029 446 | Csdel | cold shock Domain containing El, RNA binding | 0 | 0 | 2 | -1.6 | 0.0 | 1.6 |
Fig. 6.
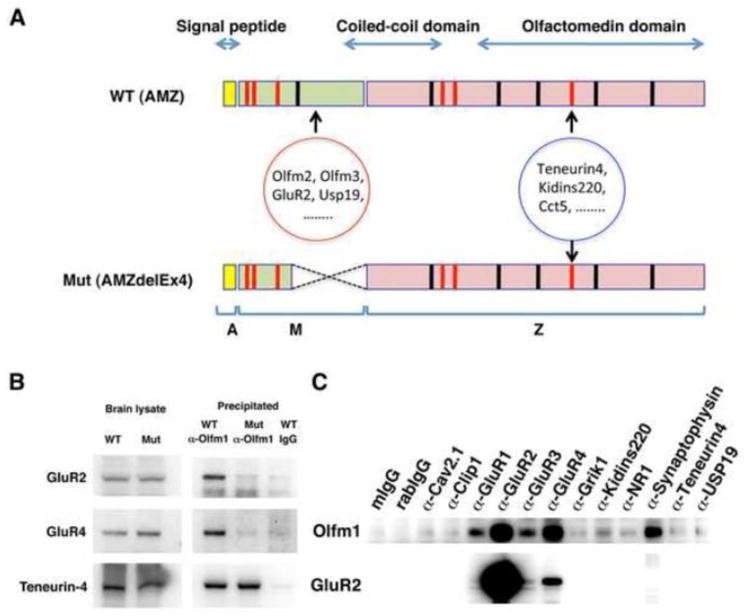
Multiple proteins involved in synaptic plasticity co-immunoprecipitate with Olfm1. A Diagram showing regions in the Olfm1 protein that may be responsible for interaction with some proteins detected by the shotgun analysis and shown in Table 2. The Olfm1 protein consists of the N-terminal part that includes a signal peptide (yellow), the central M part (green) and the Z part that includes coiled-coil region and olfactomedin domain (pink). Red and black lines represent cysteine residues and N-glycosylation sites, respectively. The mutant protein lacking a part of the M domain represents the form expressed in Olfm1 mutant mice. Binding site of 19 proteins that were co-precipitated only from wild- type brain lysate may include the M-domain of Olfm1, while other proteins that were co-precipitated from both wild-type and/or Olfm1 mutant brain lysates may bind to other part of Olfm1 including olfactomedin domain. B Co-immunopreciptation of GluR2, GluR4 and Teneurin-4 with Olfm1. Protein complexes were precipitated from wild-type and Olfm1 mutant P1 mouse brain lysates with anti-Olfm1 antibody and analyzed by Western blot using indicated antibodies. Precipitation from wild-type brain lysate with normal rabbit IgG was used as a negative control. C Co-immunoprecipitation of Olfm1 with selected proteins. Protein complexes were precipitated with antibodies against indicated proteins and analyzed by Western blot using antibodies against Olfm1. The filter was stripped and used for staining with antibodies against GluR2 to demonstrate that GluR2 is not precipitated with proteins other than GluR1-R4 (lower panel). Precipitation from wild-type brain lysate with normal mouse and rabbit IgG was used as a negative control.
Interaction of Olfm1 with several selected proteins essential for functioning of neuronal tissues and with distribution in the neuronal tissues that overlaps with Olfm1 was confirmed by co-immunoprecipitation from P1 brain lysates. In accordance with the shotgun results, the GluR2 AMPAR subunit co-immunoprecipitated with wild-type but not with mutant Olfm1, while teneurin-4 co-immunoprecipitated with both wild-type and mutant Olfm1 (Fig. 6B). Interactions of Olfm1 and several proteins detected in the shotgun analysis were also confirmed by inverse co-immunoprecipitation with antibodies against these proteins: Kidins220, voltage-gated calcium channel Cav2.1/Cacna1a, Synaptophysin, Clip1 and USP19. Several other ionotropic glutamate receptors includinig GluR1, GluR3, GluR4, NR1 and GRIK1 were also co-immunoprecipitated with Olfm1, although these were not identified by our shotgun analysis most probably because of insufficient sensitivity of detection (Fig. 6C).
On the basis of shotgun and Western blot results we concluded that Olfm1 may be involved in multiple protein-protein interactions and that a deletion in the central part of Olfm1 may disrupt some of these interactions or lead to interaction with new partners. Differences in the interaction pattern of wild-type and mutant Olfm1 with multiple protein partners may lead to changes in downstream signaling and modify the resultant global gene expression pattern.
Evidence that Olfm1 regulates calcium responses and AMPA receptor function in brain cells
Results from shotgun proteomics indicate that Olfm1 may affect synaptic components including AMPA receptors and voltage-dependent Ca2+ channels. If Olfm1 modulates the synaptic transmission through AMPA receptors and other ion channels, this may explain, at least partially, some structural and behavioral defects observed in Olfm1 mutant mice. We tested the AMPA receptor activity by measuring Ca2+ responses in the hippocampus and olfactory bulb of 2 month-old wild-type and Olfm1 mutant mice. The calcium responses to AMPA were recorded in hippocampus and olfactory bulb slices loaded with the calcium indicator Fura-2. The intracellular Ca2+ concentration ([Ca2+]i) in wild-type hippocampus was 28.8±1.7 nM before the addition of AMPA and increased to 158.9±9.1 nM (5.5 fold) after 100 μM AMPA addition (Table 3). In Olfm1 mutant hippocampus, the resting [Ca2+]i increased to 70.9±4.3 nM. An addition of AMPA to the Olfm1 mutant hippocampus increased the [Ca2+]i to 219.1±14.0 nM (3.1 fold). Intracellular Ca2+ concentrations in hippocampus slices from heterozygous mice were very close to the ones from wild-type littermates indicating that one copy of the Olfm1 gene was sufficient to rescue the observed effects (Table 3). Similar results were obtained with olfactory bulb slices (Table 3). When glutamate was added to the olfactory bulb and hippocampus slices from wild-type or Olfm1 mutant mice after AMPA response reached maximum level, [Ca2+]i further increased. To assess whether the elevated Ca2+ level in Olfm1 mutant mouse brain was caused by the absence of Olfm1 protein, the slices of olfactory bulb from Olfm1 mutant mice were preincubated at 37°C for 1 hr with or without purified Olfm1 (7 nM) before measuring Ca2+ level. Such preincubation led to slight decrease in Ca2+ levels compared with non-preincubated samples even in the absence of Olfm1, but the observed differences were to statically significant (Table 3). Preincubation with Olfm1 reduced Ca2+ levels to the levels observed in wild-type samples (Table 3). This suggests that the Olfm1 protein is essential for a stabilization of the intracellular Ca2+ concentration in brain tissues. In summary, these data indicate that the Olfm1 mutant mice have functional AMPA receptors, although the neuronal cells in the Olfm1 mutant have increased resting [Ca2+]i and reach a greater [Ca2+]i after exposure to AMPA compared to neurons in wild-type mice.
Table 3.
Intracellular calcium concentrations in hippocampal and olfactory bulb slices of P3 wild-type and Olfm1 heterozygous and mutant mice. HPC CA3 IN, the hippocampal CA3 region interneurons; OB IPL-IN, olfactory bulb inner plexiform layer.
Measurements were made before and after 100 μM AMPA treatment. The last two lines show data for olfactory bulb slices that were preincubated at 37°C for 1 hr with or without 7 nM purified Olfm1 before the measurements. Data represent mean ± SEM (nM).
| [Ca2+]i resting | [Ca2+]i after AMPA lOOuM | Fold change | ||
|---|---|---|---|---|
| HPCCA3IN | WT | 28.8±17 | 158.9±91 | 5.52 |
| Mut | 70.9±4.3** | 219.1±14.0** | 3.09 | |
| WT/Mut | 34.2±49 | 149.9149.4 | 4.38 | |
| OB IPL-IN | WT | 42.2±53 | 216.9116.1 | 5.14 |
| Mut | 72.9±9.3** | 407.8131.8** | 5.59 | |
| WT/Mut | 47.2±26 | 189.3136.0 | 4.01 | |
| Mut | 65.6±62 | 397.11141.0 | 6.05 | |
| Mut+Olfml | 43.2±23** | 189.1117.6 | 4.37 |
p < 0.01. N = 130 (wild-type HPC, n = 102 (mutant HPC), n = 33 (wild-type OB), and n = 53 (mutant OB).
Hyperactivation of the CAMKII and RAS-ERK pathways in Olfm1 mutant brain
Elevated levels of [Ca2+]i may lead to the activation of Ca2+/calmodulin-dependent kinase II (CAMKII) and Ras-dependent ERK signaling pathways (Thomas and Huganir, 2004). We compared the activation of CAMKII and several proteins acting in ERK signaling in the hippocampus and olfactory bulb from adult wild-type and Olfm1 mutant mice (Figure 8). Active forms of ERK1/2, MEK1 and CaMKII were markedly elevated in these brain regions in the Olfm1 mutants as compared with wild-type littermates. The elevated ERK1/2 activity was also observed in postnatal Olfm1 mutant olfactory bulb although there was no increase in the activity in hippocampus at this stage.
Fig. 8.

Evidence that MAP kinase signaling is hyperactivated in Olfm1 mutant mouse brain. A Western blot analysis of ERK1/2, CaMKII and MEK kinase in 7 week-old Olfm1 mutant mouse hippocampus and olfactory bulb as compared with wild-type littermates. B Quantification of the results shown in (A). The data represents the mean ± SEM from three independent pairs of wild-type and mutant mouse littermates. *p < 0.05; **p < 0.01. C Schema representing hypothetical mechanism of the synaptic functional regulation by Olfm1. Olfm1 secreted from presynaptic or postsynaptic compartments interacts with postsynaptic membrane proteins such as the AMPA receptors and voltage-dependent Ca2+ channels. This interaction may negatively regulate Ca2+ influx. The Olfm1 mutation or knockdown disrupts the regulation of Ca2+ influx and increases the Ca2+ level in the postsynaptic compartment. The continuously increased Ca2+ level activates the MAP kinase pathway and other Ca2+-mediated processes in ways that may lead to neuronal dystrophy, abnormal brain development and behavioral abnormalities.
These results suggest that the CaMKII and MAP kinase signaling pathways are excessively activated in the Olfm1 mutant olfactory bulb and hippocampus, possibly as a result of increased Ca2+ influx and elevated intracellular Ca2+ levels causing the abnormal behaviors, impaired olfactory function, and reduction in the size of major axon bundles.
Discussion
Olfm1 belongs to a family of olfactomedin domain-containing proteins consisting of 13 family members in mammals (Tomarev and Nakaya, 2009). There is growing evidence demonstrating that proteins belonging to this family may play important roles in normal development and pathology. For example, mutations in the gene encoding the most studied protein from this family, myocilin, may lead to glaucoma, the second leading cause of blindness worldwide (Adam et al., 1997; Stone et al., 1997). Mutation in another gene, OLFM2, was implicated in open-angle glaucoma in the Japanese population (Funayama et al., 2006). It was shown that OLFM4 is a marker for stem cells in human intestine and marks a subset of colorectal cancer cells (van der Flier et al., 2009). Genome-wide association studies also suggest that OLFM4 may be involved in childhood obesity (Bradfield et al., 2012). Mutations in latrophilin 3 have been recently associated with attention deficit disorder (Arcos-Burgos et al., 2010). Olfm1 may play a role in multiple biological processes in neuronal tissues including differentiation and proliferation of neuronal precursor cells, migration of neural crest and cortical cells, brain ischemia, and axon growth (Barembaum et al., 2000; Moreno and Bronner-Fraser, 2005; Cheng et al., 2007; Nakaya et al., 2008; Nakaya et al., 2012).
One possible approach to elucidate the molecular mechanisms of Olfm1 action is through the identification of proteins and protein complexes interacting with it. The availability of good antibodies and proper controls are critical for the identification of protein partners. Recently, we developed antibodies that selectively recognized and precipitated Olfm1 from cell lysates. To control the specificity of immunoprecipitation, we used a mouse line producing truncated Olfm1 protein with a deletion of 52 amino acids in the central part. Using these mice, it was previously shown that Olfm1 may serve as a mediator of ischemia-induced apoptosis of neurons (Cheng et al., 2007). Previous analysis of Olfm1 mutant mice showed that they have a normal lifespan but exhibit inefficient breeding of homozygous knock-out pairs (Cheng et al., 2007). Using a shotgun proteomics approach, we identified 59 candidate proteins that may interact with Olfm1 or with Olfm1-containing protein complexes. We identified proteins interacting only with wild-type Olfm1, only with mutated Olfm1, or with both. Interaction of Olfm1 was confirmed for 7 selected proteins in independent immunoprecipitation experiments, indicating high specificity of our approach (Fig. 6B). Nevertheless, the interaction of Olfm1 with other proteins listed in Table 2 should be confirmed in the future experiments.
We identified Olfm2 and Olfm3 as proteins interacting with wild-type but not with mutated Olfm1. These data confirmed our previous observations that Olfm1 is able to form heterodimers with Olfm2 and Olfm3 (Sultana et al., 2011), and further demonstrate that this interaction requires a domain within the 52 amino acid portion of Olfm1 deleted in the mutant mice. It should be mentioned that several proteins previously identified as interacting with Olfm1 (NgR1, dystrobrevin, Wave 1, amyloid precursor proteins) (Cheng et al, 2007; Veroni et al, 2007; Nakaya et al, 2012) were not identified by our analysis indicating that sensitivity of the method is limited and that there are undoubtedly other Olfm1-interacting proteins that remain to be identified.
About 20% of candidate proteins were associated with neuronal activity including synaptic activity. The most abundant protein interacting with both wild-type and mutated Olfm1 is Teneurin-4 which is also known as ODZ4. There are four genes encoding teneurins in mammals that show unique, complementary expression patterns during development. Teneurin-4 is expressed in the developing and adult mouse eye and brain (Ben-Zur et al., 2000; Zhou et al., 2003) and is implicated in neurite growth, cell adhesion and eye development (Young and Leamey, 2009). Large-scale genome-wide association analysis of bipolar disorder identified a new susceptibility locus near ODZ4 (Psychiatric GWAS Consortium Bipolar Disorder Working Groop, 2011). It has been shown that teneurin-4 is a regulator of oligodendrocyte differentiation and myelination of small-diameter axons in mouse CNS (Suzuki et al., 2012). It is interesting to note that teneurin-2 (but not teneurin-1, -3 or 4) is a ligand of latrophilin 1, an olfactomedin domain-containing neuronal receptor of α-latrotoxin (Silva et al., 2011). The teneurins consist of about 2800 amino acids and possess a complex set of functional domains (Minet et al., 1999; Feng et al., 2002; Young and Leamey, 2009). It has been shown that the C-terminal globular domain of teneurin-2 is essential for interaction with latrophilin-1 (Silva et al., 2011). Although we do not know at present whether the same domain in teneurin-4 is essential for interaction with Olfm1, our data suggest that the olfactomedin domain in Olfm1 is required for interaction with teneurin-4. We are currently exploring the effects of the Olfm1-teneurin-4 interaction on biological functions including neurite growth.
One of the proteins interacting with Olfm1 was a subunit of the AMPA receptor, GluR2. This subunit is the most abundant subunit of the AMPAR in neonatal brain. Our subsequent experiments demonstrated that Olfm1 also interacts with other subunits, GluR1, GluR3 and GluR4. The interactions of Olfm1 mutant protein and GluR2 and GluR4 were reduced as compared with wild-type Olfm1 suggesting that the N-terminal part of Olfm1 is essential for the interaction. Interaction of Olfm1-3 with GluR1-4 has been recently demonstrated in independent shotgun experiments using antibodies against GluR1-4 proteins (Schwenk et al., 2012; Shanks et al., 2012). It was noted that this interaction is stable since the complex of Olfm1 and GluR1-4 proteins survived an array of solubilization buffers with different stringency (Schwenk et al., 2012). Is has been shown that proteins interacting with GluR1-4 subunits may affect the number of AMPARs in the postsynaptic membrane and excitatory synaptic transmission (Derkach et al., 2007). At the moment, we still do not know how the interaction of Olfm1 with GluR1-4, or the absence of this interaction in the case of mutated Olfm1, affects properties of AMPAR. Moreover, even in the absence of Olfm1, closely related family members, Olfm2 and Olfm3, may interact with GluR1-4 and compensate for the absence of Olfm1. To address this question, we are currently producing a complete Olfm1 KO as well as triple Olfm2/Olfm3/Olfm1 KO.
The mutation in Olfm1 causes a deregulation of intracellular Ca2+ concentration in neurons. Levels of [Ca2+]i control multiple processes involved in brain development (Spitzer, 2012), physiology (Kochubey et al., 2011), pathology (LaFerla, 2002; Jeyakumar et al., 2005), aging (Toescu and Vreugdenhil, 2010), and cell death (Berridge et al., 2003; Cali et al., 2012). [Ca2+] in neurons are coordinately regulated by machineries including membrane receptors, voltage-gated ion channels (Lai and Jan, 2006) and intracellular Ca2+ stores (Solovyova and Verkhratsky, 2002). Interaction of wild-type but not mutated Olfm1 with AMPAR as well as with a voltage-gated calcium channel protein, Cav2.1 (Cacna1a) (Table 2) may contribute to changes in Ca2+ influx. An elevated resting Ca2+ level in neurons expressing mutant Olfm1 may be responsible for the abnormal hyperactivation of CaMKII and RAS-ERK pathways. In turn, activation of these pathways may be involved in the regulation of GluR1-4 trafficking and phosphorylation affecting AMPAR properties (Derkach et al., 2007). Such dysregulation of synaptic Ca2+ dynamics and downstream kinases may underlie some or all of the behavioral phenotypes of Olfm1 mutant mice documented in the present study.
Elevated levels of CaMKII and EKR1/2 in the olfactory bulb and hippocampus of young mutant mice may cause their dysfunction. A reduction of olfactory function as detected by an olfactory behavior test and manganese-enhanced MRI analysis may be, at least partially, due to reduction in the number of certain populations of neurons in the olfactory bulb of Olfm1 mutant mice compared with their heterozygous littermates. Reduction of the olfactory function may also occur at the neonatal stages because the milk score of P1-P2 Olfm1 mutant pups is low, and some mutant mice die at early postnatal stages.
The development of different brain regions was also affected by the Olfm1 mutation. Most of the Olfm1 mutant brain regions analyzed by MRI were reduced in size compared to the wild-type littermates. Mutant mice have abnormal anxiety behavior and social activity. Among behavioral tests that we used, Olfm1 mutant mice showed the most dramatic changes in the marble-burying and light-dark compartment tests. The marble-burying test is considered to be a useful model of neophobia and anxiety behavior (Nicolas et al., 2006). Previous studies of mice lacking individual GluR1-4 subunits demonstrated a spectrum of behavioral disorders including changes in anxiety and exploratory activity (Fitzgerald et al., 2010). Although we do not expect that the modification of Olfm1 interaction with GluR1-4 will completely reproduce knockout phenotype for individual GluR1-4 subunit, changes in the properties of AMPAR may be partially responsible for the behavioral phenotype of Olfm1 mutant mice.
In conclusion, our data provide new evidence that Olfm1 is a multifunctional protein that may play important roles not only in differentiation and proliferation of neuronal precursor cells and axon growth as was suggested previously, but also in behavior, olfactory activity and numerous functions associated with Ca2+ signaling.
Fig. 7.
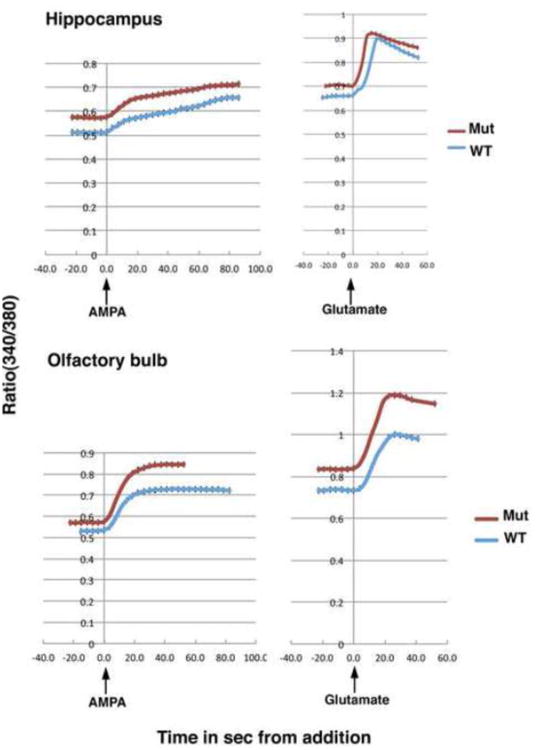
Hippocampal and olfactory bulb interneurons exhibit exaggerated Ca2+ responses to AMPA and glutamate. Intracellular calcium concentration measured with Fura2 loaded into slices in the hippocampal CA3 regions (upper panels) and olfactory bulb inner plexiform layer (lower panels) from P3 wild-type and Olfm1 mutant mice before and during sequential exposures to 100 μM AMPA and 1 mM glutamate.
Highlights.
Olfactomedin 1, a secreted protein, interacts with several proteins including AMPAR
Deletion in the central part of Olfm1modified its interaction with binding proteins
Mice expressing mutated Olfm1 have abnormal anxiety behavior and social activity
These mutant mice have reduced size of major axon bundles and reduced brain volume
Intracellular Ca2+ is increased in hippocampus of Olfm1 mutant mice
Acknowledgments
We thank Dr. Thomas V. Johnson for critical reading of the manuscript.
This work was supported by the Intramural Research Programs of the National Eye Institute, National Institute of Neurological Disorders, and National Aging Institute, National Institutes of Health.
Abbreviations
- MRI
Magnetic Resonance Imaging
- Olfm1
olfactomedin 1
- Olfm1-KO
Olfm1 knockout
- Q-PCR
quantitative RT-PCR
Footnotes
Publisher's Disclaimer: This is a PDF file of an unedited manuscript that has been accepted for publication. As a service to our customers we are providing this early version of the manuscript. The manuscript will undergo copyediting, typesetting, and review of the resulting proof before it is published in its final citable form. Please note that during the production process errors may be discovered which could affect the content, and all legal disclaimers that apply to the journal pertain.
Contributor Information
Naoki Nakaya, Email: nakayan@nei.nih.gov.
Afia Sultana, Email: sultana@nei.nih.gov.
Jeeva Munasinghe, Email: munasinj@ninds.nih.gov.
Aiwu Cheng, Email: chengai@grc.nia.nih.gov.
Mark P. Mattson, Email: mattsonm@grc.nia.nih.gov.
References
- Adam MF, Belmouden A, Binisti P, Brezin AP, Valtot F, Bechetoille A, Dascotte JC, Copin B, Gomez L, Chaventre A, Bach JF, Garchon HJ. Recurrent mutations in a single exon encoding the evolutionarily conserved olfactomedin-homology domain of TIGR in familial open-angle glaucoma. Hum Mol Genet. 1997;6:2091–2097. doi: 10.1093/hmg/6.12.2091. [DOI] [PubMed] [Google Scholar]
- Aoki I, Wu YJ, Silva AC, Lynch RM, Koretsky AP. In vivo detection of neuroarchitecture in the rodent brain using manganese-enhanced MRI. NeuroImage. 2004;22:1046–1059. doi: 10.1016/j.neuroimage.2004.03.031. [DOI] [PubMed] [Google Scholar]
- Arcos-Burgos M, Jain M, Acosta MT, Shively S, Stanescu H, Wallis D, Domene S, Velez JI, Karkera JD, Balog J, Berg K, Kleta R, Gahl WA, Roessler E, Long R, Lie J, Pineda D, Londono AC, Palacio JD, Arbelaez A, Lopera F, Elia J, Hakonarson H, Johansson S, Knappskog PM, Haavik J, Ribases M, Cormand B, Bayes M, Casas M, Ramos-Quiroga JA, Hervas A, Maher BS, Faraone SV, Seitz C, Freitag CM, Palmason H, Meyer J, Romanos M, Walitza S, Hemminger U, Warnke A, Romanos J, Renner T, Jacob C, Lesch KP, Swanson J, Vortmeyer A, Bailey-Wilson JE, Castellanos FX, Muenke M. A common variant of the latrophilin 3 gene, LPHN3, confers susceptibility to ADHD and predicts effectiveness of stimulant medication. Mol Psychiatry. 2010;15:1053–1066. doi: 10.1038/mp.2010.6. [DOI] [PubMed] [Google Scholar]
- Barembaum M, Moreno TA, LaBonne C, Sechrist J, Bronner-Fraser M. Noelin-1 is a secreted glycoprotein involved in generation of the neural crest. Nat Cell Biol. 2000;2:219–225. doi: 10.1038/35008643. [DOI] [PubMed] [Google Scholar]
- Basta-Kaim A, Fijal K, Budziszewska B, Regulska M, Leskiewicz M, Kubera M, Golembiowska K, Lason W, Wedzony K. Prenatal lipopolysaccharide treatment enhances MK-801-induced psychotomimetic effects in rats. Pharmacol Biochem Behav. 2011;98:241–249. doi: 10.1016/j.pbb.2010.12.026. [DOI] [PubMed] [Google Scholar]
- Ben-Zur T, Feige E, Motro B, Wides R. The mammalian Odz gene family: homologs of a Drosophila pair-rule gene with expression implying distinct yet overlapping developmental roles. Dev Biol. 2000;217:107–120. doi: 10.1006/dbio.1999.9532. [DOI] [PubMed] [Google Scholar]
- Berridge MJ, Bootman MD, Roderick HL. Calcium signalling: dynamics, homeostasis and remodelling. Nat Rev Mol Cell Biol. 2003;4:517–529. doi: 10.1038/nrm1155. [DOI] [PubMed] [Google Scholar]
- Bjornson RD, Carriero NJ, Colangelo C, Shifman M, Cheung KH, Miller PL, Williams K. X!!Tandem, an improved method for running X!tandem in parallel on collections of commodity computers. J Proteome Res. 2008;7:293–299. doi: 10.1021/pr0701198. [DOI] [PMC free article] [PubMed] [Google Scholar]
- Bradfield JP, Taal HR, Timpson NJ, Scherag A, Lecoeur C, Warrington NM, Hypponen E, Holst C, Valcarcel B, Thiering E, Salem RM, Schumacher FR, Cousminer DL, Sleiman PM, Zhao J, Berkowitz RI, Vimaleswaran KS, Jarick I, Pennell CE, Evans DM, St Pourcain B, Berry DJ, Mook-Kanamori DO, Hofman A, Rivadeneira F, Uitterlinden AG, van Duijn CM, van der Valk RJ, de Jongste JC, Postma DS, Boomsma DI, Gauderman WJ, Hassanein MT, Lindgren CM, Magi R, Boreham CA, Neville CE, Moreno LA, Elliott P, Pouta A, Hartikainen AL, Li M, Raitakari O, Lehtimaki T, Eriksson JG, Palotie A, Dallongeville J, Das S, Deloukas P, McMahon G, Ring SM, Kemp JP, Buxton JL, Blakemore AI, Bustamante M, Guxens M, Hirschhorn JN, Gillman MW, Kreiner-Moller E, Bisgaard H, Gilliland FD, Heinrich J, Wheeler E, Barroso I, O'Rahilly S, Meirhaeghe A, Sorensen TI, Power C, Palmer LJ, Hinney A, Widen E, Farooqi IS, McCarthy MI, Froguel P, Meyre D, Hebebrand J, Jarvelin MR, Jaddoe VW, Smith GD, Hakonarson H, Grant SF. A genome-wide association meta-analysis identifies new childhood obesity loci. Nat Genet. 2012;44:526–531. doi: 10.1038/ng.2247. [DOI] [PMC free article] [PubMed] [Google Scholar]
- Cali T, Ottolini D, Brini M. Mitochondrial Ca(2+) and neurodegeneration. Cell Calcium. 2012;52:73–85. doi: 10.1016/j.ceca.2012.04.015. [DOI] [PMC free article] [PubMed] [Google Scholar]
- Cheng A, Arumugam TV, Liu D, Khatri RG, Mustafa K, Kwak S, Ling HP, Gonzales C, Xin O, Jo DG, Guo Z, Mark RJ, Mattson MP. Pancortin-2 interacts with WAVE1 and Bcl-xL in a mitochondria-associated protein complex that mediates ischemic neuronal death. J Neurosci. 2007;27:1519–1528. doi: 10.1523/JNEUROSCI.5154-06.2007. [DOI] [PMC free article] [PubMed] [Google Scholar]
- Craig R, Cortens JC, Fenyo D, Beavis RC. Using annotated peptide mass spectrum libraries for protein identification. J Proteome Res. 2006;5:1843–1849. doi: 10.1021/pr0602085. [DOI] [PubMed] [Google Scholar]
- Danielson PE, Forss-Petter S, Battenberg EL, deLecea L, Bloom FE, Sutcliffe JG. Four structurally distinct neuron-specific olfactomedin-related glycoproteins produced by differential promoter utilization and alternative mRNA splicing from a single gene. J Neurosci Res. 1994;38:468–478. doi: 10.1002/jnr.490380413. [DOI] [PubMed] [Google Scholar]
- Deacon RM. Assessing nest building in mice. Nat Protoc. 2006;1:1117–1119. doi: 10.1038/nprot.2006.170. [DOI] [PubMed] [Google Scholar]
- Derkach VA, Oh MC, Guire ES, Soderling TR. Regulatory mechanisms of AMPA receptors in synaptic plasticity. Nat Rev. 2007;8:101–113. doi: 10.1038/nrn2055. [DOI] [PubMed] [Google Scholar]
- Feng K, Zhou XH, Oohashi T, Morgelin M, Lustig A, Hirakawa S, Ninomiya Y, Engel J, Rauch U, Fassler R. All four members of the Ten-m/Odz family of transmembrane proteins form dimers. J Biol Chem. 2002;277:26128–26135. doi: 10.1074/jbc.M203722200. [DOI] [PubMed] [Google Scholar]
- Fitzgerald PJ, Barkus C, Feyder M, Wiedholz LM, Chen YC, Karlsson RM, Machado-Vieira R, Graybeal C, Sharp T, Zarate C, Harvey-White J, Du J, Sprengel R, Gass P, Bannerman D, Holmes A. Does gene deletion of AMPA GluA1 phenocopy features of schizoaffective disorder? Neurobiol Dis. 2010;40:608–621. doi: 10.1016/j.nbd.2010.08.005. [DOI] [PMC free article] [PubMed] [Google Scholar]
- Funayama T, Mashima Y, Ohtake Y, Ishikawa K, Fuse N, Yasuda N, Fukuchi T, Murakami A, Hotta Y, Shimada N. SNPs and interaction analyses of noelin 2, myocilin, and optineurin genes in Japanese patients with open-angle glaucoma. Invest Ophthalmol Vis Sci. 2006;47:5368–5375. doi: 10.1167/iovs.06-0196. [DOI] [PubMed] [Google Scholar]
- Hemish J, Nakaya N, Mittal V, Enikolopov G. Nitric oxide activates diverse signaling pathways to regulate gene expression. J Biol Chem. 2003;278:42321–42329. doi: 10.1074/jbc.M308192200. [DOI] [PubMed] [Google Scholar]
- Jeyakumar M, Dwek RA, Butters TD, Platt FM. Storage solutions: treating lysosomal disorders of the brain. Nat Rev. 2005;6:713–725. doi: 10.1038/nrn1725. [DOI] [PubMed] [Google Scholar]
- Kochubey O, Lou X, Schneggenburger R. Regulation of transmitter release by Ca(2+) and synaptotagmin: insights from a large CNS synapse. Trends Neurosci. 2011;34:237–246. doi: 10.1016/j.tins.2011.02.006. [DOI] [PubMed] [Google Scholar]
- LaFerla FM. Calcium dyshomeostasis and intracellular signalling in Alzheimer's disease. Nat Rev. 2002;3:862–872. doi: 10.1038/nrn960. [DOI] [PubMed] [Google Scholar]
- Lai HC, Jan LY. The distribution and targeting of neuronal voltage-gated ion channels. Nat Rev. 2006;7:548–562. doi: 10.1038/nrn1938. [DOI] [PubMed] [Google Scholar]
- Lencinas A, Chhun DC, Dan KP, Ross KD, Hoover EA, Antin PB, Runyan RB. Olfactomedin-1 activity identifies a cell invasion checkpoint during epithelial-mesenchymal transition in the embryonic heart. Dis Model Mech. 2012;6:632–642. doi: 10.1242/dmm.010595. [DOI] [PMC free article] [PubMed] [Google Scholar]
- Lister RG. The use of a plus-maze to measure anxiety in the mouse. Psychopharmacol (Berlin) 1987;92:180–185. doi: 10.1007/BF00177912. [DOI] [PubMed] [Google Scholar]
- Minet AD, Rubin BP, Tucker RP, Baumgartner S, Chiquet-Ehrismann R. Teneurin-1, a vertebrate homologue of the Drosophila pair-rule gene ten-m, is a neuronal protein with a novel type of heparin-binding domain. J Cell Sci. 1999;112:2019–2032. doi: 10.1242/jcs.112.12.2019. [DOI] [PubMed] [Google Scholar]
- Moreno TA, Bronner-Fraser M. Noelins modulate the timing of neuronal differentiation during development. Dev Biol. 2005;288:434–447. doi: 10.1016/j.ydbio.2005.09.050. [DOI] [PubMed] [Google Scholar]
- Nakaya N, Lee HS, Takada Y, Tzchori I, Tomarev SI. Zebrafish olfactomedin 1 regulates retinal axon elongation in vivo and is a modulator of Wnt signaling pathway. J Neurosci. 2008;28:7900–7910. doi: 10.1523/JNEUROSCI.0617-08.2008. [DOI] [PMC free article] [PubMed] [Google Scholar]
- Nakaya N, Sultana A, Lee HS, Tomarev SI. Olfactomedin 1 interacts with the nogo a receptor complex to regulate axon growth. J Biol Chem. 2012;287:37171–37184. doi: 10.1074/jbc.M112.389916. [DOI] [PMC free article] [PubMed] [Google Scholar]
- Park SK, Nguyen MD, Fischer A, Luke MPS, Affar EB, Dieffenbach PB, Tseng HC, Shi Y, Tsai LH. Par-4 links dopamine signaling and depression. Cell. 2005;122:275–287. doi: 10.1016/j.cell.2005.05.031. [DOI] [PubMed] [Google Scholar]
- Pautler RG, Silva AC, Koretsky AP. In vivo neuronal tract tracing using manganese-enhanced magnetic resonance imaging. Magn Reson Med. 1998;40:740–748. doi: 10.1002/mrm.1910400515. [DOI] [PubMed] [Google Scholar]
- Psychiatric GWAS Consortium Bipolar Disorder Working Groop. Large-scale genome-wide association analysis of bipolar disorder identifies a new susceptibility locus near ODZ4. Nat Genet. 2011;43:977–983. doi: 10.1038/ng.943. [DOI] [PMC free article] [PubMed] [Google Scholar]
- Rice HC, Townsend M, Bai J, Suth S, Cavanaugh W, Selkoe DJ, Young-Pearse TL. Pancortins interact with amyloid precursor protein and modulate cortical cell migration. Development. 2012;139:3986–3996. doi: 10.1242/dev.082909. [DOI] [PMC free article] [PubMed] [Google Scholar]
- Schwenk J, Harmel N, Brechet A, Zolles G, Berkefeld H, Muller CS, Bildl W, Baehrens D, Huber B, Kulik A, Klocker N, Schulte U, Fakler B. High-resolution proteomics unravel architecture and molecular diversity of native AMPA receptor complexes. Neuron. 2012;74:621–633. doi: 10.1016/j.neuron.2012.03.034. [DOI] [PubMed] [Google Scholar]
- Shanks NF, Savas JN, Maruo T, Cais O, Hirao A, Oe S, Ghosh A, Noda Y, Greger IH, Yates JR, 3rd, Nakagawa T. Differences in AMPA and Kainate Receptor Interactomes Facilitate Identification of AMPA Receptor Auxiliary Subunit GSG1L. Cell Rep. 2012;1:590–598. doi: 10.1016/j.celrep.2012.05.004. [DOI] [PMC free article] [PubMed] [Google Scholar]
- Silva AC, Lee JH, Aoki I, Koretsky AP. Manganese-enhanced magnetic resonance imaging (MEMRI): methodological and practical considerations. NMR Biomed. 2004;17:532–543. doi: 10.1002/nbm.945. [DOI] [PubMed] [Google Scholar]
- Silva JP, Lelianova VG, Ermolyuk YS, Vysokov N, Hitchen PG, Berninghausen O, Rahman MA, Zangrandi A, Fidalgo S, Tonevitsky AG, Dell A, Volynski KE, Ushkaryov YA. Latrophilin 1 and its endogenous ligand Lasso/teneurin-2 form a high-affinity transsynaptic receptor pair with signaling capabilities. Proc Natl Acad Sci USA. 2011;108:12113–12118. doi: 10.1073/pnas.1019434108. [DOI] [PMC free article] [PubMed] [Google Scholar]
- Solovyova N, Verkhratsky A. Monitoring of free calcium in the neuronal endoplasmic reticulum: an overview of modern approaches. J Neurosci Methods. 2002;122:1–12. doi: 10.1016/s0165-0270(02)00300-x. [DOI] [PubMed] [Google Scholar]
- Spitzer NC. Activity-dependent neurotransmitter respecification. Nat Rev. 2012;13:94–106. doi: 10.1038/nrn3154. [DOI] [PMC free article] [PubMed] [Google Scholar]
- Stone EM, Fingert JH, Alward WL, Nguyen TD, Polansky JR, Sunden SL, Nishimura D, Clark AF, Nystuen A, Nichols BE, Mackey DA, Ritch R, Kalenak JW, Craven ER, Sheffield VC. Identification of a gene that causes primary open angle glaucoma. Science. 1997;275:668–670. doi: 10.1126/science.275.5300.668. [DOI] [PubMed] [Google Scholar]
- Sultana A, Nakaya N, Senatorov VV, Tomarev SI. Olfactomedin 2: Expression in the eye and interaction with other olfactomedin domain-containing proteins. Invest Ophthalmol Vis Sci ence. 2011;52:2584–2592. doi: 10.1167/iovs.10-6356. [DOI] [PMC free article] [PubMed] [Google Scholar]
- Suzuki N, Fukushi M, Kosaki K, Doyle AD, de Vega S, Yoshizaki K, Akazawa C, Arikawa-Hirasawa E, Yamada Y. Teneurin-4 is a novel regulator of oligodendrocyte differentiation and myelination of small-diameter axons in the CNS. J Neurosci. 2012;32:11586–11599. doi: 10.1523/JNEUROSCI.2045-11.2012. [DOI] [PMC free article] [PubMed] [Google Scholar]
- Tenk CM, Kavaliers M, Ossenkopp KP. Neonatal treatment with lipopolysaccharide differentially affects adult anxiety responses in the light-dark test and taste neophobia test in male and female rats. Int J Dev Neurosci. 2013;31:171–180. doi: 10.1016/j.ijdevneu.2012.12.004. [DOI] [PubMed] [Google Scholar]
- Thomas A, Burant A, Bui N, Graham D, Yuva-Paylor LA, Paylor R. Marble burying reflects a repetitive and perseverative behavior more than novelty-induced anxiety. Psychopharmacol. 2009;204:361–373. doi: 10.1007/s00213-009-1466-y. [DOI] [PMC free article] [PubMed] [Google Scholar]
- Thomas GM, Huganir RL. MAPK cascade signalling and synaptic plasticity. Nat Rev. 2004;5:173–183. doi: 10.1038/nrn1346. [DOI] [PubMed] [Google Scholar]
- Toescu EC, Vreugdenhil M. Calcium and normal brain ageing. Cell Calcium. 2010;47:158–164. doi: 10.1016/j.ceca.2009.11.013. [DOI] [PubMed] [Google Scholar]
- Tomarev SI, Nakaya N. Olfactomedin domain-containing proteins: possible mechanisms of action and functions in normal development and pathology. Mol Neurobiol. 2009;40:122–138. doi: 10.1007/s12035-009-8076-x. [DOI] [PMC free article] [PubMed] [Google Scholar]
- van der Flier LG, van Gijn ME, Hatzis P, Kujala P, Haegebarth A, Stange DE, Begthel H, van den Born M, Guryev V, Oving I, van Es JH, Barker N, Peters PJ, van de Wetering M, Clevers H. Transcription factor achaete scute-like 2 controls intestinal stem cell fate. Cell. 2009;136:903–912. doi: 10.1016/j.cell.2009.01.031. [DOI] [PubMed] [Google Scholar]
- Veroni C, Grasso M, Macchia G, Ramoni C, Ceccarini M, Petrucci TC, Macioce P. beta-dystrobrevin, a kinesin-binding receptor, interacts with the extracellular matrix components pancortins. J Neurosci Res. 2007;85:2631–2639. doi: 10.1002/jnr.21186. [DOI] [PubMed] [Google Scholar]
- Watanabe T, Michaelis T, Frahm J. Mapping of retinal projections in the living rat using high-resolution 3D gradient-echo MRI with Mn2+-induced contrast. Magn Reson Med. 2001;46:424–429. doi: 10.1002/mrm.1209. [DOI] [PubMed] [Google Scholar]
- Watanabe T, Natt O, Boretius S, Frahm J, Michaelis T. In vivo 3D MRI staining of mouse brain after subcutaneous application of MnCl2. Magn Reson Med. 2002;48:852–859. doi: 10.1002/mrm.10276. [DOI] [PubMed] [Google Scholar]
- Witt RM, Galligan MM, Despinoy JR, Segal R. Olfactory behavioral testing in the adult mouse. J Vis Exp. 2009;23 doi: 10.3791/949. [DOI] [PMC free article] [PubMed] [Google Scholar]
- Young TR, Leamey CA. Teneurins: important regulators of neural circuitry. Int J Biochem Cell Biol. 2009;41:990–993. doi: 10.1016/j.biocel.2008.06.014. [DOI] [PubMed] [Google Scholar]
- Zhou XH, Brandau O, Feng K, Oohashi T, Ninomiya Y, Rauch U, Fassler R. The murine Ten-m/Odz genes show distinct but overlapping expression patterns during development and in adult brain. Gene Expr Patterns. 2003;3:397–405. doi: 10.1016/s1567-133x(03)00087-5. [DOI] [PubMed] [Google Scholar]