

Abstract
Multiple myeloma (MM) is an incurable malignancy of the plasma cells localized to the bone marrow. A rare population of MM cancer stem cells (MM-CSCs) has been shown to be responsible for maintaining the pull of residual disease and to contribute to myeloma relapse. The stem cells are found in a bone marrow niche in contact with the stromal cells that are responsible for maintaining the proliferative quiescence of the MM-CSC and regulate its self-renewal and differentiation decisions. Here we show that both MM and bone marrow stromal cells express N-cadherin, a cell-cell adhesion molecule shown to maintain a pool of leukemic stem cells. Inhibition of N-cadherin using a neutralizing antibody led to an increase in the MM cell proliferation. A decrease in MM cell adhesion to the bone marrow stroma was observed in the first 24 hours of co-culture followed by a 2.3-30-fold expansion of the adherent cells. Moreover, inhibition of N-cadherin led to a 4.8-9.6-fold expansion of the MM-CSC population. Surprisingly, addition of the N-cadherin antagonist peptide resulted in massive death of the non-adherent MM cells, while the viability of the adherent cells and MM-CSCs remained unaffected. Interestingly, the proliferative effects of N-cadherin inhibition were not mediated by the nuclear translocation of β-catenin. Taken together, our findings demonstrate the crucial role of N-cadherin in regulating MM cell proliferation and viability and open an interesting avenue of investigation to understand how structural modifications of N-cadherin can affect MM cell behavior. Our findings suggest that targeting N-cadherin may be a useful therapeutic strategy to treat MM in conjunction with an agent that has anti-MM-CSC activity.
Keywords: Multiple myeloma, cancer stem cells, N-cadherin
Introduction
Multiple myeloma (MM) is an incurable malignancy of the bone marrow (BM) plasma cells and despite the development of potent new therapies, remains the second most prevalent hematopoietic cancer in the United States and Europe [1,2]. The major clinical manifestations of MM include lytic bone lesions and an expansion of clonal plasma cells leading to BM suppression, anemia, end organ damage, and susceptibility to infection, ultimately resulting in death. While considerable progress has been made in prolonging progression-free survival, nearly 100% of MM patients experience one or more relapses, suggesting that a small population of drug-resistant neoplastic cells remains even after exposure to the most advanced treatment regimens [3-5]. With the emergence of the cancer stem cell (CSC) hypothesis, many studies have focused on characterizing these rare, drug-resistant, relapse-causing cells and dissecting the mechanisms driving self-renewal and differentiation of this tumorigenic population [4,6-8]. While the identity of the MM-CSC remains controversial, it has been shown that only a small, drug-resistant population of MM cells is tumorigenic in vivo and in vitro [4,9-12]. Understanding the behavior of this cell population and the regulation of its growth is of utmost importance for the development of new therapeutic strategies.
Tumor microenvironment is one of the crucial drivers of cancer cell behavior and has been shown to regulate proliferation rates of malignant cells [13]. Moreover, the microenvironment in the proximity of the CSCs, the CSC niche, has been shown to regulate self-renewal, proliferation, and differentiation of the stem cells [13,14]. Attachment of CSCs to the BM stromal cells, such as mesenchymal stem cells or osteoblasts (OB), and/or the extracellular matrix (ECM) components of the BM microenvironment have been shown to confer drug-resistance [4,15,16]. CSC adhesion to the stromal cells is responsible for the retention of these cells in the niche and modulation of these interactions has been shown to drive the self-renewal versus differentiation decisions. In MM, integrins, such as VLA-4 and VLA-5; CAM-family adhesion molecules, VCAM, MAdCAM, NCAM; and cadherins, E-cadherin and N-cadherin, have been shown to play a role in maintaining the cross-talk between the malignant cells and the BM stroma [17-21]. However, the role of the adhesion molecules in the regulation of the MM-CSC behavior has not been explored.
N-cadherin (N-cdh), a cell-cell adhesion molecule of the cadherin family, is aberrantly expressed by many epithelial cancers, such as breast, prostate, bladder and esophageal cancers, melanoma, and in hematological malignancies, such as acute myeloid leukemia [22-27]. Additionally, both MM cell lines and primary cells from the BM aspirates of patients with MM express N-cdh [20,28]. Moreover, elevation of soluble N-cdh levels has been detected in patients with MM and has been shown to correlate with poor prognosis [28], suggesting importance of N-cdh in pathobiology of MM. Although the idea remains controversial, N-cdh has been shown to regulate proliferation of the human hematopoietic stem cells that reside in the endosteal niche and is enriched in leukemic stem cells [26,29-31]. Moreover, since we have previously demonstrated that MM-CSCs also localize to the endosteal niche [9], we hypothesized that N-cdh may play a role in regulating the growth of MM-CSCs. Here we show that inhibition of N-cdh with the neutralizing antibody (GC4) N-cdh prevented attachment of MM cells to the BM stroma but induced proliferation of the MM cells in contact with either BM stromal cells or osteoblasts. Furthermore, inhibition of N-cdh induced an expansion of the MM-CSC population. Surprisingly, treatment of the same cultures with a cyclic N-cdh blocking antagonist peptide induced cell death in non-adherent MM cells, but not in MM cells adherent to the BM stroma or osteoblasts. Taken together, our data demonstrate that N-cdh is an important regulator of the MM-CSC niche behavior and emphasize the importance of adhesion molecules in maintaining a pool of CSCs.
Materials and methods
Cell culture
RPMI-8226 and U266 cells (ATCC) were grown in MM growth medium [RPMI-1640 (Sigma) supplemented with 10% fetal bovine serum (FBS) (Sigma) and 1% penicillin/streptomycin (Sigma)]. Immortalized human bone marrow mesenchymal stem cell line (FnMSC) was a kind gift from Dr. Carlotta Glackin (Beckman Research Institute, City of Hope National Medical Center) [4] and was cultured in mesenchymal stem cell (MSC) growth medium [αMEM (Sigma) supplemented with 10% FBS, 50 U/ml/50 μg/ml penicillin/streptomycin, and 1% L-glutamine (Sigma)]. All cells were grown at 37°C in a 5% CO2 incubator.
Osteoblast differentiation
FnMSC cells were differentiated into OBs by culturing them for 5 weeks in osteogenic medium [αMEM supplemented with 5% FBS, 2 mM L-glutamine, 1 mM sodium pyruvate, 10 mM HEPES, 100 μM L-ascorbate-2-phosphate, 1.8 mM KH2PO4, 1x10⁻⁷ M dexamethasone, 50 U/ml/50 μg/ml penicillin/streptomycin (all reagents were obtained from Sigma)]. FnMSC cells were seeded in 48-well plates at 5,000 cells/well and cultured in 400 μl of osteogenic media. The medium was changed weekly at which point cells were assayed for their differentiation state using xylenol orange. Xylenol orange (Sigma) 2 mM stock was made in distilled water, sterile filtered, and diluted at 1:100 into differentiation media. The assay was performed per manufacturer’s instructions. The presence of OBs was visualized using the rhodamine filter on a Zeiss AxioObserver fluorescent microscope. Image analysis was done using Zeiss AxioVision software (release 4.7.1) and Adobe Photoshop CS3.
Co-culture assay
FnMSC cells were seeded in 48-well plates at 50,000 cells/400 μl of MSC growth medium and grown for 24 hours until confluent. MSC medium was removed and 10,000 RPMI-8226-GFP or U266-GFP cells were added on top of the FnMSC monolayer in 400 μl of MM growth medium with either an antibody isotype control at 1:100 dilution (Sigma), function blocking N-cdh antibody at 1:100 dilution (Sigma, GC4 clone), non-specific, control peptide at 250 μg/ml (Ac-Cys-His-Gly-Val-Asp-Cys-NH2 (CHGVDC) [32], American Peptides), or N-cdh blocking peptide at 250 μg/ml (Ac-Cys-His-Ala-Val-Cys-NH2 (CHAVC) [32], American Peptides). Prior to combining each population, MM cells and FnMSCs were pre-incubated with either antibodies (isotype or GC4) or peptides (CHGVDC or CHAVC) for 1 hour at room temperature.
Cells were co-cultured for 72 hours and the non-adherent cells were removed from the wells and retained. The wells were gently washed with MM medium and the wash medium was combined with the reserved cells. The number of viable and non-viable cells in the non-adherent fraction was then counted using a trypan blue exclusion assay on a hemocytometer. The adherent cells were removed by trypsin digestion. MM cells were differentiated from FnMSC cells on the basis of GFP expression and GFP+ cells were counted using the FITC filter on a Zeiss AxioObserver fluorescent microscope. Each experiment was repeated a minimum of 3 times in triplicate. Image analysis was done using Zeiss AxioVision software (release 4.7.1) and Adobe Photoshop CS3.
Colony forming unit (CFU) assay
Adherent and non-adherent MM cell fractions described above were counted, pelleted, and resuspended in 200 μl of cell resuspension solution supplied with methylcellulose medium (R&D Systems) and mixed with 1 ml of Human Complete Methylcellulose Media (R&D Systems). The cell methylcellulose mixture was placed into 35 mm ultra-low adhesion dishes (Stem Cell Technologies), incubated at 37°C in a 5% CO2 incubator for 14 days, and resulting colonies were counted. Each experiment was repeated a minimum of 3 times in triplicate.
Immunofluorescence and confocal microscopy
For immunofluorescence, cells were either grown in glass cover slip-bottom chamber slides or cytospun onto glass slides. Subsequently, cells were fixed in 10% neutral buffered formalin for 15 minutes at room temperature. Cells were washed with phosphate buffered saline (PBS) and permeabilized in 0.1% Triton X-100 (Sigma) in PBS for β-catenin and Ki67 staining. Non-specific binding sites were then blocked with 1% bovine serum albumin (BSA) (Sigma) in PBS for 1 hour at room temperature and washed with PBS. Cells were incubated overnight at 4°C with the mouse-anti-human N-cdh antibody (Sigma) at 1:100 dilution, rabbit-anti-human β-catenin antibody (Cell Signaling) at 1:100 dilution, or mouse-anti-human Ki67 antibody (Santa Cruz Biotechnology) at 1:200 dilution in 1% BSA/PBS. Subsequently, cells were washed with PBS. For N-cadherin and β-catenin staining slides were incubated for 15 minutes with MOM Biotin Reagent (Vector Labs) per manufacturer’s instructions and washed twice with PBS for 2 minutes each. Fluorescein-avidin reagent was added to the cells and incubated for 8 minutes at room temperature protected from light. The stained cells were then washed with PBS and nuclei were counter stained for 5 minutes at room temperature with Nuclear Isolation and Staining DAPI solution (Beckman Coulter) diluted at 1:25 into 1% BSA in PBS. N-cdh stained cells were co-stained with Alexa-594 conjugated wheat germ agglutinin (WGA) (Life Technologies) at 5 μg/ml for 10 minutes at room temperature. After a final PBS wash a drop of Vectashield mounting medium (Vector Labs) was added to the cells to preserve fluorescence. Images were acquired on a Zeiss AxioObserver fluorescent microscope or a Zeiss LSM 710 confocal microscope (as indicated). Image analysis was done using Zeiss AxioVision (release 4.7.1) or Zeiss ZEN (blue edition) software and Adobe Photoshop CS3.
RT-PCR
RNA from MM cell lines and FnMSC cells was isolated using TRI Reagent (Sigma) per manufacturer’s instructions. RNA concentration was determined on a NanoDrop ND-1000 spectrophotometer, aliquoted, and stored at -80°C. RT-PCR was performed using OneStep RT-PCR kit (Qiagen) per manufacturer’s instructions. The primers for N-cdh and GAPDH were as follows: forward N-cdh primer CGAGCCGCCTGCGCTGCCAC and reverse N-cdh primer CGCTGCTCCCCGCTCCCCGC; forward GAPDH primer GAGTCAACGGATTTGGTCGT and reverse GAPDH primer GACAAGCTTCCCGTTCTCAG. PCR was performed on a Mastercycler thermocycler (Eppendorf) using the following program: 1) cDNA synthesis step: 50°C for 30 minutes, 95°C for 15 minutes; 2) PCR step (35 cycles): 94°C for 30 seconds, 50°C for 30 seconds, 72°C for 1 minute; 3) final extension step: 72°C for 10 minutes. Amplified DNA fragments were resolved on 2% agarose gel.
Immunoblotting
MM and FnMSC cells were lysed in the RIPA buffer [150 mM NaCl, 50 mM Tris pH 7.5, 1% Triton-100, 1% NP-40, 0.1% SDS, 0.5% sodium deoxycholate, protease inhibitor tablet (Roche)], centrifuged, and the supernatant was collected. Protein concentration was determined using a BCA Protein Assay kit (Pierce) per manufacturer’s instructions. Prior to electrophoresis, 4x SDS loading buffer with 100 mM DTT (Sigma) was added and samples were heated at 95°C for 5 minutes. Proteins were separated on 10% SDS-PAGE gel and transferred to Immobilon-FL polyvinylidene difluoride membrane (Millipore). The membrane was blocked for 1 hour in Odyssey Blocking Buffer (LiCor) and incubated overnight at 4°C with anti-N-cadherin antibody (Sigma, GC4 clone) or anti-actin antibody (BD Biosciences) at 1:200 in Odyssey Blocking Buffer. Membranes were then washed 3 times for 15 minutes each in Tris-buffered saline, Tween-20 (TBST) buffer [10 mM Tris-HCl pH 7.5, 150 mM NaCl, 1% Tween-20] and incubated for 1 hour at room temperature with the goat anti-mouse IRDye 800CW conjugated secondary antibody (LiCor) diluted at 1:12,000 in Odyssey Blocking Buffer. Membranes were washed again 3 times for 15 minutes each in TBST and were scanned on the Odyssey Infrared Imaging System (LiCor).
Data normalization
Cell adhesion, proliferation, and CSC quantification data in all experiments was normalized to the isotype or peptide control treated cultures for each time point and stromal condition (i.e. FnMSC or OB). Each control was set to 100% and the test measurements were presented as percent of their respective controls.
Statistical analysis
Statistical significance was determined by either two-way ANOVA or Student’s t-test using Prism 5 software (GraphPad Software, Inc), as indicated for each experiment. Test samples were normalized as described above and statistical analysis was done comparing each test condition to the appropriate control. Data were presented as mean ± s.e.m. and p-values with p<0.05 were considered significant.
Results
N-cadherin regulates proliferation of MM cells and their adhesion to the BM stroma
To determine the role of N-cdh in maintaining the MM-CSC niche we established its expression in both MM cells and the human bone marrow mesenchymal stem cell line (FnMSC). RPMI-8226 and U266 MM cell lines and FnMSC cells expressed both N-cdh mRNA (Figure 1A) and protein (Figure 1B). To establish that N-cdh is localized to the cell surface where it will be able to participate in cell-cell interactions, MM and FnMSC cell lines were co-stained with N-cdh and wheat germ agglutinin (WGA), an N-acetyl-D-glucosamine and sialic acid-binding lectin used as a marker of cell membranes. As shown in Figure 1C, N-cdh staining co-localized with wheat germ agglutinin, thus confirming cell surface expression of N-cdh.
Figure 1.

MM and BM mesenchymal stem cells express N-cadherin. A: N-cdh mRNA expression was evaluated by RT-PCR in MM cell lines, RPMI-8226 and U266, and in BM mesenchymal stem cell line (FnMSC). B: N-cdh protein (~130 kDa) expression was determined by immunoblotting in MM cell lines (RPMI-8226, U266) and in BM mesenchymal stem cell line (FnMSC). C: Subcellular localization of N-cdh was assessed by immunofluorescence staining for N-cdh (green), wheat germ agglutinin (WGA) (red), and DAPI-stained nuclei (blue). The merged images show co-localization of N-cdh with the membrane WGA staining (yellow) (scale bar: 50 μm).
Since cell-cell interactions affect many attributes of cell behavior, such as growth, attachment, and survival, we evaluated the function of N-cdh in MM cell proliferation and its requirement for MM cell attachment to the BM stroma. The commercially available N-cdh neutralizing antibody, GC4, was used to block N-cdh/N-cdh interactions between MM and stromal cells [20,33,34]. When added to MM cell cultures, proliferation of both RPMI-8226 and U266 cells was increased 1.5-times in cultures treated with GC4 over the period of 3 days compared to the cultures treated with the isotype control antibody (Figure S1).
To measure the effects of N-cdh on the ability of MM cells to adhere to the BM stroma, MM cell lines were co-cultured with FnMSC cells. To differentiate between FnMSC and MM cells in co-cultures, RPMI-8226 and U266 cells were stably transduced with a GFP-expressing lentivirus. Stable cell lines were selected and, subsequently, sorted to create a population of MM cells expressing high levels of GFP. RPMI-8226-GFP and U266-GFP cells were allowed to attach to a confluent monolayer formed by FnMSC cells and the number of adherent cells in cultures grown in the presence of the isotype control or the GC4 antibody were counted. Surprisingly, the population of adherent MM cells was greater in cultures treated with the GC4 antibody (Figure 2A). Since the number of adherent cells was determined 3 days after initiation of the co-culture and the doubling time of RPMI-8226 and U266 cells was determined to be approximately 24 and 36 hours respectively, we evaluated cell attachment after 4 and 24 hours post co-culture set-up to decouple the effects of N-cdh on adhesion versus proliferation. At 4 hours and 24 hours there were 1.5-times and 1.36-times fewer adherent cells in the GC4-treated population than in the isotype-treated wells respectively (Figure 2B). However, at 72 hours there were 2.5-times more adherent cells in the population where N-cdh was blocked compared to the controls (Figure 2B). Adherent MM cells exhibited Ki67 positive nuclear foci at 72 hours in co-culture demonstrating that these cells were indeed proliferating (not shown). This data suggests that N-cdh is necessary for the initial interaction between the MM and the BM stromal cells and that it is needed to maintain the proliferative quiescence of the adherent MM cells.
Figure 2.
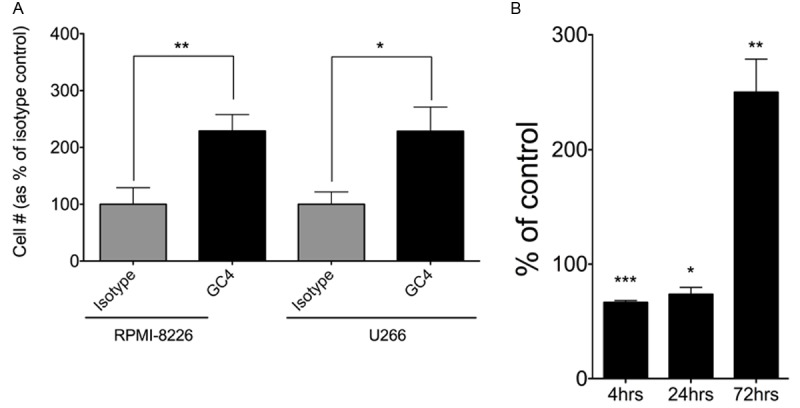
N-cadherin regulates MM cell proliferation and adhesion to the BM stroma. A: RPMI-8226-GFP and U266-GFP cells were grown in co-cultures with FnMSC cells for 72 hours in the presence of the isotype control or the GC4 antibody. Adherent GFP+ MM cells were counted and plotted for each condition. Data was normalized to the isotype control treated cultures (**p=0.004 and *p=0.01 based on the Student’s t-test analysis). B: RPMI-8226-GFP cells were grown in co-cultures with FnMSC cells in the presence of the isotype control or the GC4 antibody for the indicated amount of time. Adherent GFP+ MM cells were counted and plotted at each time point. Data was normalized to its respective isotype control set as 100%. (***p=0.0006, **p=0.007, *p=0.016 based on the Student’s t-test analysis as compared to the isotype control treated cultures for each respective time point).
Blocking N-cadherin induces higher growth of MM cells adhering to osteoblasts (OB) than to the BM stromal cells
The human BM mesenchymal stem cell line, FnMSC, retains the capacity to differentiate into multiple cell lineages, including OBs. Therefore, FnMSC cells were cultured in osteogenic media (see methods) for 5 weeks and their differentiation into OBs was determined by xylenol orange staining (Figure 3A). Xylenol orange is a calcium chelator that fluoresces at 610 nm when bound to mineralized calcium secreted by OBs. It is non-toxic to live cells, and thus, was used for real-time imaging to confirm OB differentiation [35]. After 5 weeks in osteogenic media, most FnMSC cells differentiate into OBs that express higher levels of N-cdh than the parent FnMSC cells (Figure 3B and 3C).
Figure 3.
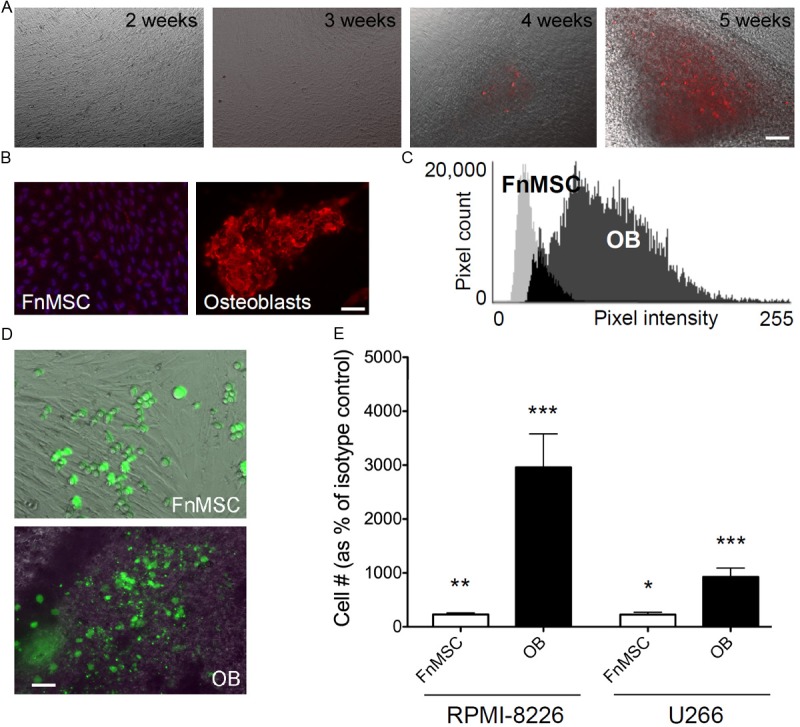
Upon inhibition of N-cadherin, adhesion to the BM stroma cells or osteoblasts induces expansion of the MM cells. A: FnMSC cells were differentiated into osteoblasts (OB) after 5 weeks incubation in osteogenic media. Newly formed osteoblasts mineralized calcium as visualized by xylenol orange staining, appearing after 4 weeks and increasing at 5 weeks as the osteoblast population continues to expand (scale bar: 50 μm). B: Osteoblasts that differentiate from the FnMSC cells expressed higher levels of N-cdh than the parent cells. N-cdh levels were assessed by immunofluorescence with all images acquired at the same exposure time (scale bar: 50 μm). C: Quantification of the N-cdh staining intensity in FnMSCs and OBs. All images were acquired at the same exposure time and a composite histogram of pixel intensity in the 557 nm channel (n=5 independent cultures) is presented. D: RPMI-8226-GFP cells were grown in co-cultures with FnMSC cells or OBs for 72 hours. MM cell adhesion was visualized by DIC and immunofluorescence imaging (scale bar: 50 μm). E: RPMI-8226-GFP and U266-GFP cells were grown in co-cultures with FnMSC cells or OBs in the presence of the isotype control or the GC4 antibody for 72 hours and adherent GFP+ MM cells were counted. Data was normalized to the isotype control treated cultures set as 100% (***p=0.0002, **p=0.007, *p=0.016 based on the Student’s t-test analysis comparing FnMSC and OB co-cultures to each respective isotype control).
In the endosteal niche of the BM, MM cells come in contact with both mesenchymal stem cells and osteoblasts. Therefore, we tested the effects on N-cdh inhibition on MM cells grown in co-cultures with undifferentiated FnMSC cells and FnMSC cells differentiated into OBs (Figure 3D and 3E). RPMI-8226-GFP and U266-GFP cells were treated with either the isotype control or the GC4 antibody in co-culture with either FnMSC cells or OBs. Blocking N-cdh in co-cultures of MM cells with FnMSC mesenchymal stem cells resulted in a 2.3-fold increase in MM cell proliferation in both RPMI-8226 and U266 cells. Interestingly, GC4 treatment of OB co-cultures induced a 30-fold and 9.3-fold expansion of the RPMI-8226 and U266 cells respectively (Figure 3E). A 13-fold expansion of MM cell population was observed when NCI-H929 cells were co-cultured with FnMSC cells (not shown).
N-cadherin inhibition induces an expansion of the adherent MM-CSC population
Leukemic CSCs have been shown to express N-cdh and reside in a BM niche that maintains them in a non-proliferative, drug-resistant state, thus, maintaining a pool of CSCs that when reactivated is responsible for tumor relapse [26,31]. To determine the effect of N-cdh inhibition on MM-CSCs, RPMI-8226-GFP and U266-GFP cells were grown in co-cultures with either FnMSC cells or OBs. Cells were treated for 72 hours with GC4 antibody or the isotype control as described above. Subsequently, cells were counted and placed into a methylcellulose-based colony-forming unit (CFU) assay, which has been used as a reliable read-out for the proportion of CSCs in a population [4,9,31]. Under the conditions of the CFU assay, MM-CSCs, but not their non-tumorigenic counterparts from RPMI-8226 and U266 cell lines formed colonies in methylcellulose medium, while neither FnMSC cells nor OBs were capable of generating any growth. MM-CSC population from RPMI-8226 and U266 cell lines adhering to the FnMSC cells exposed to the N-cdh neutralizing antibody expanded 7.6 and 9.6-fold respectively. Co-cultured with OBs, there was a 4.8 and 7.4-fold increase in the MM-CSCs from the adherent RPMI-8226 and U266 cells respectively (Figure 4). Similar results were obtained when NCI-H929 cell line was co-cultured with OBs where we detected a 2.3-fold increase in MM-CSCs when N-cdh was inhibited with the GC4 antibody (data not shown). Interestingly, this expansion of the MM-CSC population was only observed for the adherent MM cells. There was no statistically significant difference in the MM-CSC population in the non-adherent RPMI-8226 and U266 cells cultured in the presence of N-cdh blocking antibody (Figure S2).
Figure 4.
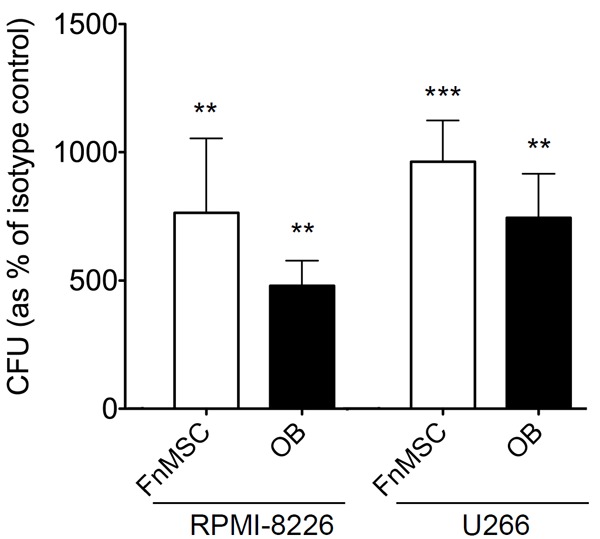
Inhibition of N-cadherin induces an expansion of the adherent MM-CSC population. RPMI-8226-GFP and U266-GFP cells were grown in co-cultures with FnMSC cells or OBs in the presence of the isotype control or the GC4 antibody for 72 hours. Adherent GFP+ MM cells were counted and plated in CFU assays. Colonies appearing after 14 days in CFU were counted and percent stem cells was determined based on the formula: % MM-CSCs = (# of colonies/total # of cells plated in CFU)*100. Data was normalized to the isotype control treated cultures set as 100% (***p<0.0001, **p<0.002 based on the Student’s t-test analysis comparing FnMSC and OB co-cultures to each respective isotype control).
Cyclic N-cadherin antagonist peptide elicits death of the non-adherent MM cell population
To confirm the observations described above with another N-cdh blocking reagent, we treated cells with either CHAVC, a cyclic N-cdh antagonist peptide, or control cyclic peptide that does not bind to N-cdh [32]. Surprisingly, we saw that instead of the proliferation of RPMI-8226 and U266 cells treated with the GC4 antibody, there were fewer non-adherent MM cells in the presence of CHAVC (Figure 5A). Based on the results of the trypan blue exclusion assay we determined that CHAVC had a cytotoxic rather than cytostatic effect on MM cells. Compared to the GC4 treated cultures where just under 3% of cells were positive for trypan blue, and were thus considered non-viable (not shown), RPMI-8226 and U266 cells exhibited 83% and 67% viability respectively after 72 hours of exposure to CHAVC (Figure 5B).
Figure 5.
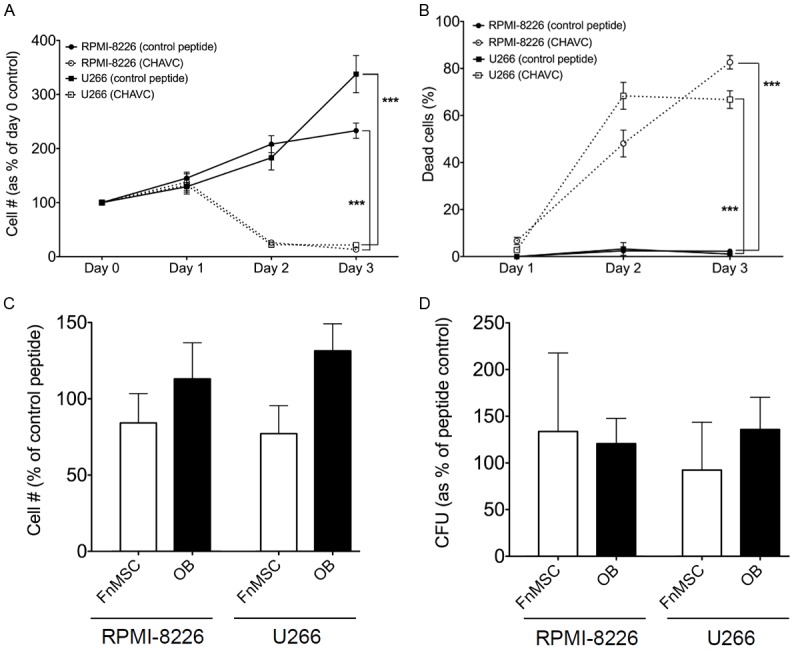
Inhibition of N-cadherin with cyclic CHAVC peptide induces death in non-adherent MM cell population. A: RPMI-8226 and U266 cells were grown in the presence of a control or N-cdh blocking (CHAVC) peptide for the indicated number of days. Percent of healthy cells at each time point was plotted based on the trypan blue exclusion assay (***p<0.0001 based on the two-way ANOVA analysis of each cell line). B: RPMI-8226 and U266 cells were grown in the presence of a control or N-cdh blocking (CHAVC) peptide for the indicated number of days. The number of dead cells at each time point was plotted based on the trypan blue exclusion assay (***p<0.0001 based on the two-way ANOVA analysis of each cell line). C: RPMI-8226-GFP and U266-GFP cells were grown in co-cultures with FnMSC cells or OBs in the presence of the control or N-cdh blocking (CHAVC) peptide for 72 hours and adherent GFP+ MM cells were counted. Data was normalized to the control peptide treated cultures set as 100% (p>0.05 for all comparisons). D: RPMI-8226-GFP and U266-GFP cells were grown in co-cultures with FnMSC cells or OBs in the presence of the control or N-cdh blocking (CHAVC) peptide for 72 hours. Adherent GFP+ MM cells were counted and plated in CFU assays. Colonies appearing after 14 days in CFU were counted and percent stem cells was determined based on the formula: % MM-CSCs = (# of colonies/total # of cells plated in CFU)*100. Data was normalized to the control peptide treated cultures set as 100% (p>0.05 for all comparisons).
However, treatment with CHAVC did not affect the viability of cells adhering to BM stroma. RPMI-8226-GFP and U266-GFP cells were grown in co-cultures with FnMSC cells and OBs in the presence of the control or CHAVC peptides for 72 hours. Adherent GFP+ MM cells were counted and cell counts were normalized to the control peptide treated FnMSC or OB co-cultures as appropriate (Figure 5C). Furthermore, CHAVC treatment did not affect the number of MM-CSCs present in the adherent population (Figure 5D). Taken together, these studies demonstrate that N-cdh antagonist peptide induces death in the non-adherent MM cells, while those tumor cells that adhere to the niche are not sensitive to the cytotoxic effects of CHAVC.
Expansion of MM cells in response to N-cadherin inhibition is not dependent on the nuclear translocation of β-catenin
To begin elucidating the mechanism responsible for the expansion of the MM cell population in response to N-cdh inhibition, we evaluated the dynamics of β-catenin subcellular distribution. Overexpression of β-catenin, including its unphosphorylated form, has been observed in malignant plasma cells from MM patients and has been shown to contribute to the proliferation of malignant cells [36]. The interaction between N-cdh and β-catenin retains β-catenin at the plasma membrane, thus preventing its nuclear translocation, initiation of transcription, and subsequent cell proliferation [37]. We hypothesized that inhibition of N-cdh will release β-catenin, thus stimulating cell growth. RPMI-8226 cells were treated with GC4 or the isotype control antibody for 1, 24, and 72 hours, after which, β-catenin subcellular localization was determined by immunofluorescence. Surprisingly, nuclear translocation of β-catenin was not detected at any of the time points tested (Figure 6A) and the levels of β-catenin in isotype and GC4 treated samples did not change for any of the timepoints (Figure 6B). Wnt treatment of RPMI-8226 cells induced nuclear localization of β-catenin and was used as a positive control (data not shown). These findings suggest that GC4 treatment does not disrupt N-cdh/β-catenin interactions, and that the MM cell proliferation in response to N-cdh inhibition is mediated by a β-catenin independent mechanism.
Figure 6.
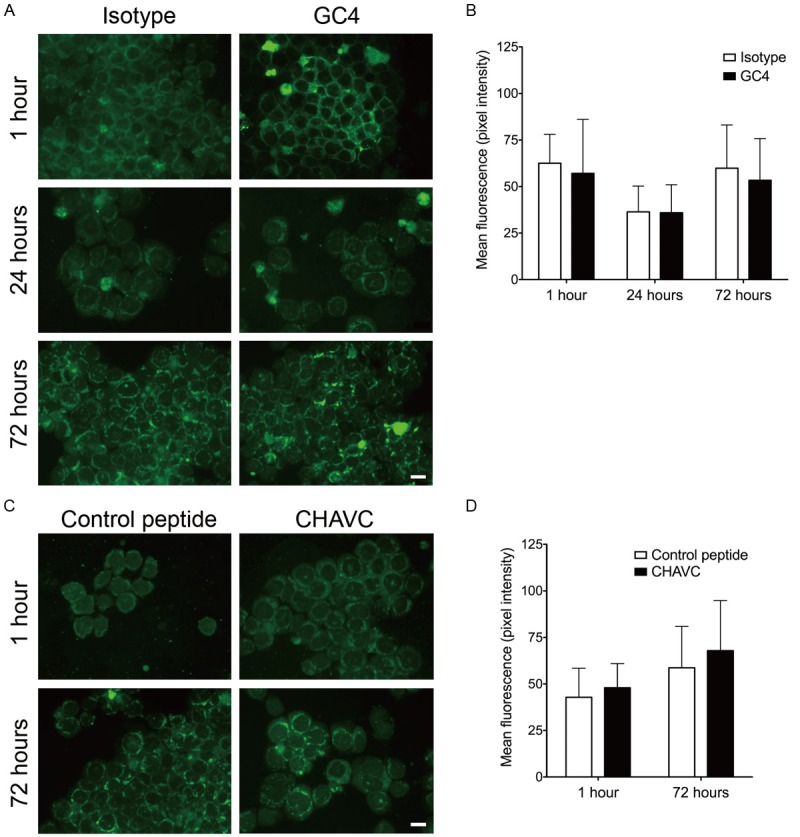
Inhibition N-cadherin does not induce nuclear translocation of β-catenin. (A) RPMI-8226 cells were grown in the presence of an isotype control or GC4 antibody for the indicated amount of time. Subsequently, cells were fixed, permeabilized and stained with anti-β-catenin antibodies. Nuclear translocation of β-catenin was not observed at any of the time points (scale bar: 20 μm). (B) Quantification of the β-catenin staining intensity in isotype and GC4 antibody treated samples. All images were acquired at the same exposure time and a composite histogram of pixel intensity in the 488 nm channel (n=3 independent cultures) is presented. (C) RPMI-8226 cells were grown in the presence of a control or N-cdh blocking (CHAVC) peptide for the indicated amount of time. Cells were processed and stained as in (A) (scale bar: 20 μm). (D) Quantification of the β-catenin staining intensity in control peptide and CHAVC treated samples. All images were acquired at the same exposure time and a composite histogram of pixel intensity in the 557 nm channel (n=3 independent cultures) is presented.
We have also evaluated the subcellular localization of β-catenin in response to treatment with the N-cdh antagonist peptide. Similar to other experiments, β-catenin did not translocate into the nucleus at 1 or 72 hours post treatment (Figure 6C). Moreover, similar levels of β-catenin were present in the control and blocking peptide treated cultures (Figure 6D). This suggests that MM cell behavior in response to the blocking peptide is also not a β-catenin driven process.
Discussion
Previous studies have shown that many of the MM cell lines express N-cdh and that it interacts with β-catenin at the cell surface [20]. We evaluated N-cdh expression in two additional MM cell lines, RPMI-8226 and U266, and in BM mesenchymal stem cells and OBs, and demonstrated that both MM cell lines as well as the stromal cells expressed N-cdh. Interestingly, a significantly higher level of N-cdh expression was detected in OBs differentiated from the immortalized BM mesenchymal stem cell line, FnMSC, compared with the parent cell line.
We hypothesized that if N-cdh is required for MM cell adhesion to the BM stroma, blocking N-cdh will reduce the binding of RPMI-8226 and U266 cell lines to the FnMSCs and OBs. Surprisingly, after 3 days in co-culture in the presence of N-cdh blocking antibodies, we observed an increase in the number of adherent MM cells. Based on these findings we reasoned that it is possible that N-cdh is either not required for MM cell adhesion to the BM stroma or that it may exert its effects at an earlier time point. Therefore, we repeated the co-culture experiment and counted the number of adherent cells after 1 hour and 24 hours. At 1 hour, we observed a 1.5-fold decrease in the number of adherent cells in the GC4 treated co-cultures and at 24 hours, this decrease was still present but at a 1.36-fold reduction. Consistent with the other reports [20], the observed decrease in the number of adherent cells at the early time points suggests that blocking N-cdh affects MM cell adhesion to the BM stromal cells.
Furthermore, our data demonstrate that N-cdh plays a role in regulating MM cell proliferation. Blocking N-cdh for 3 days induced an expansion of MM cells in both FnMSC and OB co-cultures. Interestingly, there was a significantly greater expansion of the MM cells grown in contact with OBs as compared to the co-cultures of MM cells with the BM mesenchymal stem cells. This implies an interesting relationship between MM cells and osteoblasts. MM cells have been shown to prevent osteoblast differentiation from the mesenchymal stem cells, thus, contributing to the bone lesions evident in MM patients [20,38]. At the same time, our data suggests that the N-cdh-based interaction between MM cells and OBs blocks MM cell growth. Therefore, the high levels of N-cdh expression in OBs confers strong proliferation block on MM cells (Figure S3). Since β-catenin associates with N-cdh at the cell membrane, we hypothesized that once the N-cdh adhesion is disrupted, β-catenin will be released and will translocate to the nucleus leading to the transcription of target genes, and ultimately, cell proliferation. Interestingly, nuclear translocation of β-catenin was not observed in cultures treated with N-cdh-blocking reagents (GC4 antibody or CHAVC peptide), indicating a β-catenin-independent mechanism of MM cell proliferation. In another study, Groen and colleagues did not observe an effect on MM cell proliferation in response to modulation of N-cdh levels when MM cells were cultured alone on N-cdh coated plates [20]. Such discrepancy between the study presented here and their work could be explained by the presence of stromal compartments in our experiments. Both stromal cells and OBs provide a physiologically relevant microenvironment for MM cells, but they also introduce additional factors, both secreted and cell bound, that could cooperate with N-cdh and be responsible for the observed effects.
CSCs have been shown to comprise a rare, tumor propagating sub-population within the malignant hierarchy in MM [9-11]. Since N-cdh has been shown to regulate the behavior of both the hematopoietic stem cells and leukemic stem cells in humans [26,29-31], we set out to explore the possible function of N-cdh in MM-CSC biology. Inhibition of N-cdh resulted in an expansion of the adherent MM-CSC population, but had no effect on the non-adherent fraction.
Such differential effect of N-cdh inhibition on adherent and non-adherent MM-CSC populations suggests the possibility of a presence of two pools of MM-CSCs: one found at the endosteal niche in contact with OBs and mesenchymal stem cells whose self-renewal may be regulated by N-cdh, and the second either spread throughout the bone marrow or found in the blood circulation, which is not dependent on N-cdh interactions. Our data suggests that N-cdh regulates the rates of self-renewal of the adherent pool of MM-CSCs.
The surprising difference between the proliferative effects of the N-cdh neutralizing antibody and the cytotoxic effects of the N-cdh antagonist peptide prompted us to look at the differences in binding sites of these two reagents. While both GC4 and CHAVC bind to the first extracellular domain (EC1) of N-cdh, they interact with different epitopes. Neutralizing GC4 antibody was mapped to the K64, P65, D67, and Q70 residues [39], while CHAVC binds to the residues H79, A80, V81 in the EC1 domain of N-cdh (Figure 7A) [32]. N-cdh forms two types of interactions, a strand dimer where two N-cdh molecules form a homodimer on the same cell (i.e. cis-binding), or an adhesion dimer, where N-cdh homodimers on two different cells interact to form cell-cell contacts (i.e. trans-binding) (Figure 7B, panel 1) [40,41]. The GC4 epitope does not overlap with either the cis- or the trans-binding surfaces of N-cdh (Figure 7A), and thus, the neutralizing activity of GC4 is likely through inducing a conformational change in the extracellular domain of N-cdh, which would prevent cell-cell adhesion, but would not disrupt the homodimer (Figure 7B, panel 2) [39]. However, binding of CHAVC to the HAV residues is on the opposite face of the EC1 domain of N-cdh from where GC4 binds and could disrupt both cis- and trans-interactions between N-cdh molecules (Figure 7A and 7B, panel 3) [41].
Figure 7.

GC4 and CHAVC bind to different epitopes of the EC1 domain of N-cadherin. (A) Amino acid sequence of the EC1 domain of N-cdh highlighting the following structural elements: GC4 epitope (orange, [39]); CHAVC binding site (blue, [32]); residues directly involved in trans-binding and cell-cell adhesion (red, [41]), residues involved in homodimerization (purple, [41]). (B) A model of possible effects of various N-cdh blocking treatments on cell adhesion, proliferation, and survival; (a) untreated, (b) GC4 treatment, and (c) CHAVC treatment. When left untreated, or treated with isotype or peptide controls, a complex of homotypic interaction between N-cdh homodimers and FGFR can be assembled activating ligand-independent FGFR signaling, thus leading to cell proliferation and survival. Binding of the GC4 antibody, disrupts the cell-cell interactions, but not the formation of the homodimers maintaining FGFR signaling. CHAVC treatment prevents both cell-cell adhesion and homodimer formation possibly disrupting FGFR signaling, and thus leading to cell death.
To reconcile the conflicting data from GC4 versus CHAVC treatment of MM cells, we propose a hypothetical model of differential interaction between N-cdh and FGFR depending on the dimerization status of N-cdh (Figure 7B). It has been shown that FGFR interacts with the EC4 domain of N-cdh via an association between its heparin-binding motif with the HAV sequence of the FGFR [42]. Upon binding to the N-cdh homodimer, ligand-independent signaling through FGFR is induced leading to cell proliferation and survival via activation of MAPK, PLCγ, and/or CaMKIIα pathways [43]. However, it is possible that CHAVC treatment not only disrupts cis- and trans-interactions of N-cdh, but could also prevent the FGFR binding to N-cdh. We hypothesize that since the GC4 binding does not disrupt the HAV-mediated dimerization of N-cdh or its interaction with FGFR, the GC4 antibody may function as an agonist, inducing cell proliferation. On the other hand, treatment with CHAVC, will disrupt the interactions between N-cdh molecules and N-cdh association with FGFR, thus, in cultures treated with CHAVC the the pro-survival signal from FGFR will be lost leading to cell death (Figure 7B). Future studies will focus on evaluating the FGFR-induced signaling and its relationship to cell proliferation and survival in the context of N-cdh inhibition and on determining the conformation of the N-cdh/GC4 and N-cdh/CHAVC complexes as compared to the wildtype adhesion zippers created by the cis- and trans-associations between N-cdh molecules [41]. Surprisingly, our attempts to create stable N-cdh knockout cell lines failed since N-cdh-shRNA transduced clones could not be selected due to the loss of cell viability, suggesting that total loss of N-cdh expression is lethal in MM cells.
Our study highlights the important contributions of N-cdh to the biology of MM and the implications of perturbations in N-cdh mediated adhesion and signaling for treatment of MM. Our findings suggest that the association between N-cdh molecules may drive the expansion versus death decisions of the MM clone. Understanding this dichotomy will clarify the potential of using N-cdh as a therapeutic target. In pre-clinical and early clinical studies, administration of CHAVC (marketed as ADH-1) showed promise for the treatment of melanoma [44]. However, in phase II clinical trial addition of ADH-1 to the treatment regimen of patients with advanced extremity melanoma failed to show any difference compared to standard treatment alone [45]. Such a disappointing clinical outcome was likely due to the inability of CHAVC treatment to eliminate CSCs. Consistent with this idea, treatment of MM cells with the cyclic N-cdh antagonist peptide does not eliminate the MM-CSCs, but is highly potent in killing the non-adherent MM tumor cells. This suggests that when combined with an anti-MM-CSC agent CHAVC may be an effective treatment for plasma cell leukemia, the stage of MM when cells are in circulation and are non-adherent. Moreover, we demonstrate the central role of N-cdh in maintaining the pool of MM-CSCs that likely contribute to the inevitable relapse of MM.
Acknowledgements
The authors thank Mukti Parikh and Mary Zheng for the critical reading of this manuscript and their valuable suggestions.
Abbreviations
- BM
bone marrow
- CSC
cancer stem cell
- ECM
extracellular matrix
- MM
multiple myeloma
- MM-CSC
multiple myeloma cancer stem cell
- MSC
mesenchymal stem cells
- N-cdh
N-cadherin
- OB
osteoblast
Supporting Information
References
- 1.Dimopoulos MA, Terpos E. Multiple myeloma. Ann Oncol. 2010;21:143–150. doi: 10.1093/annonc/mdq370. [DOI] [PubMed] [Google Scholar]
- 2.Mikhael JR, Dingli D, Roy V, Reeder CB, Buadi FK, Hayman SR, Dispenzieri A, Fonseca R, Sher T, Kyle RA, Lin Y, Russell SJ, Kumar S, Bergsagel PL, Zeldenrust SR, Leung N, Drake MT, Kapoor P, Ansell SM, Witzig TE, Lust JA, Dalton RJ, Gertz MA, Stewart K, Rajkumar SV, Chanan-Khan A, Lacy MQ. Management of Newly Diagnosed Symptomatic Multiple Myeloma: Updated Mayo Stratification of Myeloma and Risk-Adapted Therapy (mSMART) Consensus Guidelines 2013. Mayo Clin Proc. 2013;88:360–376. doi: 10.1016/j.mayocp.2013.01.019. [DOI] [PubMed] [Google Scholar]
- 3.Collins CD. Problems monitoring response in multiple myeloma. Cancer Imaging. 2005;5 Spec No A:S119–126. doi: 10.1102/1470-7330.2005.0033. [DOI] [PMC free article] [PubMed] [Google Scholar]
- 4.Gunn EJ, Williams JT, Huynh DT, Iannotti MJ, Han C, Barrios FJ, Kendall S, Glackin CA, Colby DA, Kirshner J. The natural products parthenolide and andrographolide exhibit anti-cancer stem cell activity in multiple myeloma. Leuk Lymphoma. 2011;52:1085–1097. doi: 10.3109/10428194.2011.555891. [DOI] [PubMed] [Google Scholar]
- 5.Greipp PR, San Miguel J, Durie BGM, Crowley JJ, Barlogie B, Blade J, Boccadoro M, Child JA, Harousseau JL, Kyle RA, Lahuerta JJ, Ludwig H, Morgan G, Powles R, Shimizu K, Shustik C, Sonneveld P, Tosi P, Turesson I, Westin J. International staging system for multiple myeloma. J. Clin. Oncol. 2005;23:3412–3420. doi: 10.1200/JCO.2005.04.242. [DOI] [PubMed] [Google Scholar]
- 6.Reya T, Morrison SJ, Clarke MF, Weissman IL. Stem cells, cancer, and cancer stem cells. Nature. 2001;414:105–111. doi: 10.1038/35102167. [DOI] [PubMed] [Google Scholar]
- 7.Frank NY, Schatton T, Frank MH. The therapeutic promise of the cancer stem cell concept. J Clin Invest. 2010;120:41–50. doi: 10.1172/JCI41004. [DOI] [PMC free article] [PubMed] [Google Scholar]
- 8.Elliott A, Adams J, Al-Hajj M. The ABCs of cancer stem cell drug resistance. IDrugs. 2010;13:632–635. [PubMed] [Google Scholar]
- 9.Kirshner J, Thulien KJ, Martin LD, Debes Marun C, Reiman T, Belch AR, Pilarski LM. A unique three-dimensional model for evaluating the impact of therapy on multiple myeloma. Blood. 2008;112:2935–2945. doi: 10.1182/blood-2008-02-142430. [DOI] [PubMed] [Google Scholar]
- 10.Van Valckenborgh E, Matsui W, Agarwal P, Lub S, Dehui X, De Bruyne E, Menu E, Empsen C, van Grunsven L, Agarwal J, Wang Q, Jernberg-Wiklund H, Vanderkerken K. Tumor-initiating capacity of CD138- and CD138+ tumor cells in the 5T33 multiple myeloma model. Leukemia. 2012;26:1436–1439. doi: 10.1038/leu.2011.373. [DOI] [PMC free article] [PubMed] [Google Scholar]
- 11.Matsui W, Huff CA, Wang QJ, Malehorn MT, Barber J, Tanhehco Y, Smith BD, Civin CI, Jones RJ. Characterization of clonogenic multiple myeloma cells. Blood. 2004;103:2332–2336. doi: 10.1182/blood-2003-09-3064. [DOI] [PMC free article] [PubMed] [Google Scholar]
- 12.Yaccoby S, Epstein J. The proliferative potential of myeloma plasma cells manifest in the SCID-hu host. Blood. 1999;94:3576–3582. [PubMed] [Google Scholar]
- 13.Zhu X, Zhou X, Lewis MT, Xia L, Wong S. Cancer stem cell, niche and EGFR decide tumor development and treatment response: A bio-computational simulation study. J Theor Biol. 2011;269:138–149. doi: 10.1016/j.jtbi.2010.10.016. [DOI] [PMC free article] [PubMed] [Google Scholar]
- 14.Burness ML, Sipkins DA. The stem cell niche in health and malignancy. Semin Cancer Biol. 2010;20:107–115. doi: 10.1016/j.semcancer.2010.05.006. [DOI] [PubMed] [Google Scholar]
- 15.Noborio-Hatano K, Kikuchi J, Takatoku M, Shimizu R, Wada T, Ueda M, Nobuyoshi M, Oh I, Sato K, Suzuki T, Ozaki K, Mori M, Nagai T, Muroi K, Kano Y, Furukawa Y, Ozawa K. Bortezomib overcomes cell adhesion-mediated drug resistance through downregulation of VLA-4 expression in multiple myeloma. Oncogene. 2009;28:231–242. doi: 10.1038/onc.2008.385. [DOI] [PubMed] [Google Scholar]
- 16.LaBarge MA. The difficulty of targeting cancer stem cell niches. Clin Cancer Res. 2010;16:3121–3129. doi: 10.1158/1078-0432.CCR-09-2933. [DOI] [PMC free article] [PubMed] [Google Scholar]
- 17.Damiano JS, Cress AE, Hazlehurst LA, Shtil AA, Dalton WS. Cell adhesion mediated drug resistance (CAM-DR): Role of integrins and resistance to apoptosis in human myeloma cell lines. Blood. 1999;93:1658–1667. [PMC free article] [PubMed] [Google Scholar]
- 18.Michigami T, Shimizu N, Williams PJ, Niewolna M, Dallas SL, Mundy GR, Yoneda T. Cell-cell contact between marrow stromal cells and myeloma cells via VCAM-1 and alpha(4)beta(1)-integrin enhances production of osteoclast-stimulating activity. Blood. 2000;96:1953–60. [PubMed] [Google Scholar]
- 19.Kraj M, Sokołowska U, Kopeć-Szlezak J, Pogłód R, Kruk B, Woźniak J, Szpila T. Clinicopathological correlates of plasma cell CD56 (NCAM) expression in multiple myeloma. Leuk Lymphoma. 2008;49:298–305. doi: 10.1080/10428190701760532. [DOI] [PubMed] [Google Scholar]
- 20.Groen RW, de Rooij MF, Kocemba KA, Reijmers RM, de Haan-Kramer A, Overdijk MB, Aalders L, Rozemuller H, Martens AC, Bergsagel PL, Kersten MJ, Pals ST, Spaargaren M. N-cadherin-mediated interaction with multiple myeloma cells inhibits osteoblast differentiation. Haematologica. 2011;96:1653–1661. doi: 10.3324/haematol.2010.038133. [DOI] [PMC free article] [PubMed] [Google Scholar]
- 21.Yuregir OO, Yurtcu E, Kizilkilic E, Kocer NE, Ozdogu H, Sahin FI. Detecting methylation patterns of p16, MGMT, DAPK and E-cadherin genes in multiple myeloma patients. Int J Lab Hematol. 2010;32:142–149. doi: 10.1111/j.1751-553X.2009.01146.x. [DOI] [PubMed] [Google Scholar]
- 22.Li G, Satyamoorthy K, Herlyn M. Dynamics of cell interactions and communications during melanoma development. Crit Rev Oral Biol Med. 2002;13:62–70. doi: 10.1177/154411130201300107. [DOI] [PubMed] [Google Scholar]
- 23.Li K, He W, Lin N, Wang X, Fan QX. N-cadherin knock-down decreases invasiveness of esophageal squamous cell carcinoma in vitro. World J Gastroenterol. 2009;15:697–704. doi: 10.3748/wjg.15.697. [DOI] [PMC free article] [PubMed] [Google Scholar]
- 24.Lascombe I, Clairotte A, Fauconnet S, Bernardini S, Wallerand H, Kantelip B, Bittard H. N-cadherin as a novel prognostic marker of progression in superficial urothelial tumors. Clin Cancer Res. 2006;12:2780–2787. doi: 10.1158/1078-0432.CCR-05-2387. [DOI] [PubMed] [Google Scholar]
- 25.Jennbacken K, Tesan T, Wang WZ, Gustavsson H, Damber JE, Welen K. N-cadherin increases after androgen deprivation and is associated with metastasis in prostate cancer. Endocr Relat Cancer. 2010;17:469–479. doi: 10.1677/ERC-10-0015. [DOI] [PubMed] [Google Scholar]
- 26.Zhi L, Wang M, Rao Q, Yu F, Mi YC, Wang JX. Enrichment of N-Cadherin and Tie2-bearing CD34(+)/CD38(-)/CD123(+) leukemic stem cells by chemotherapy-resistance. Cancer Lett. 2010;296:65–73. doi: 10.1016/j.canlet.2010.03.021. [DOI] [PubMed] [Google Scholar]
- 27.Kotb AM, Hierholzer A, Kemler R. Replacement of E-cadherin by N-cadherin in the mammary gland leads to fibrocystic changes and tumor formation. Breast Cancer Res. 2011 Oct 26;13:R104. doi: 10.1186/bcr3046. [DOI] [PMC free article] [PubMed] [Google Scholar]
- 28.Vandyke K, Chow AW, Williams SA, To LB, Zannettino AC. Circulating N-cadherin levels are a negative prognostic indicator in patients with multiple myeloma. Br J Haematol. 2013;161:499–507. doi: 10.1111/bjh.12280. [DOI] [PubMed] [Google Scholar]
- 29.Arai F, Hosokawa K, Toyama H, Matsumoto Y, Suda T. Role of N-cadherin in the regulation of hematopoietic stem cells in the bone marrow niche. Ann N Y Acad Sci. 2012;1266:72–77. doi: 10.1111/j.1749-6632.2012.06576.x. [DOI] [PubMed] [Google Scholar]
- 30.Wein F, Pietsch L, Saffrich R, Wuchter P, Walenda T, Bork S, Horn P, Diehlmann A, Eckstein V, Ho AD, Wagner W. N-Cadherin is expressed on human hematopoietic progenitor cells and mediates interaction with human mesenchymal stromal cells. Stem Cell Res. 2010;4:129–139. doi: 10.1016/j.scr.2009.12.004. [DOI] [PubMed] [Google Scholar]
- 31.Zhang B, McDonald T, Holyoake TL, Moon RT, Campana D, Shultz L, Bhatia R. Microenvironmental Protection of CML Stem and Progenitor Cells From Tyrosine Kinase Inhibitors Through N-Cadherin and Wnt Signaling. Blood. 2013;121:1824–38. doi: 10.1182/blood-2012-02-412890. [DOI] [PMC free article] [PubMed] [Google Scholar]
- 32.Williams E, Williams G, Gour BJ, Blaschuk OW, Doherty P. A novel family of cyclic peptide antagonists suggests that N-cadherin specificity is determined by amino acids that flank the HAV motif. J Biol Chem. 2000;275:4007–4012. doi: 10.1074/jbc.275.6.4007. [DOI] [PubMed] [Google Scholar]
- 33.Volk T, Geiger B. A 135-Kd-Membrane Protein of Intercellular Adherens Junctions. EMBO J. 1984;3:2249–2260. doi: 10.1002/j.1460-2075.1984.tb02123.x. [DOI] [PMC free article] [PubMed] [Google Scholar]
- 34.Puch S, Armeanu S, Kibler C, Johnson KR, Muller CA, Wheelock MJ, Klein G. N-cadherin is developmentally regulated and functionally involved in early hematopoietic cell differentiation. J Cell Sci. 2001;114:1567–1577. doi: 10.1242/jcs.114.8.1567. [DOI] [PubMed] [Google Scholar]
- 35.Wang YH, Liu YL, Maye P, Rowe DW. Examination of mineralized nodule formation in living osteoblastic cultures using fluorescent dyes. Biotechnol Prog. 2006;22:1697–1701. doi: 10.1021/bp060274b. [DOI] [PMC free article] [PubMed] [Google Scholar]
- 36.Derksen PW, Tjin E, Meijer HP, Klok MD, MacGillavry HD, van Oers MH, Lokhorst HM, Bloem AC, Clevers H, Nusse R, van der Neut R, Spaargaren M, Pals ST. Illegitimate WNT signaling promotes proliferation of multiple myeloma cells. Proc Natl Acad Sci U S A. 2004;101:6122–6127. doi: 10.1073/pnas.0305855101. [DOI] [PMC free article] [PubMed] [Google Scholar]
- 37.Harris TJ, Peifer M. Decisions, decisions: beta-catenin chooses between adhesion and transcription. Trends Cell Biol. 2005;15:234–237. doi: 10.1016/j.tcb.2005.03.002. [DOI] [PubMed] [Google Scholar]
- 38.Qiang YW, Barlogie B, Rudikoff S, Shaughnessy JD. Dkk1-induced inhibition of Wnt signaling in osteoblast differentiation is an underlying mechanism of bone loss in multiple myeloma. Bone. 2008;42:669–680. doi: 10.1016/j.bone.2007.12.006. [DOI] [PubMed] [Google Scholar]
- 39.Harrison OJ, Corps EM, Berge T, Kilshaw PJ. The mechanism of cell adhesion by classical cadherins: the role of domain 1. J Cell Sci. 2005;118:711–721. doi: 10.1242/jcs.01665. [DOI] [PubMed] [Google Scholar]
- 40.Kim YJ, Johnson KR, Wheelock MJ. N-cadherin-mediated cell motility requires cis dimers. Cell Commun Adhes. 2005;12:23–39. doi: 10.1080/15419060500305971. [DOI] [PubMed] [Google Scholar]
- 41.Shapiro L, Fannon AM, Kwong PD, Thompson A, Lehmann MS, Grubel G, Legrand JF, Als-Nielsen J, Colman DR, Hendrickson WA. Structural basis of cell-cell adhesion by cadherins. Nature. 1995;374:327–337. doi: 10.1038/374327a0. [DOI] [PubMed] [Google Scholar]
- 42.Derycke LD, Bracke ME. N-cadherin in the spotlight of cell-cell adhesion, differentiation, embryogenesis, invasion and signalling. Int J Dev Biol. 2004;48:463–476. doi: 10.1387/ijdb.041793ld. [DOI] [PubMed] [Google Scholar]
- 43.Cavallaro U, Dejana E. Adhesion molecule signalling: not always a sticky business. Nat Rev Mol Cell Biol. 2011;12:189–197. doi: 10.1038/nrm3068. [DOI] [PubMed] [Google Scholar]
- 44.Augustine CK, Yoshimoto Y, Gupta M, Zipfel PA, Selim MA, Febbo P, Pendergast AM, Peters WP, Tyler DS. Targeting N-cadherin enhances antitumor activity of cytotoxic therapies in melanoma treatment. Cancer Res. 2008;68:3777–3784. doi: 10.1158/0008-5472.CAN-07-5949. [DOI] [PubMed] [Google Scholar]
- 45.Beasley GM, Riboh JC, Augustine CK, Zager JS, Hochwald SN, Grobmyer SR, Peterson B, Royal R, Ross MI, Tyler DS. Prospective multicenter phase II trial of systemic ADH-1 in combination with melphalan via isolated limb infusion in patients with advanced extremity melanoma. J. Clin. Oncol. 2011;29:1210–1215. doi: 10.1200/JCO.2010.32.1224. [DOI] [PMC free article] [PubMed] [Google Scholar]
Associated Data
This section collects any data citations, data availability statements, or supplementary materials included in this article.