Abstract
Nucleic acid detection is critical in disease diagnosis as well as in the environmental assays of harmful bacteria or viruses and forensic applications. Current methods for visualized quantification of DNA require costly and sophisticated instruments. Here, we report a multistage propelled volumetric bar chart chip (MV-Chip) for multiplexing and quantitative detection of DNA. Owing to its ‘rocket-like’ propelling reaction, the pre-deposited platinum films could perform cascade amplification and detect as low as 20 pM DNA targets after three stages platinum catalyzed propulsion. The resulting ink bar charts can be directly read out by the naked eye and the signal shows little interference from serum. Single-nucleotide polymorphism and multiplex DNA detection were carried out to demonstrate this powerful application.
The detection of nucleic acid has become a key technology in areas ranging from disease diagnosis to detection of harmful bacteria or viruses and forensic applications.1–8 In the past decade, numerous detection platforms have been developed that rely on different types of colorimetric,1, 9, 10 fluorescent,11–13 Raman,6 magnetic,4, 8, 14 and electrochemical7, 15–17 transducers to convert nucleic acid hybridization events into readout signals. Newly emerging methods show great advantages over traditional assays, particularly in sensitivity, selectivity, and practicality.7, 8, 18, 19 However, because quantification of nucleic acids still requires optical or electronic instruments, most of these methods are so costly that they remain laboratory prototypes.
To meet these challenges, a multiplexed volumetric bar chart chip (V-Chip) has been recently developed in our laboratory for point-of-care and personalized diagnostics.20 The VChip employs ink bar charts to measure oxygen generated by the reaction between catalase and hydrogen peroxide, allowing direct visual quantification of target biomarkers without assistance of instruments, data processing, or computer graphical plotting. However, using the V-Chip device for quantitative detection of DNA in a multiplexed manner and with high sensitivity has never been demonstrated. Here, we report a multistage propelled V-chip (MV-Chip) for DNA detection. In this chip, a ‘rocket-like’ propelling mechanism is employed for signal amplification to improve the sensitivity of detection. DNA hybridization introduces the catalase initiator to start the propellant reaction and deposited platinum films are used to amplify the signal. After the three-stage cascade amplification, about 1000-fold improvement in sensitivity could be achieved with this chip compared with an unamplified chip. A complicated matrix such as serum showed almost no interference with signal intensity. The specificity of MV-Chip was demonstrated by single-nucleotide polymorphism and multiplex DNA detection.
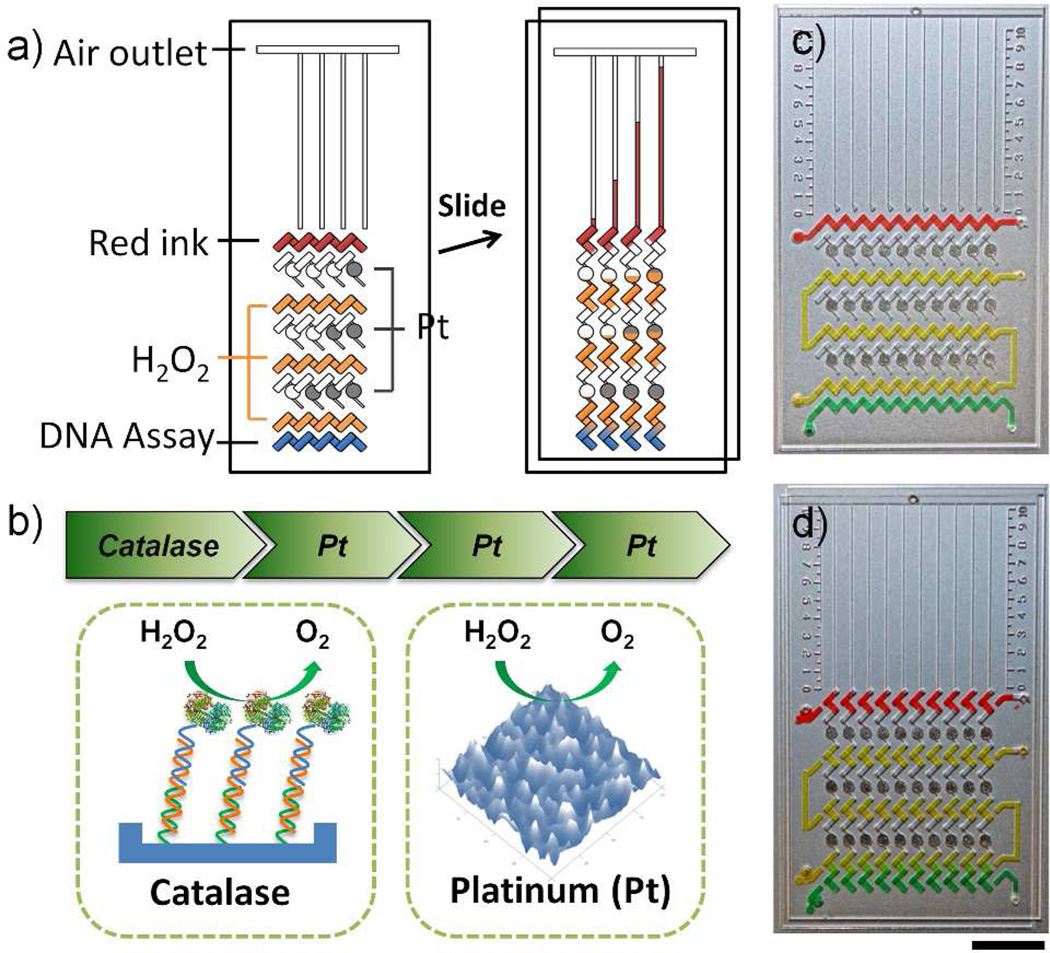
The MV-Chip employs our previously-reported V-Chip technology but integrates new cascade amplification steps in the device (Figure 1 & S1).20 In our previous V-Chip, catalase probes in the ELISA sandwich structures reacted with hydrogen peroxide to produce oxygen, directly pushing the preloaded red ink to generate the visualized bar charts. However, in MV-Chip, the generated oxygen does not directly push ink to form the bar chart. Instead, it pushes the ‘fuel’, hydrogen peroxide, to react with the pre-deposited platinum films in the first stage.21 Then, additional oxygen gas will be produced because of the platinum reaction, which will push preloaded hydrogen peroxide in the second stage to react with platinum films in the second stage. After three stages of cascade platinum amplification, much more oxygen is produced and is able to push the red ink bar charts a longer distance (Figure 1). Because the ends of the channels are vented to atmospheric pressure, the ink bar charts will continue moving and finally run out of the channel.
Figure 1.
Working principle of the MV-Chip. (a) Schematic view of a typical MV-Chip for DNA assay. The detection units with platinum amplification (black circles) show larger bar chart advancement than those without amplification. (b) ‘Rocket-like’ propelling mechanism of the MV-Chip. Catalase introduced by DNA hybridization is the initiator and three stages of rough platinum films (Pt) amplify the signals. (c & d) The representative flow path of each reagent before and after an oblique slide: red lane (ink), yellow lane (H2O2), and green lane (DNA assay). Scale bar is 1cm for c) and d).
The design and working principle of the MV-chip are shown in Figure 1a. In the loading position, the rectangular wells of the top plate and the bottom plate partially overlap to form a tilted ‘N’-shaped fluidic path in the horizontal direction which allows reagents or samples to be loaded through the drilled holes. Before sample assay, the top flow lane (red lane) is preloaded with ink to generate visual bar charts. The second, fourth, and sixth rows consist of isolated circle wells on the bottom plate with platinum films deposited (black circles) for signal amplification, which also serve as air spacers to avoid direct contact between the sample and the ink. The third, fifth, and seventh lanes (orange lane) are preloaded with hydrogen peroxide, which is the “fuel” for the ‘rocket-like’ propelling device. The bottom row is the sample lane (blue lane), where the DNA assays is carried out. We employ sandwich DNA hybridization structures to detect DNA targets and introduce catalase probes (Figure 1b).
The MV-Chip devices are fabricated using two 75×50×1-mm glass slides. Patterns are first drawn with AutoCAD software and fabricated onto the glass surfaces by standard photolithography and glass etching methods. In the post fabrication steps, 2 nm chromium and 20 nm platinum films are deposited in the circle wells using standard lift-off methods (Figure S2).22 The chromium films allow for better adhesion of platinum films to a glass surface.7 Because of the wet etching treatment, the rough surface of the platinum film consists of millions of nanosized protrusions, which allow for fast decomposition of hydrogen peroxide (Figure 1b, S5, S6) in the signal amplification steps.21 We designed and fabricated two kinds of devices that could measure 6 or 10 targets simultaneously (Figure S7). To illustrate the assay process, we loaded yellow and green food dye to represent hydrogen peroxide and assay solution, respectively (Figure 1c). After an oblique slide, ten isolated ‘Z’-shaped paths were formed in the vertical direction and a uniform gradual change could be observed at the bottom of each detection unit because of the food dye diffusion (Figure 1d & S8). In real assays, hydrogen peroxide will diffuse into the assay wells and react with the catalase probes to generate oxygen gas (Figure S1).
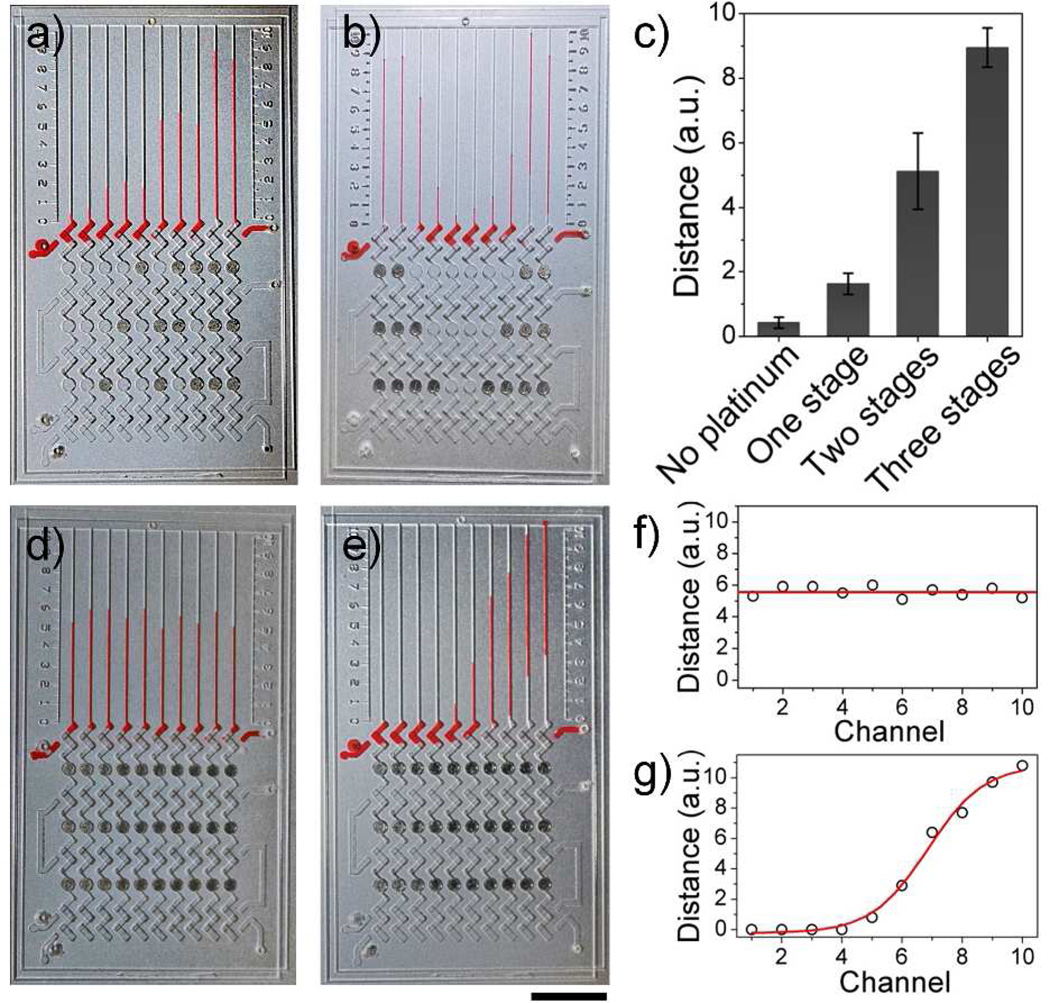
To illustrate that the platinum films can amplify signal, we selectively deposited one, two, or three circle platinum films in each detection unit of a 10-plex chip. In figure 2a, there are ten isolated detection units after sliding, including two control paths without platinum films, three paths with one-stage, three paths with two-stage, and two paths with three-stage amplification. When the catalase solution was uniformly loaded in the assay lane, the resulting bar charts exhibited a staircase growth pattern. In the one-stage amplification, platinum films are selectively deposited at the bottom, middle, or top wells, but the resulting ink bar charts gave nearly identical bar chart results. Identical results can also be observed in the two-stage amplification paths with various locations of platinum films. To further prove the capability for amplification, we also selectively deposited platinum films to form a “V” shaped pattern and the resulting bar charts exhibited a “V” shape staircase change that correlated with the deposited platinum films (Figure 2b). These results suggest that amplification levels are not related to the location of the deposited platinum films, but depend on the amount of platinum films in each vertical path. During device assembly, fluorinated oil was used between the hydrophobic slides as a lubricant and to render the device airtight.13, 23 Each detection unit was isolated by fluorinated oil and did not interfere with the adjacent paths. According to our bar chart results, about 4-, 12- and 22-fold increases could be seen for one, two, and three stage amplifications, respectively, compared to an unamplified lane. This indicates that the platinum films are the cause of the amplified signals (Figure 2c). By using MV-Chips with different numbers of amplification stages, we are able to achieve a wide dynamic range on the same chip.
Figure 2.
Validation of signal amplification for MV-Chip. (a & b) Selectively deposited circle wells with platinum films (dark dots) to produce amplified signals. (c) Bar chart results without or with one, two, or three stages of platinum amplification. Data are obtained from (a) and (b). (d) A uniform concentration of catalase generates uniform readout distance in the presence of 10 µg mL−1 catalase and 0.25 M H2O2. (e) Bar chart images of diffusing 50 µg mL−1 catalase with three stage amplification in the presence 0.25 M H2O2. The dark dots are platinum films in (d) and (e). Scale bar is 1cm for a), b), d) and e). (f & g) the uniformed advancements and sigmoid curve obtained from (d) and (e) respectively.
Next, we used catalase diffusion to investigate the kinetics of ink bar chart movements in each channel. As shown in figure S9, loading 2 µL of food dye into the preloaded PBS buffer located at the bottom lane allows generation of a concentration gradient.24 The movements were recorded using a camera, and heat map images of the change in distance of each channel in 2 minutes are shown in figure S10. The heat map images show clearly that the ink bar in the chip with three-stage amplification moved much faster than the chip without amplification. In 2 minutes, nine channels in the MV-Chip form obvious ink bar charts but only three channels formed ink bar charts in the no-amplification chip, indicating that a lower concentration of catalase can be read out from the MV-Chip (Figure S10 a & c). These results further illustrate that the deposited platinum films are able to improve the sensitivity of detection. Decreasing the concentration of hydrogen peroxide loaded could reduce the movement velocity. When 0.25 M H2O2 was loaded into the MV-Chip, only four channels reached 10 MV-chip units in 2 min (Figure S10b). This movement was slower than the MV-Chip loaded with 0.45 M H2O2, but faster than the chip without amplification loaded with 0.45 M H2O2. As seen in figure S10d, the change in advancement in the tenth channel of V-Chip reached a plateau after 30 sec, attributed to the destruction of catalase in the presence of hydrogen peroxide.25 However, in the MV-Chip, the deposited platinum films overcome the disadvantage of catalase by reacting with hydrogen peroxide even after catalase has been used up. Once a small amount of hydrogen peroxide, propelled by the catalase reaction, entered the bottom platinum well, successive propulsions were observed and more hydrogen peroxide solution entered into the next stage of platinum wells (Figure S11). Therefore, the progression of the ink bars represents the accumulated results of hydrogen peroxide decomposition (Figure 1b & S1).
Although platinum films amplified the signal, the advancement of the bar chart signals still correlated with catalase concentration. Figure 2d and e show a 10-plex MV-Chip loaded with reagents and samples. When a uniform catalase concentration was applied to the MV-Chip, the bar charts showed uniform advancement (Figure 2d & 2f); whereas with a gradient of catalase, created by the diffusion of 2 µL 50 µg mL−1 catalase from an inlet on the bottom-right of the device, the bar chart resembled a sigmoidal shape (Figure 2e & 2g). The progressive increments indicate that the distance of each ink bar correlates to the concentration of the diffused catalase.20 These results clearly demonstrate the relationship between the advancement of the MV-Chip bars and the catalase concentration.
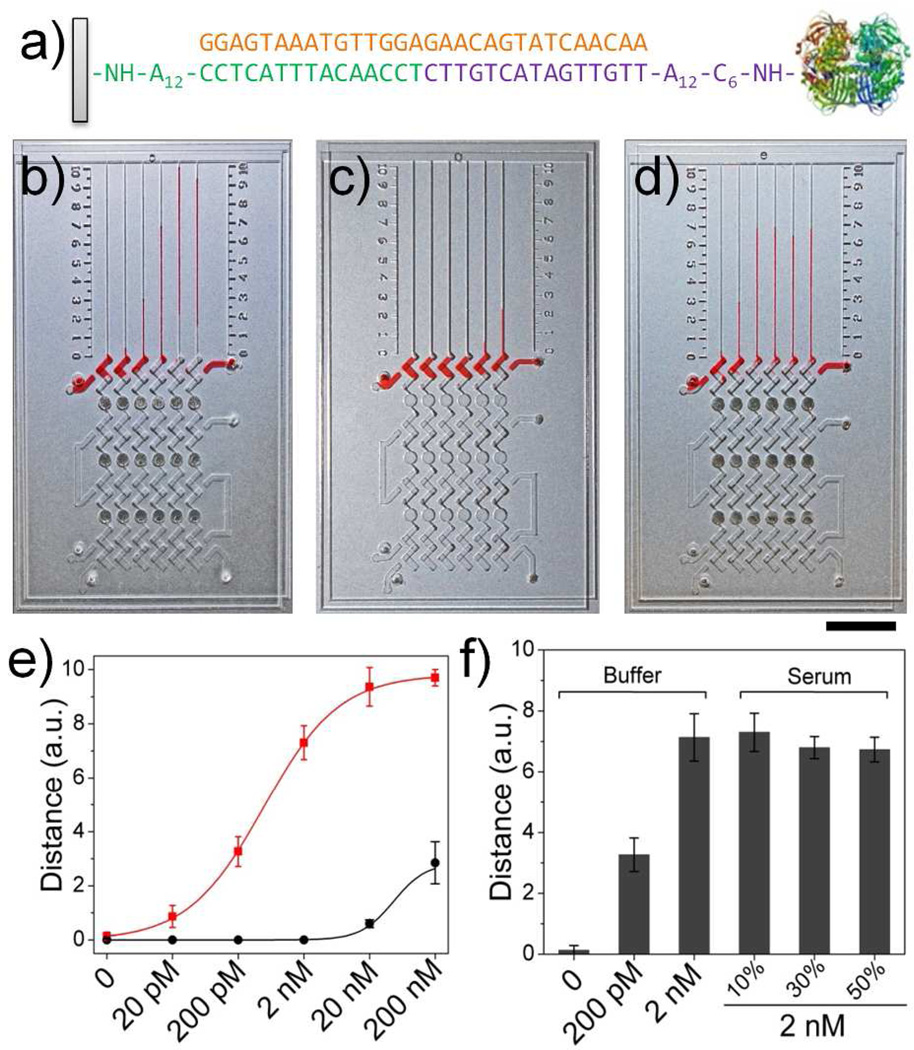
To detect target DNA using the MV-Chip, typical three-component sandwich DNA hybridization was employed in the assay (Figure 3a).6 Prior to the DNA assay, a 15-nucleotide captured DNA strand was covalently immobilized on the epoxy modified glass surface in the assay wells (Figure S12).20, 26 The rough glass surface in the assay wells greatly increases the coating efficiency. The assay wells were then washed with PBS buffer and blocked with BSA. Next, 1 µL of the 30-nucleotide target sequence solution was added to each well and incubated in a humidity chamber for 1 hour at 4°C. After the MV-Chip was assembled and lubricated using oil, the probe DNA-catalase complexes were loaded into the assay lane.18 To monitor the presence of the target DNA, catalase was covalently conjugated with the probe DNA to react with the hydrogen peroxide and generate oxygen gas (Figure S13 & S14). Next, the chip was incubated for 1 hour and thoroughly washed with PBS buffer. Finally, red ink and hydrogen peroxide were loaded and the chip was slid to start the reaction. The results were recorded with a camera and the lengths of ink advancement were marked for quantification.
Figure 3.
DNA detection using MV-Chip. (a) The sandwich DNA hybridization structures and 30-nucleotide Ebola virus (EV) sequence used in MV-Chip. (b, c) The images of ink advancement for detection of target DNA with b) or without c) platinum amplification. The concentration in each lane corresponds to the values in (e). (d) From left to right: bar chart advancements for detection of 0, 200 pM, and 2 nM target DNA in buffer and 2 nM target DNA in 10 %, 30 %, and 50 % serum. Dark points are platinum films in (b), (c) and (d). Scale bar is 1cm for b), c), and d). (e) The target DNA calibration curves corresponding to ink advancement with (red) or without (black) platinum amplification at 5 min, with the target DNA concentration varying from 20 pM to 200 nM. f) MV-Chip readouts of 0, 200 pM, and 2 nM target DNA in buffer and 2 nM target DNA in 10 %, 30 %, and 50 % serum. The error bars in e and f represent the s. d. of three measurements.
Figure 3b and c demonstrate a target DNA response bar chart result after 6 minutes using the 6-plex chips with and without three stage platinum amplification. Different concentrations of 30-nucleotide sequences from 20 pM to 200 nM for Ebola Virus (EV) were investigated in the two chips.6 As expected, the corresponding bar chart progressions directly provide a quantitative summary of these concentrations. As the concentration of the target DNA increased, the signal advancement of the MV-Chip bar charts exhibited a sigmoidal increase. In each case, the result obtained with solutions containing 20 pM DNA were greater by a factor of at least three standard deviations than background signals, indicating that the limit of detection resides at or below this concentration. The detection limit compares favorably with nanoparticle-based DNA assays.1 Without platinum film deposition, only two channels formed ink bar charts in 6 min, and the lowest concentration that could be detected was 20 nM, suggesting that the sensitivity was increased about 1000 fold in the presence of platinum film amplification. We also investigated the capability to detect DNA in a complicated matrix. The 6-plex MV-Chip was used to detect a 2 nM target DNA in 10%, 20%, and 50% serum (Figure 3d). These bar chart results were similar to the results obtained using buffer, indicating that the complicated components of serum do not interfere significantly with MV-Chip performance (Figure 3f).
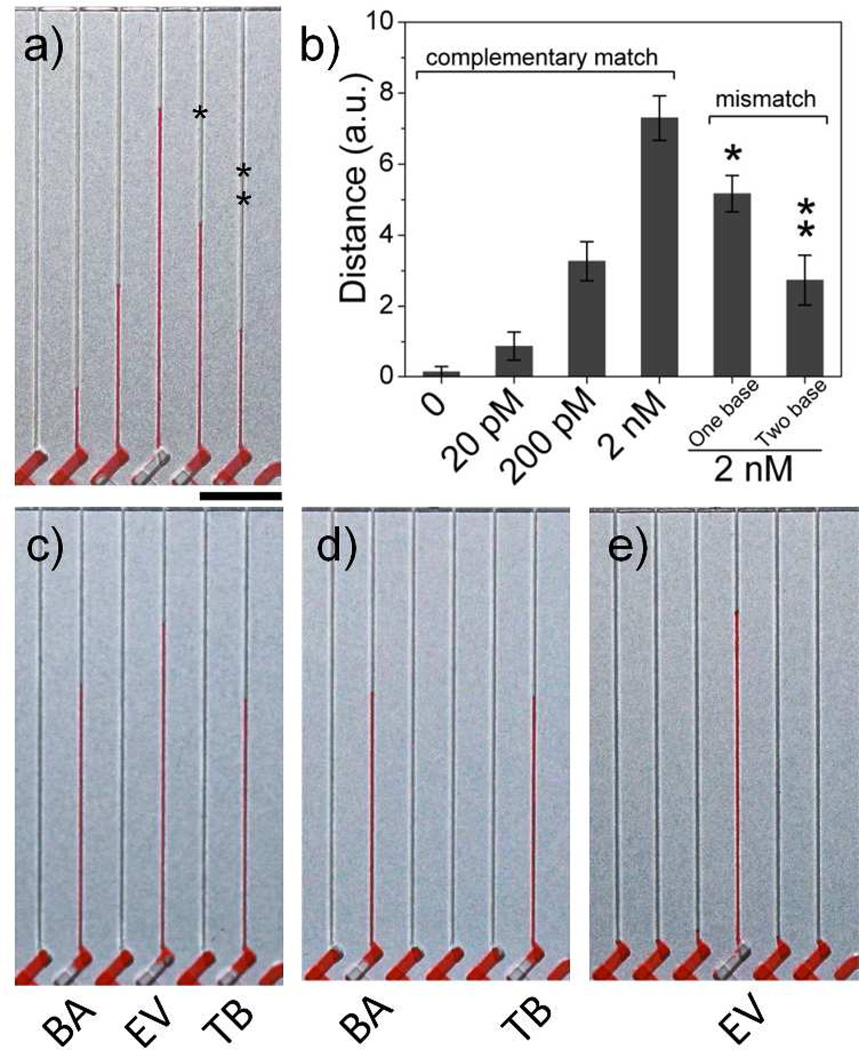
The MV-Chip exhibits excellent specificity that can differentiate single nucleotide polymorphisms (SNPs). After DNA hybridization, the assay lane was washed with PBS buffer at 45°C.11, 27, 28 At this optimum stringency temperature, the DNA sandwich structures are not stable for one-base and two-base mismatched DNA, while the complementary DNA retains stable hybridization. Figure 4 A shows the bar chart results for 0, 20 pM, 200 pM, and 2 nM of target DNA, along with the MV-Chip responses to 2 nM of one and two mismatched oligonucleotides. The MV-Chip results showed a signal of 7.9 units for 2 nM of the complementary DNA. In contrast, 2 nM of one-base or two-base mismatched DNA yielded signals of 5.3 and 2.7 units, a decrease of 32.9 % and 65.8 %, respectively (Figure 4b). These results indicate that the mismatched DNA was dissociated in the washing steps and only a partial duplex hybridization was formed.11
Figure 4.
Mismatch and multiplex DNA tests using MV-Chip. (a) From left to right: bar chart advancements of 0, 20 pM, 200 pM, and 2 nM target DNA (EV) in buffer and 2 nM one base (one star) or two base (two stars) mismatched DNA. (b) The MV-Chip readouts correlated to figure 4a. The error bars represent the s. d. of three measurements. (c, d, e) Selective detection of three, two, or one DNA targets. Scale bar is 0.5 cm for a), c), d), and e).
The MV-Chip also provides the capability for multiplex DNA assays. Three 30-nucleotide sequences of Bacillus anthracis (BA), EV, and Tubercle bacillus (TB) were measured to evaluate the selectivity of the chip.6 The concentration of each sequence was kept constant at 2 nM, and the hybridization conditions were the same as described above. In the first test, three of six channels for target detection showed bar chart signals of 6.3 units (BA), 7.7 units (EV), and 5.8 units (TB), while the control channels did not show signal of more than 0.3 units (Figure 4c). In the next test, we selectively removed one or two of the DNA targets to evaluate the suitability of this method for multiplexing assays. In figure 4d and e, the detection units with targets exhibit similar results as in Figure 4c, indicating the high selectivity for MV-Chip.
In summary, a multistage platinum-amplified device, MV-Chip, has been developed that allows for the quantitative, multiplexed, highly sensitive, and instrument-free detection of DNA. The MV-chip outperforms many other existing methods with an innovative combination of low cost, portability, rapid operation, and convenient readout. The bar chart results could directly be read out without the need for sophisticated data processing steps. Based on our multistage propulsion design, the sensitivity can be further improved by increasing the amplification stages as well as reducing the distance between hydrogen peroxide and platinum films. In the future, this portable device has a potential to work in clinical diagnostics, forensic analysis, and biothreat detection.
Supplementary Material
ACKNOWLEDGMENT
We are grateful for the support from NIH/NIDA 1R01DA035868-01, NIH/NCI 1R01CA180083-01, the Cancer Prevention and Research Institute of Texas (CPRIT-R1007), Emily Herman Research Fund, and Golfers Against Cancer Foundation. We thank the TMHRI AFM core facility for instrumental assistance.
Footnotes
ASSOCIATED CONTENT
Supporting Information.
Experimental details and additional information. This material is available free of charge via the Internet at http://pubs.acs.org.
The authors declare no competing financial interest.
REFERENCES
- 1.Rosi NL, Mirkin CA. Chem. Rev. 2005;105:1547. doi: 10.1021/cr030067f. [DOI] [PubMed] [Google Scholar]
- 2.Giljohann DA, Mirkin CA. Nature. 2009;462:461. doi: 10.1038/nature08605. [DOI] [PMC free article] [PubMed] [Google Scholar]
- 3.Liu J, Cao Z, Lu Y. Chem. Rev. 2009;109:1948. doi: 10.1021/cr030183i. [DOI] [PMC free article] [PubMed] [Google Scholar]
- 4.Xu L, Yu H, Akhras MS, Han SJ, Osterfeld S, White RL, Pourmand N, Wang SX. Biosens. Bioelectron. 2008;24:99. doi: 10.1016/j.bios.2008.03.030. [DOI] [PMC free article] [PubMed] [Google Scholar]
- 5.Kemp JT, D R, White RL, Wang SX, Webb CD. J. Forensic. Sci. 2005;50:1109. [PubMed] [Google Scholar]
- 6.Cao YC, Jin R, Mirkin CA. Science. 2002;297:1536. doi: 10.1126/science.297.5586.1536. [DOI] [PubMed] [Google Scholar]
- 7.Lam B, Das J, Holmes RD, Live L, Sage A, Sargent EH, Kelley SO. Nat. Commun. 2013;4:2001. doi: 10.1038/ncomms3001. [DOI] [PubMed] [Google Scholar]
- 8.Liong M, Hoang AN, Chung J, Gural N, Ford CB, Min C, Shah RR, Ahmad R, Fernandez-Suarez M, Fortune SM, Toner M, Lee H, Weissleder R. Nat. Commun. 2013;4:1752. doi: 10.1038/ncomms2745. [DOI] [PMC free article] [PubMed] [Google Scholar]
- 9.Song YJ, Wei WL, Qu XG. Adv. Mater. 2011;23:4215. doi: 10.1002/adma.201101853. [DOI] [PubMed] [Google Scholar]
- 10.Li H, Rothberg L. Proc. Natl. Acad. Sci U S A. 2004;101:14036. doi: 10.1073/pnas.0406115101. [DOI] [PMC free article] [PubMed] [Google Scholar]
- 11.Zhao XJ, Tapec-Dytioco R, Tan WH. J. Am. Chem. Soc. 2003;125:11474. doi: 10.1021/ja0358854. [DOI] [PubMed] [Google Scholar]
- 12.Dirks RM, Pierce NA. Proc. Natl. Acad. Sci. U S A. 2004;101:15275. doi: 10.1073/pnas.0407024101. [DOI] [PMC free article] [PubMed] [Google Scholar]
- 13.Shen F, Sun B, Kreutz JE, Davydova EK, Du W, Reddy PL, Joseph LJ, Ismagilov RF. J. Am. Chem. Soc. 2011;133:17705. doi: 10.1021/ja2060116. [DOI] [PMC free article] [PubMed] [Google Scholar]
- 14.Xu L, Yu H, Han SJ, Osterfeld S, White RL, Pourmand N, Wang SX. IEEE Trans. Magn. 2008;44:3989. doi: 10.1109/TMAG.2008.2002795. [DOI] [PMC free article] [PubMed] [Google Scholar]
- 15.Xiang Y, Lu Y. Anal. Chem. 2012;84:1975. doi: 10.1021/ac203014s. [DOI] [PMC free article] [PubMed] [Google Scholar]
- 16.Park SJ, Taton TA, Mirkin CA. Science. 2002;295:1503. doi: 10.1126/science.1067003. [DOI] [PubMed] [Google Scholar]
- 17.Fan C, Plaxco KW, Heeger AJ. Proc. Natl. Acad. Sci. U S A. 2003;100:9134. doi: 10.1073/pnas.1633515100. [DOI] [PMC free article] [PubMed] [Google Scholar]
- 18.Xiang Y, Lu Y. Nat. Chem. 2011;3:697. doi: 10.1038/nchem.1092. [DOI] [PMC free article] [PubMed] [Google Scholar]
- 19.Gaster RS, Hall DA, Nielsen CH, Osterfeld SJ, Yu H, Mach KE, Wilson RJ, Murmann B, Liao JC, Gambhir SS, Wang SX. Nat. Med. 2009;15:1327. doi: 10.1038/nm.2032. [DOI] [PMC free article] [PubMed] [Google Scholar]
- 20.Song YJ, Zhang YQ, Bernard PE, Reuben JM, Ueno NT, Arlinghaus RB, Zu YL, Qin LD. Nat. Commun. 2012;3:1283. doi: 10.1038/ncomms2292. [DOI] [PMC free article] [PubMed] [Google Scholar]
- 21.Qin LD, Vermesh O, Shi QH, Heath JR. Lab Chip. 2009;9:2016. doi: 10.1039/b821247c. [DOI] [PMC free article] [PubMed] [Google Scholar]
- 22.Liao X, Brown KA, Schmucker AL, Liu G, He S, Shim W, Mirkin CA. Nat. Commun. 2013;4:2103. doi: 10.1038/ncomms3103. [DOI] [PMC free article] [PubMed] [Google Scholar]
- 23.Du WB, Li L, Nichols KP, Ismagilov RF. Lab Chip. 2009;9:2286. doi: 10.1039/b908978k. [DOI] [PMC free article] [PubMed] [Google Scholar]
- 24.Selimovic S, Sim WY, Kirn SB, Jang YH, Lee WG, Khabiry M, Bae H, Jambovane S, Hong JW, Khademhosseini A. Anal. Chem. 2011;83:2020. doi: 10.1021/ac2001737. [DOI] [PMC free article] [PubMed] [Google Scholar]
- 25.George P. Nature. 1947;160:41–43. doi: 10.1038/160041a0. [DOI] [PubMed] [Google Scholar]
- 26.Nam Y, Branch DW, Wheeler BC. Biosens. Bioelectron. 2006;22:589. doi: 10.1016/j.bios.2006.01.027. [DOI] [PubMed] [Google Scholar]
- 27.Song YJ, Wang XH, Zhao C, Qu KG, Ren JS, Qu XG. Chem. Eur. J. 2010;16:3617. doi: 10.1002/chem.200902643. [DOI] [PubMed] [Google Scholar]
- 28.Taton TA, Mirkin CA, Letsinger RL. Science. 2000;289:1757. doi: 10.1126/science.289.5485.1757. [DOI] [PubMed] [Google Scholar]
Associated Data
This section collects any data citations, data availability statements, or supplementary materials included in this article.


