

Abstract
In girls and young women, irradiation of the ovaries can reduce the number of viable ovarian primordial follicles, which may lead to premature ovarian failure and subsequently to sterility. One strategy to minimize this late effect is to reduce the radiation dose to the ovaries. A primary means of reducing dose is to choose a radiotherapy technique that avoids irradiating nearby normal tissue; however, the relative risk of premature ovarian failure (RRPOF) due to the various therapeutic options has not been assessed. This study compared the predicted RRPOF after craniospinal proton radiotherapy, conventional photon radiotherapy, and intensity-modulated photon radiotherapy. We calculated the equivalent dose delivered to the ovaries of an 11-year old girl from therapeutic and stray radiation. We then predicted the percentage of ovarian primordial follicles killed by radiation and used this as a measure of RRPOF; we also calculated the ratio of relative risk of premature ovarian failure (RRRPOF) among the three radiotherapies. Proton radiotherapy had a lower RRPOF than either of the other two types. We also tested the sensitivity of the RRRPOF between photon and proton therapies to the anatomic position of the ovaries, i.e., proximity to the treatment field (2 ≤ RRRPOF ≤ 10). We found that CRT and IMRT have higher risks of POF than PRT does, regardless of uncertainties in ovarian location. Over all PRT represents a lower RRPOF over the two other modalities.
1. Introduction
Cancer is the second leading cause of death for children 1–14 years old in the United States, and during the period from 1973 to 2000, approximately 40% of pediatric cancer patients received radiotherapy as their initial cancer treatment (Jemal et al., 2009; Socie et al., 2000). In the past decade, the overall 5-year survival rate of pediatric cancer patients has increased to 80%. Higher survival rates have led to increased concerns about the risk of late effects from radiation (Robison et al., 2009; Davis et al., 1999). For instance, children with medulloblastoma who undergo craniospinal irradiation (CSI) have a 2–13% probability of developing a radiogenic cancer such as meningioma, ovarian leiomyosarcoma, glioblastoma, acute lymphoblastic leukemia, or rectal adenocarcinoma sometime after radiation therapy (Hope et al., 2006; Strojan et al., 2000; Stavrou et al., 2001; Fossati et al., 2009).
One complication of radiotherapy is that direct irradiation of the ovaries can lead to acute ovarian failure. A recent study found that 90% of patients whose ovaries received 14.4 Gy during whole-body irradiation experienced acute ovarian failure (Sauvat et al., 2009). In addition, irradiation of the ovaries can reduce the number of ovarian primordial follicles, which may lead to premature ovarian failure and subsequently to sterility. Wallace et al. (2003) determined that even a dose of 2 Gy can eradicate 50% of ovarian primordial follicles. Thus, radiotherapy for all premenopausal female patients should include efforts to carefully manage ovarian dose. Although many girls and young women undergo radiotherapy, to our knowledge no study has compared the risk of fertility complications after proton and photon therapies for central nervous system tumors.
The goal of this study was to compare the relative risk of premature ovarian failure (RRPOF) for three CSI radiotherapy modalities to predict which one would best preserve fertility. We used clinically realistic and physically complete radiation doses and the model of Wallace et al. (2005) to derive the RRPOF after conventional photon radiotherapy (CRT), intensity-modulated photon radiotherapy (IMRT), and passive-scattering proton radiotherapy (PRT). We also calculated the ratio of the relative risk of premature ovarian failure (RRRPOF) of PRT to CRT and IMRT.
2. Methods
2.1. Treatment planning
Treatment plans were created for an 11-year-old girl who was diagnosed with medulloblastoma and was treated at our institution with proton CSI to 23.4 Gy. The CRT, IMRT, and PRT treatment plans were created using a commercial treatment planning system (TPS) (Eclipse, version 8.9; Varian Medical Systems, Palo Alto, CA). The ovaries were delineated by a pediatric radiation oncologist on the patient’s planning computed tomography (CT) image using contouring tools in the TPS; these are referred to hereafter as the nominal ovaries. The anisotropic analytical algorithm was used for all photon dose calculations and the proton convolution superposition algorithm for all proton dose calculations. The TPS proton dose algorithm was previously validated (Newhauser et al., 2007). The TPS photon algorithm used in this study was previously validated following the methods of Das et al. (2008). Heterogeneity corrections were used for all dose calculations. The treatments were planned with the patient in the supine position. The plans had a high degree of clinical realism.
The clinical target volume (CTV) for all three treatment plans included the entire craniospinal fluid (CSF) space (the brain and spinal canal through the cauda equina to the level of the S2/S3 vertebral junction [fig. 1]). The total prescribed dose was 23.4 Gy relative biological effectiveness (St Clair et al., 2004), i.e., 21.3 Gy × 1.1 for the proton CSI treatment plan and 23.4 Gy × 1 for the photon CSI treatment plan. We used an RBE value of 1.1 for protons following the recommendations of the International Commission on Radiation Units and Measurements (ICRU, 2007) and in accordance with the clinical practice for PRT at our institution. All treatment plans were reviewed and approved by a board-certified radiation oncologist who specializes in pediatric radiotherapy.
Figure 1.
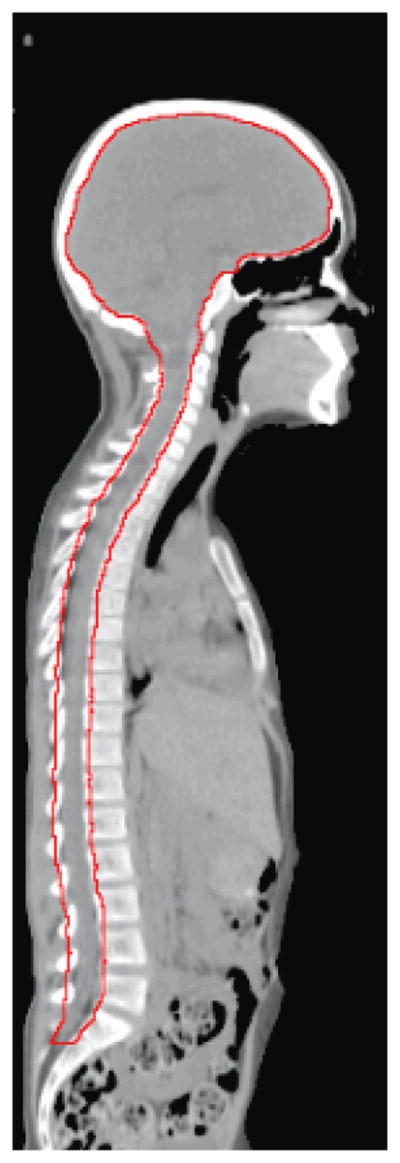
CTV (red contour) used to compare the dose delivered to the spinal cord and the brain from CSI using CRT, IMRT, and PRT.
2.1.1. CRT treatment plan
The CRT treatment plans were created following the methods described by Howell et al. (2012). A brief summary of these methods in provided here. At our institution, the standard of care for CRT for CSI is a field-in-field (FIF) technique. This technique was developed using the Pinnacle TPS and uses multiple lower-weighted reduction fields within the primary cranial and spinal field to decrease the size of the areas receiving the highest dose, resulting in a more conformal and homogeneous plan for the target volume (Yom et al., 2007). Our clinical FIF technique also uses modulation to create intrafraction field junctions. For this study, we modified our clinical FIF technique to use with the Eclipse TPS and used two interfraction field junctions instead of two intrafraction junctions (to simplify the treatment planning). The CRT treatment plan included two opposed 6-MV isocentric lateral cranial fields and a 6-MV isocentric posterior spinal field. The fields were defined, i.e., field sizes were selected and plans were normalized to ensure full coverage of the CTV, taking into account setup uncertainties. The width of the spinal field laterally covered the entire vertebral body with a 1-cm lateral margin on either side. The field was laterally defined using the lower jaws of the collimator and the multileaf collimator. The spinal field was normalized such that the 100% isodose surface covered the spinal canal with an additional 3-mm margin anteriorly. The cranial fields were defined such that the whole brain was irradiated, including the cervical region of the spinal cord. For the cranial fields, the multileaf collimator was used to block the eyes and the chin. After the initial field geometry was defined, two 0.5-cm junction shifts were added for each of the treatment fields by changing the Y-collimator border (superior–inferior field border) to feather the junctions between the cranial and spinal fields.
2.1.2. IMRT treatment plan
The IMRT plan included the two FIF cranial fields (described above) and five IMRT spinal fields. The IMRT fields were set at 140°, 160°, 180°, 200°, and 220° gantry angles, following Parker et al. (2007), to achieve coverage of the CTV and minimize dose to normal tissues, such as the lungs, kidneys, and heart. This arrangement minimized the volume of normal tissues through which the beams entered. A planning target volume (PTV) was defined to achieve coverage comparable to that of the CRT plan, namely, from T1 to the S2/S3 junction along the spinal axis and 1 cm laterally from the vertebral bodies, with full coverage extending 3 mm anteriorly to the spinal canal. The dose distribution was optimized using the inverse planning method. The optimization objectives were to deliver the prescribed dose to 100% of the PTV and to minimize the doses to normal tissues in close proximity to the target volume. For simplicity, junction shifts were omitted for this plan because the dose distribution at the field junction area was acceptably uniform.
In the original IMRT plan dose constraints were not specifically applied to reduce dose to the ovaries. Nevertheless, doses to the ovaries could potentially be decreased if they were included during the optimization process (assuming they were within or partially within the boundaries of the IMRT fields). To investigate the potential dose reduction that could be achieved by optimization, IMRT plans were created avoiding each ovary in turn. Specifically, we created an optimized IMRT plan for each set of ovaries that was within or partially within the treatment field (sets 1, 2, and 3; ovary sets are described in more detail below). No additional plans were created for the ovary sets that were outside the treatment fields.
2.1.3. PRT treatment plan
The PRT treatment plans were created following the methods of Giebeler et al. (manuscript in review), which are briefly reviewed here. In this study (and in accordance with clinical practice at our institution), we used an age-specific CTV for proton CSI treatment planning. For proton CSI patients treated at our institution, the CTV includes the entire CSF space, including the brain and the spinal cord. The CTV extended to the cauda equina to the level of the S2/S3 vertebral junction and was equivalent to the CTV for CRT or IMRT. For patients under the age of 15 years (i.e. who have not reached skeletal maturity), our protocol calls for an additional normal tissue target volume (NTTV), which includes the entire vertebral bodies. The rationale for this “is to avoid sharp dose gradients in the vertebral bodies in patients whose skeletons are still maturing” (Howell et al., 2012). Such sharp gradients could cause asymmetric growth of the vertebral body therefore the best alternative is to irradiate the whole vertebral body uniformly in these patients (St Clair et al., 2004; Brodin et al., 2011).
The PRT plan consisted of two opposed-lateral-oblique cranial fields, defined in the same way as those used for the CRT plan, and two posterior–anterior spinal fields. In accordance with ICRU recommendations (ICRU, 2007) and our clinical practice, lateral, proximal, and distal uncertainty margins were added on a field-by-field basis to ensure adequate coverage of the CTV (rather than using a single PTV). For this patient, the uncertainty margins were designed such that the CTV as well as the entire vertebral bodies (NTTV) received the full prescribed dose. The characteristics of the fields used for PRT are listed in table 1, including proton beam energy, spread-out Bragg peak width, gantry angle, and collimator dimensions. The treatment plan was similar to that from Taddei et al. (2010), except that two junction shifts were added to enhance clinical realism.
Table 1.
Characteristics of the fields used for proton craniospinal irradiation for an 11-year-old girl adapted from (Taddei et al. 2010)
| Characteristic | Spinal fields | Cranial fields | ||
|---|---|---|---|---|
|
| ||||
| LPA | UPA | RPO | LPO | |
| Pre-nozzle proton energy (MeV) | 160 | 160 | 200 | 200 |
| SOBP width (cm) | 7 | 6 | 16 | 16 |
| Gantry angle (°) | 180 | 180 | 255 | 105 |
| Collimated field, major axis (cm) | 19.8 | 15.7 | 15.9 | 15.9 |
| Collimated field, minor axis (cm) | 5.0 | 4.8 | 15.2 | 15.2 |
Abbreviations: LPA, lower posterior–anterior; LPO = left posterior oblique; RPO = right posterior oblique; UPA = upper posterior–anterior; SOBP = spread-out Bragg peak.
2.2. Determination of dose from stray radiation
Out-of-field (stray) doses, which are caused by leakage and scatter radiation, are not accurately calculated by the TPS for either photon or proton therapy. Instead, stray radiation doses from CRT and IMRT were determined using an analytical model, and stray radiation doses from PRT were calculated using Monte Carlo simulations.
2.2.1. Stray radiation dose from CRT and IMRT
In CRT and IMRT, the main components of stray radiation are scatter from the patient and leakage from the treatment head. Because 6-MV beams were used (below the threshold energy for photoneutron production), stray neutron doses for these modalities were not present. Based on direct comparison with thermoluminescent detector measurements in an anthropomorphic phantom, Howell et al. (2010) reported the underestimation of stray radiation dose as function of distance from the edge of the treatment field for irradiations using the same beam energy, linac type, and dose calculation algorithm used in this work, i.e., a 6-MV Varian Clinac linac equipped with a Millennium multileaf collimator and the Eclipse analytical anisotropic algorithm (AAA) dose algorithm; in fact we used the same treatment planning computer (with the exact same 6 MV-beam model) as was used for in the study by Howell et al. (2010). We applied a quadratic fit to the data of Howell et al. (2010) (figure 2) to extract a formulaic relationship between underestimation of dose and distance from the field edge. Then, we used this relationship to estimate a correction factor for the organ dose from stray radiation as a function of the distance from the organ centroid to the edge of the radiation field. We applied this correction factor to the stray radiation dose reported by the TPS to obtain the corrected stray radiation dose for the CRT and IMRT plans.
Figure 2.

A quadratic fit was applied to the TPS underestimation data from Howell et al. (2010) as a function of distance from the edge of the radiation field. This fit was used to estimate the percentage by which the TPS underestimates the stray radiation dose to the ovaries for the CRT and IMRT plans.
2.2.2. Stray radiation dose from PRT
Stray radiation in passively scattered PRT is due to secondary neutrons arising from proton-induced nuclear reactions occurring in the treatment head (external neutrons) and within the patient (internal neutrons) (Taddei et al., 2008; Zheng et al., 2008; Agosteo et al., 2008; Perez-Andujar et al., 2009). Because the TPS does not account for the dose from stray neutrons, we used a Monte Carlo code to calculate that value. A model of the proton nozzle used for this patient’s treatment was previously developed (Newhauser et al., 2007) using the Monte Carlo N-Particle eXtended (MCNPX v2.7c ) code (Pelowitz, 2005). The treatment nozzle modeled with MCNPX was previously benchmarked by comparison with measurements (Titt et al., 2008). To ensure that the proton nozzle was correctly configured for the patient’s treatment, we used in-house software (Newhauser et al., 2008) to automatically create the input files for the Monte Carlo simulations based on the PRT treatment plan described in section 2.1.3. The commercial TPS stores treatment plans using the standard Digital Imaging and Communications in Medicine Radiotherapy (DICOM-RT) format. The in-house software used a preprocessing code to read the DICOM-RT file for the PRT plan and parse the information needed to create the Monte Carlo input files corresponding to each defined configuration of the proton nozzle. This information included characteristics such as the position and dimensions of the collimator, the size of the air gap between the end of the snout and the proximal surface of the patient, the snout angle, the type of scatter foil, and the energy degrader used. The in-house software also converted patient CT data from the DICOM-RT format to the Monte Carlo input format (Taddei et al., 2009; Newhauser et al., 2009). A voxelized phantom was used to represent the patient in the geometric model. Absorbed doses were calculated separately for external and internal neutrons. External neutrons were defined as those originating in the treatment head (outside the patient), whereas internal neutrons were those originating within the patient. The neutron absorbed dose was calculated by using the Monte Carlo code to determine the energy deposited per mass in each tissue voxel representing the organs.
The neutron absorbed dose D was used to calculate the equivalent dose H according to:
| (1) |
where w̄R is the mean radiation weighting factor for neutrons. In a previous study (Newhauser et al., 2009), we estimated the w̄R values for internal neutrons for a child’s proton CSI treatment for organs superior and inferior to the junction of the T8 and T9 vertebrae. We used the same w̄R value for internal neutrons as Newhauser et al. (2009) (w̄R =9.93) and for external neutrons we used the values presented by Taddei et al. (2010) (w̄R =9.75), as this patient’s proton CSI treatment was very similar to that of their study. In their study w̄R was calculated as:
| (2) |
where Φ is the neutron spectral fluence and wR is the neutron radiation weighting factor according to the procedure from International Commission on Radiological Protection (ICRP) Publication 92 (ICRP, 2003) given in equation (3). w̄R depends on neutron energy (En):
| (3) |
2.3. Ratio of relative risk of premature ovarian failure
The percentage of primordial follicles killed, g(H), as a result of each treatment was predicted on the basis of the model proposed by Wallace et al. (2005) as:
| (4) |
where H is the equivalent dose received by the ovaries during treatment. This model was originally defined in terms of absorbed dose, but to compare the doses received by the ovaries during photon and proton treatments, we used equivalent dose instead.
The RRPOF value for each modality was taken as the fraction of primordial follicles killed (Eq. 4) by an equivalent dose H to the ovaries from the entire course of CSI, that is, the total for both primary and stray radiation.
The RRRPOF of photon to proton CSI was calculated for each photon modality. Specifically, RRRPOF was defined as:
| (5) |
where RRCRT, RRIMRT, and RRPRT are the relative risks associated with CRT, IMRT, and PRT, respectively. If RRRPOF = 1, the two modalities confer an equal risk of POF. If RRR POF > 1, then CRT and/or IMRT are associated with a higher risk of POF than PRT.
2.5. Sensitivity of RRRPOF to ovarian position
In the study of the sensitivity of RRRPOF to ovarian position, a pediatric radiation oncologist contoured the nominal size and position of the ovaries on the treatment planning CT images. However, delineating the ovaries on a CT image is challenging because this organ is not readily visualized. Thus, there was considerable uncertainty in the contoured size and location of the ovaries. In addition, the position of the ovaries within the pelvis varies between patients (Bardo et al., 2009). To evaluate the impact of the uncertainty in the position of the contoured ovaries on our results, we considered several possible variations of the ovaries’ positions. These variations were based on data reported by Bardo et al. (2009), who examined the CT images of 174 girls and determined the positions of their ovaries with respect to body landmarks (symphysis pubis, iliac crest, and anterior superior iliac spine). Their study revealed complexities associated with ovarian location in young patients and how location varies with age. Five ovary positions (in addition to the nominal position of the ovaries) were defined for the patient in this study. These positions corresponded to the mean, mean ± 1 standard deviation, and the extreme locations reported by Bardo et al. (2009) for the age group that contained 11-year-old girls. The ovary positions considered are shown in figure 3. The relative positions and the volumes of the five sets of ovaries are presented in table 2. Each set of ovaries was contoured on four axial slices of the CT scan (slice thickness was 2.5 mm). The total “length” of the ovaries was 1 cm, corresponding to ± 0.5 cm superior and inferior to the ovary centroid. To test the sensitivity of RRRPOF to the position of the ovaries, we calculated RRRPOF for each of the five sets of ovaries and compared those values with the RRRPOF values obtained using the nominal ovarian position.
Figure 3.
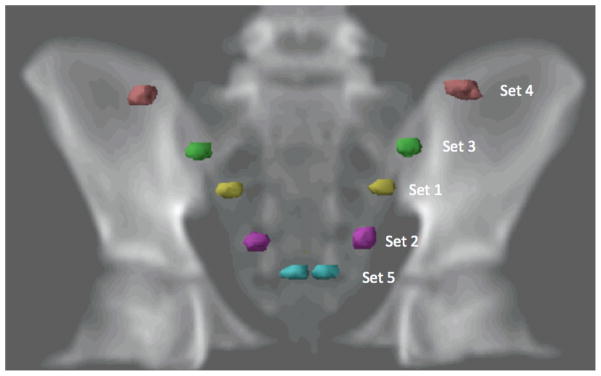
Digital radiograph showing the positions of the 5 sets of ovaries used to evaluate the sensitivity of RRRPOF to ovarian position.
Table 2.
Position and volume of 5 sets of ovaries used to test the sensitivity of the relative risk of premature ovarian failure (RRRPOF) to the position of the ovaries.
| Ovary seta | ±x (cm)b | ±y (cm)c | Volume (cm3)d |
|---|---|---|---|
| 1 | 41.6 | 51.6 | 1030 |
| 2 | 63.1 | 62.0 | 1430 |
| 3 | 23.8 | 40.9 | 1250 |
| 4 | 2.5 | 15.2 | 1450 |
| 5 | 75.0 | 100.2 | 750 |
Positions of the ovaries are based on the data of Bardo et al. (2009).
x is the distance from the iliac crest of the pelvis to the superior part of the ovary.
y is the distance from the anterior superior iliac spine of the pelvis to the lateral part of the ovary.
Note that the ovaries defined here have volumes that are similar to those of the nominal ovaries.
3. Results
3.1. Comparison of therapeutic dose
Figure 4 shows the dose distributions from photon and proton CSI. The prescribed dose was delivered to 100% of the CTV for each treatment modality. Normal tissues in close proximity to the CTV received considerably higher doses from CSI delivered with CRT than with IMRT or PRT. Dose-volume histograms for the CTV, esophagus, heart, kidneys, liver, and lungs are shown in figure 5. The data presented in figures 4 and 5 were taken directly from the TPS and therefore do not include stray neutrons from PRT and underestimated low-dose portions of the dose-volume histograms (i.e., <5% of the prescribed dose for CRT and IMRT).
Figure 4.

Dose distributions from CRT (left), IMRT (center), and PRT (right).
Figure 5.

Dose-volume histograms to compare the CRT (a), IMRT (b), and PRT (c) plans for various contoured organs, including the CTV, esophagus, heart, kidneys, liver, and lungs.
3.2. Equivalent dose delivered to ovaries at nominal positions
Equivalent doses received by the nominal ovaries from CRT, IMRT, and PRT are listed in table 3. More specifically, the minimum, maximum, and mean equivalent doses (H) from therapeutic radiation field reported by the TPS are shown, as well as the sum of the dose from the TPS and the dose from stray radiation. The values are listed for therapeutic equivalent dose only and for the sum of the therapeutic and stray components. The mean equivalent doses, including stray equivalent doses, received by the nominal ovaries during CRT (0.8 Sv) was 4 times that of PRT (0.2 Sv), and that of IMRT (0.5 Sv) was 2.5 times that of PRT. Neutrons predominated the equivalent dose delivered to structures adjacent to the treatment fields for PRT. Figure 6 shows the neutron equivalent doses from PRT. Equivalent doses from external neutrons ranged from 0.04 Sv to 0.4 Sv, and those from internal neutrons ranged from 0.2 Sv to 2 Sv.
Table 3.
Equivalent doses received by the nominal ovaries from CRT, IMRT, and PRT. The minimum, maximum, and mean equivalent doses (H) from the therapeutic radiation field reported by the TPS are shown, as is the sum of the dose from the TPS and the dose from stray radiation.
| Treatment modality | Equivalent dose (Sv) | |||||
|---|---|---|---|---|---|---|
|
|
|
|||||
| Hmin | Hmax | Hmean | Hmin + Hstray | Hmax + Hstray | Hmean + Hstray | |
|
|
|
|||||
| CRT | 0.5 | 0.7 | 0.6 | 0.6 | 0.9 | 0.8 |
| IMRT | 0.4 | 0.6 | 0.4 | 0.5 | 0.8 | 0.5 |
| PRT | 0 | 0.002 | 0.001 | 0.2 | 0.3 | 0.2 |
Abbreviations: CRT = conventional photon radiotherapy; IMRT = intensity-modulated photon radiotherapy; PRT = proton radiotherapy; TPS = treatment planning system.
Figure 6.
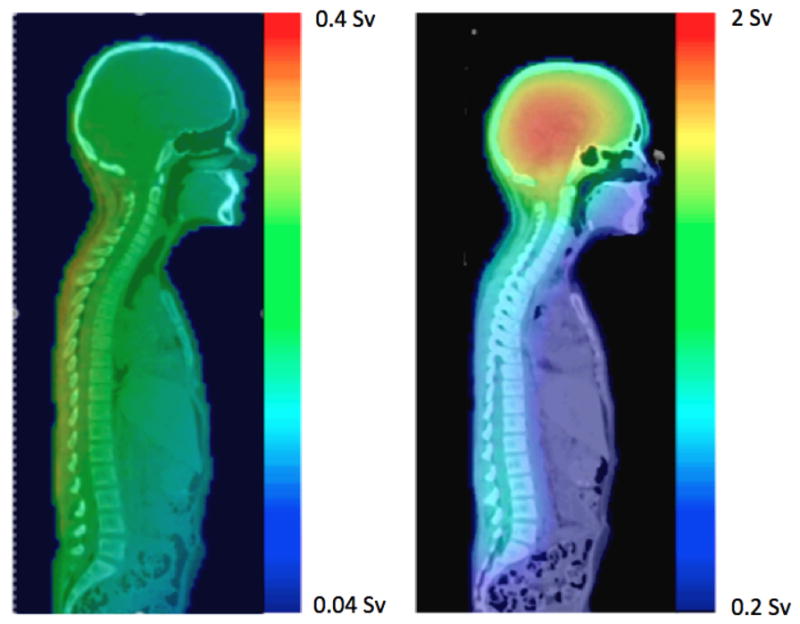
The neutron equivalent doses delivered during PRT, from external neutrons (left) and internal neutrons (right).
3.3. Sensitivity of RRRPOF to ovarian position
Table 4 summarizes the equivalent dose in the ovaries at different positions in the pelvis. This table includes equivalent doses calculated by the TPS and the contributions from therapeutic and stray radiation. The discussion below focuses on total equivalent doses. The highest mean equivalent dose from IMRT, 5.5 Sv, was received by ovary set 1, whereas the highest mean equivalent dose from CRT, 6.6 Sv, was received by set 2. The mean equivalent dose in the ovaries from PRT stayed fairly constant for all sets (ranging from 0.25 Sv to 0.40 Sv). The lowest equivalent doses received by all sets of ovaries were from PRT, including doses from internal and external neutrons. Set 3 received a slightly higher dose from PRT than the other sets, a consequence of the proximity of this ovary set to the treatment field edge.
Table 4.
Mean equivalent dose (H) received from CRT, IMRT, and PRT by the 5 sets of ovaries contoured for the sensitivity test. The mean equivalent dose from therapeutic radiation reported by the TPS is shown as well as the sum of the dose from the TPS and the dose from stray radiation.
| Ovary set | H (Sv)a
|
|||||
|---|---|---|---|---|---|---|
| Therapeutic (reported by TPS)
|
Therapeutic + stray
|
|||||
| CRT | IMRT | PRT | CRT | IMRT | PRT | |
|
|
|
|||||
| 1 | 0.6 | 5.5 | 0.001 | 0.60 | 5.50 | 0.34 |
| 2 | 5.3 | 4.2 | 0.001 | 6.64 | 4.20 | 0.29 |
| 3 | 1.2 | 2.7 | 0.06 | 1.50 | 2.70 | 0.40 |
| 4 | 0.6 | 0.4 | 0.001 | 0.77 | 0.50 | 0.33 |
| 5 | 0.8 | 0.8 | 0.001 | 1.01 | 0.80 | 0.25 |
In the calculations, we used an average value of the radiation weighting factor, w̄R = 9.75 for external neutrons and w̄R = 9.93 for internal neutrons
Abbreviations: CRT = conventional photon radiotherapy; IMRT = intensity-modulated photon radiotherapy; PRT = proton radiotherapy; TPS = treatment planning system.
The predicted percentages of primordial follicles killed as a result of CRT, IMRT, and PRT, taking into account both therapeutic and stray mean equivalent dose, are listed in table 5. Our results reveal that PRT had a lower predicted RRPOF than CRT or IMRT for all sets of ovaries, regardless of uncertainties in ovarian location.
Table 5.
Predicted percentage of primordial follicles killed as a result of CRT, IMRT, and PRT for the 5 sets of ovaries used in the sensitivity test. Also listed are values of the ratio of relative risk of premature ovarian failure (RRRPOF).
| Ovary Set | Primordial follicles killed (%)a | RRRPOF | ||||
|---|---|---|---|---|---|---|
|
| ||||||
| CRT | IMRT | PRT |
|
|
||
| Nominal | 23.09 | 15.86 | 7.71 | 3.00 | 2.06 | |
| 1 | 18.72 | 85.04 | 10.98 | 1.71 | 7.75 | |
| 2 | 89.89 | 76.56 | 9.38 | 9.58 | 8.16 | |
| 3 | 40.51 | 60.64 | 12.96 | 3.13 | 4.68 | |
| 4 | 23.24 | 15.89 | 10.57 | 2.18 | 1.49 | |
| 5 | 29.38 | 24.14 | 8.40 | 3.50 | 2.87 | |
The percentages of primordial follicles killed were calculated by using the sum of the therapeutic dose (predicted by the TPS) and the stray radiation dose
Abbreviations: CRT = conventional photon radiotherapy; IMRT = intensity-modulated photon radiotherapy; PRT = proton radiotherapy; TPS = treatment planning system.
3.4 IMRT optimization effects on RRRPOF
For these test cases in which the ovaries were considered during optimization, we found that the dose to the ovaries could be substantially decreased (with no change in PTV coverage). Data for these test cases are presented in figure 7, which compares the DVHs for ovary sets 1, 2, and 3 from the corresponding optimized treatment plans. The proportions of primordial follicles predicted to be killed based on optimized IMRT plans were 39%, 47%, and 33% for ovary sets 1, 2, and 3, respectively, a factor of 2 less than when the ovaries were not considered during optimization. Correspondingly, the optimized plans resulted in RRRPOF values that were decreased by a factor of 2.2, 1.6, and 1.8 for ovary sets 1, 2, and 3, respectively.
Figure 7.

Dose-volume histogram data for the original plan and plans optimized to spare the ovaries Plans were optimized to spare ovary sets 1 (a), 2 (b), and, 3 (c).
4. Discussion and conclusion
In this study, we quantified RRRPOF to compare three radiotherapy techniques. Our finding that RRRPOF > 1 when comparing CRT or IMRT to PRT indicates that PRT may reduce the risk of fertility complications relative to CRT or IMRT. We also studied the sensitivity of RRRPOF to variations in the anatomic position of the ovaries. Our finding that RRRPOF > 1 for all the various ovary positions studied here, even when we included contributions from external and internal neutrons, again suggests that PRT carries lower risk of these complications.
For the patient studied here, we found that the predicted RRPOF was highest for the sets of ovaries within the radiation field or closest to it for CRT and IMRT and that the further away from the radiation field the ovaries were, the lower the percentage of primordial follicles killed. Nevertheless, we cannot draw a definitive conclusion about how RRRPOF varies with the position of the ovaries for the larger population of girls and young women who receive CSI. In particular, patients of different ages should be studied to identify whether there is a correlation between the position of the ovaries and RRRPOF.
There was also some uncertainty in the true location of the ovaries because they were delineated using the patient’s CT images. While accurate delineation of the ovaries can be achieved by fusing the CT with a magnetic resonance image (MRI), no such images were available for this patient. Furthermore, magnetic resonance imaging is not generally available for CSI treatment planning because it is not routinely done at our institution (or most other centers) for CSI treatment planning. Nevertheless, we have accounted for uncertainty in the RRPOF that is related to uncertainty in the ovary position by considering various possible alternative ovary positions.
The results of this study emphasize that the dose received by the ovaries varies strongly with their proximity to the therapeutic field edge for both CRT and IMRT. However, the total dose equivalent used a correction factor that was calculated based on the distance of the centroid of the ovaries to the field edge, which introduced a small amount of uncertainty in the dose equivalent. Based on the deviation of 0.5 cm between the most superior and inferior aspects of the ovaries from the centroid, we calculated a maximum deviation of 0.7% of the dose, which translates to a maximum uncertainty in RRRPOF of 0.9%.
For photon therapy, our study suggests that for patients whose ovaries are partially within the treatment field, efforts should be made to reduce the dose to the ovaries. In particular, we found that considering the ovaries as an avoidance structure during IMRT optimization substantially reduced ovarian dose. However, such efforts are only possible if the true location of the ovaries is actually known. Recently, Gay et al. (2012) recommended use of MRI for contouring the ovaries and other reproductive organs such as the uterus, cervix, and fallopian tubes. This study seems to confirm the importance of that recommendation and highlights the potential role of such imaging in reducing dose to the ovaries.
There is also some uncertainly in the calculation of the equivalent dose, which depends on the absorbed dose calculated by the TPS, the Monte Carlo simulation of stray neutron dose, and the calculation of w̄R. The uncertainty in the in-field doses calculated by the TPS is relatively small (about 2% based on the commissioning of the TPS) in the context of this study. The uncertainty in the calculation of the neutron dose with MCNPX is due to the statistical error associated with the mean equivalent dose values. This was found to be <5% (at one standard deviation). This error is associated with the random fluctuations in the results of the Monte Carlo code and not with the systematic uncertainty of the equivalent dose value.
Uncertainties in the w̄R calculation are much larger than for the other two factors and therefore have a greater potential impact on the results of this study. Based on the large uncertainty in w̄R, we performed a sensitivity test in order to determine the influence of w̄R on the results shown in this work, following the approach of Newhauser et al. (2009). The value of w̄R was varied from 5 to 50. For the nominal ovaries, protons still represent lower RRRPOF for wR<25 when compared with CRT and IMRT. When w̄R =25 the RRRPOF for IMRT is 0.87, showing that in this case PRT could have a higher RRRPOF. For 25< w̄R < 50, the apparent advantage of PRT in terms of RRRPOF was diminished. We conclude that if w̄R is truly higher than 25, then the advantage of protons in terms of dose delivered to the ovaries could be diminished. However, the advantage of protons in sparing other normal tissue during CSI would still exist.
Finally, for completeness, we predicted the age of ovarian failure on the basis of the dose the ovaries received for the patient evaluated here. In the worst-case scenario, her ovaries received an equivalent dose of 6.64 Sv. Using the model of Wallace et al. (2005), we predicted that after radiotherapy her ovaries would have approximately the same number of primordial follicles as the ovaries of a healthy unirradiated 35-year-old woman, which would lead to ovarian failure in our patient at an attained age of 26 years. Although the uncertainties in this calculation are large and difficult to estimate, the qualitative finding clearly strengthens the rationale to decrease RRPOF after radiotherapy by decreasing the radiation received by the ovaries during radiotherapy. This could be done in various ways. Unfertilized follicles could be preserved by removing them from the ovaries before treatment, preserving them, and then reimplanting the follicles into the ovaries after treatment. Other possibilities are performing ovarian transposition before treatment and adding shielding during the treatment (Lee et al., 2006; Sauvat et al., 2009; Wo and Viswanathan, 2009). However, each of these methods has some limitations. Preservation of follicles might not be viable for very young girls, and it is an invasive procedure (Lee et al., 2006). Ovarian transposition is also an invasive procedure, and sometimes ovarian function is not fully recovered after transposition (Sauvat et al., 2009). Finally, some studies show that although shielding can decrease the dose to the ovaries, they might still receive enough dose to affect their function (Covens et al., 1996).
An ideal radiotherapy technique would deliver the efficacious treatment without posing any risk to the ovaries. This study presented a tool to interpret ovarian dose and may help in making a decision about which radiotherapy technique is most suitable for treating a particular girl or young woman, depending on ovary location and other factors. To the best of our knowledge, this is the first in silico study to compare RRPOF between photon and proton modalities. Numerous studies have evaluated how radiation may affect female patients, but no prior study has determined whether predicted or observed POF is lower for a particular radiotherapy technique. Because of ethical and other considerations, it is unlikely that an in vivo prospective randomized trial will ever be conducted to quantify fertility outcomes that differ with the treatment modality. Therefore, in silico studies appear to be an attractive alternative to assess this issue. We hope that this work encourages more studies of this kind and that more data are produced to enable a better understanding of how dose to the ovaries and other reproductive organs are affected by the radiotherapy technique. In addition, dosimetric measurements would be desirable to determine the exact dose received by ovaries and to enable a better assessment of RRPOF.
In conclusion, we estimated RRRPOF for CSI using CRT, IMRT, and PRT for an 11-year-old girl. The RRRPOF for the nominal ovaries was highest for CRT and lowest for PRT. We also evaluated the sensitivity of RRRPOF to the position of the ovaries. We found that the RRPOF was highest for the sets of ovaries within the radiation field for CRT and IMRT. In addition, we found that PRT had the lowest RRPOF for the nominal ovaries as well the other ovarian positions we evaluated.
Table 6.
Ratio of relative risk of premature ovarian failure (RRRPOF) for w̄R sensitivity test. All values were calculated for the nominal ovaries. w̄R was assumed to be the same for the internal and external neutrons.
| w̄R |
|
|
||
|---|---|---|---|---|
| 5 | 5.69 | 3.91 | ||
| 10 | 2.96 | 2.03 | ||
| 15 | 2.02 | 1.14 | ||
| 25 | 1.26 | 0.87 | ||
| 50 | 0.69 | 0.48 |
Acknowledgments
We acknowledge Ms. Kathryn Carnes for assistance in editing this manuscript. This research was supported in part by the National Cancer Institute award 1R01CA131463-01A1 (W.D. Newhauser, Ph.D., P.I.) and a subcontract of that award (R.M. Howell, Ph.D., P.I); by the National Institutes of Health through the MD Anderson Cancer Center Support Grant CA016672; by Northern Illinois University through a subcontract of the US Department of Defense (award W81XWH-08-1-0205, J. Lewis, Ph.D., P.I.; W D. Newhauser, Ph.D., P.I. of subcontract; and by the Fogarty International Center award K01TW008409 (Phillip J. Taddei, Ph.D.)
References
- Agosteo S, Rollet S, Silari M, Theis C. Dosimetry in radiation fields around high-energy proton accelerators. Radiation Measurements. 2008;43:1024–32. doi: 10.1093/rpd/nci089. [DOI] [PubMed] [Google Scholar]
- Bardo DM, Black M, Schenk K, Zaritzky MF. Location of the ovaries in girls from newborn to 18 years of age: reconsidering ovarian shielding. Pediatr Radiol. 2009;39:253–9. doi: 10.1007/s00247-008-1094-4. [DOI] [PubMed] [Google Scholar]
- Brodin NP, Rosenschold PM, Aznar MC, Kiil-Berthelsen A, Vogelius IR, Nilsson P, Lannering B, Bjork-Eriksson T. Radiobiological risk estimates of adverse events and secondary cancer for proton and photon radiation therapy of pediatric medulloblastoma. Acta Oncol. 2011;50:806–16. doi: 10.3109/0284186X.2011.582514. [DOI] [PubMed] [Google Scholar]
- Covens AL, van der Putten HW, Fyles AW, Leung PM, O’Brien PF, Murphy KJ, DePetrillo AD. Laparoscopic ovarian transposition. Eur J Gynaecol Oncol. 1996;17:177–82. [PubMed] [Google Scholar]
- Das IJ, Cheng CW, Watts RJ, Ahnesjo A, Gibbons J, Li XA, Lowenstein J, Mitra RK, Simon WE, Zhu TC. Accelerator beam data commissioning equipment and procedures: Report of the TG-106 of the Therapy Physics Committee of the AAPM. Medical Physics. 2008;35:4186–215. doi: 10.1118/1.2969070. [DOI] [PubMed] [Google Scholar]
- Davis FG, McCarthy BJ, Freels S, Kupelian V, Bondy ML. The conditional probability of survival of patients with primary malignant brain tumors: surveillance, epidemiology, and end results (SEER) data. Cancer. 1999;85:485–91. [PubMed] [Google Scholar]
- Fossati P, Ricardi U, Orecchia R. Pediatric medulloblastoma: toxicity of current treatment and potential role of protontherapy. Cancer Treat Rev. 2009;35:79–96. doi: 10.1016/j.ctrv.2008.09.002. [DOI] [PubMed] [Google Scholar]
- Gay HA, Barthold HJ, O’Meara E, Bosch WR, El Naqa I, Al-Lozi R, Rosenthal SA, Lawton C, Lee WR, Sandler H, Zietman A, Myerson R, Dawson LA, Willett C, Kachnic LA, Jhingran A, Portelance L, Ryu J, Small W, Jr, Gaffney D, Viswanathan AN, Michalski JM. Pelvic normal tissue contouring guidelines for radiation therapy: a Radiation Therapy Oncology Group consensus panel atlas. International journal of radiation oncology, biology, physics. 2012;83:e353–62. doi: 10.1016/j.ijrobp.2012.01.023. [DOI] [PMC free article] [PubMed] [Google Scholar]
- Hope AJ, Mansur DB, Tu PH, Simpson JR. Metachronous secondary atypical meningioma and anaplastic astrocytoma after postoperative craniospinal irradiation for medulloblastoma. Childs Nerv Syst. 2006;22:1201–7. doi: 10.1007/s00381-006-0062-2. [DOI] [PubMed] [Google Scholar]
- Howell RM, Giebeler A, Koontz-Raisig W, Mahajan A, Etzel CJ, D’Amelio AM, Jr, Homann KL, Newhauser WD. Comparison of therapeutic dosimetric data from passively scattered proton and photon craniospinal irradiations for medulloblastoma. Radiat Oncol. 2012;7:116. doi: 10.1186/1748-717X-7-116. [DOI] [PMC free article] [PubMed] [Google Scholar]
- Howell RM, Scarboro SB, Kry SF, Yaldo DZ. Accuracy of out-of-field dose calculations by a commercial treatment planning system. Physics in medicine and biology. 2010;55:6999–7008. doi: 10.1088/0031-9155/55/23/S03. [DOI] [PMC free article] [PubMed] [Google Scholar]
- ICRP. ICRP Publication 92:Relative Biological Effectiveness (RBE), Quality Factor (Q), and Radiation Weighting Factor (wR) Oxford: International Commission on Radiological Protection; 2003. [DOI] [PubMed] [Google Scholar]
- ICRU . Prescribing, Recording, and Reporting Proton-Beam Therapy. International Commission on Radiation Units and Measurements; Bethesda, MD: 2007. [Google Scholar]
- Jemal A, Siegel R, Ward E, Hao Y, Xu J, Thun MJ. Cancer statistics,. 2009. CA Cancer J Clin. 2009;59:225–49. doi: 10.3322/caac.20006. [DOI] [PubMed] [Google Scholar]
- Lee SJ, Schover LR, Partridge AH, Patrizio P, Wallace WH, Hagerty K, Beck LN, Brennan LV, Oktay K. American Society of Clinical Oncology recommendations on fertility preservation in cancer patients. Journal of clinical oncology: official journal of the American Society of Clinical Oncology. 2006;24:2917–31. doi: 10.1200/JCO.2006.06.5888. [DOI] [PubMed] [Google Scholar]
- Newhauser W, Fontenot J, Zheng Y, Polf J, Titt U, Koch N, Zhang X, Mohan R. Monte Carlo simulations for configuring and testing an analytical proton dose-calculation algorithm. Physics in medicine and biology. 2007;52:4569–84. doi: 10.1088/0031-9155/52/15/014. [DOI] [PubMed] [Google Scholar]
- Newhauser WD, Fontenot JD, Mahajan A, Kornguth D, Stovall M, Zheng Y, Taddei PJ, Mirkovic D, Mohan R, Cox JD, Woo S. The risk of developing a second cancer after receiving craniospinal proton irradiation. Phys Med Biol. 2009;54:2277–91. doi: 10.1088/0031-9155/54/8/002. [DOI] [PMC free article] [PubMed] [Google Scholar]
- Newhauser WD, Zheng Y, Taddei PJ, Mirkovic D, Fontenot JD, Giebeler A, Zhang R, Titt U, Mohan R. Transactions of the American Nuclear Society. 2008. Monte Carlo Proton Radiation Therapy Planning Calculations. [Google Scholar]
- Parker W, Filion E, Roberge D, Freeman CR. Intensity-modulated radiotherapy for craniospinal irradiation: target volume considerations, dose constraints, and competing risks. Int J Radiat Oncol Biol Phys. 2007;69:251–7. doi: 10.1016/j.ijrobp.2007.04.052. [DOI] [PubMed] [Google Scholar]
- Pelowitz DBE, editor. MCNPX User’s Manual Version 2.5.0 LA-CP-05-0369. Los Alamos, NM: Los Alamos National Laboratory; 2005. [Google Scholar]
- Perez-Andujar A, Newhauser WD, Deluca PM. Neutron production from beam-modifying devices in a modern double scattering proton therapy beam delivery system. Phys Med Biol. 2009;54:993–1008. doi: 10.1088/0031-9155/54/4/012. [DOI] [PMC free article] [PubMed] [Google Scholar]
- Robison LL, Armstrong GT, Boice JD, Chow EJ, Davies SM, Donaldson SS, Green DM, Hammond S, Meadows AT, Mertens AC, Mulvihill JJ, Nathan PC, Neglia JP, Packer RJ, Rajaraman P, Sklar CA, Stovall M, Strong LC, Yasui Y, Zeltzer LK. The Childhood Cancer Survivor Study: a National Cancer Institute-supported resource for outcome and intervention research. J Clin Oncol. 2009;27:2308–18. doi: 10.1200/JCO.2009.22.3339. [DOI] [PMC free article] [PubMed] [Google Scholar]
- Sauvat F, Binart N, Poirot C, Sarnacki S. Preserving fertility in prepubertal children. Horm Res. 2009;71(Suppl 1):82–6. doi: 10.1159/000178045. [DOI] [PubMed] [Google Scholar]
- Socie G, Curtis RE, Deeg HJ, Sobocinski KA, Filipovich AH, Travis LB, Sullivan KM, Rowlings PA, Kingma DW, Banks PM, Travis WD, Witherspoon RP, Sanders J, Jaffe ES, Horowitz MM. New malignant diseases after allogeneic marrow transplantation for childhood acute leukemia. J Clin Oncol. 2000;18:348–57. doi: 10.1200/JCO.2000.18.2.348. [DOI] [PubMed] [Google Scholar]
- St Clair WH, Adams JA, Bues M, Fullerton BC, La Shell S, Kooy HM, Loeffler JS, Tarbell NJ. Advantage of protons compared to conventional X-ray or IMRT in the treatment of a pediatric patient with medulloblastoma. International journal of radiation oncology, biology, physics. 2004;58:727–34. doi: 10.1016/S0360-3016(03)01574-8. [DOI] [PubMed] [Google Scholar]
- Stavrou T, Bromley CM, Nicholson HS, Byrne J, Packer RJ, Goldstein AM, Reaman GH. Prognostic factors and secondary malignancies in childhood medulloblastoma. J Pediatr Hematol Oncol. 2001;23:431–6. doi: 10.1097/00043426-200110000-00008. [DOI] [PubMed] [Google Scholar]
- Strojan P, Popovic M, Jereb B. Secondary intracranial meningiomas after high-dose cranial irradiation: report of five cases and review of the literature. Int J Radiat Oncol Biol Phys. 2000;48:65–73. doi: 10.1016/s0360-3016(00)00609-x. [DOI] [PubMed] [Google Scholar]
- Taddei PJ, Fontenot JD, Zheng Y, Mirkovic D, Lee AK, Titt U, Newhauser WD. Reducing stray radiation dose to patients receiving passively scattered proton radiotherapy for prostate cancer. Physics in medicine and biology. 2008;53:2131–47. doi: 10.1088/0031-9155/53/8/009. [DOI] [PMC free article] [PubMed] [Google Scholar]
- Taddei PJ, Mahajan A, Mirkovic D, Zhang R, Giebeler A, Kornguth D, Harvey M, Woo S, Newhauser WD. Predicted risks of second malignant neoplasm incidence and mortality due to secondary neutrons in a girl and boy receiving proton craniospinal irradiation. Physics in medicine and biology. 55:7067–80. doi: 10.1088/0031-9155/55/23/S08. [DOI] [PMC free article] [PubMed] [Google Scholar]
- Taddei PJ, Mahajan A, Mirkovic D, Zhang R, Giebeler A, Kornguth D, Harvey M, Woo S, Newhauser WD. Predicted risks of second malignant neoplasm incidence and mortality due to secondary neutrons in a girl and boy receiving proton craniospinal irradiation. Physics in Medicine and Biology. 2010;55:7067–80. doi: 10.1088/0031-9155/55/23/S08. [DOI] [PMC free article] [PubMed] [Google Scholar]
- Taddei PJ, Mirkovic D, Fontenot JD, Giebeler A, Zheng Y, Kornguth D, Mohan R, Newhauser WD. Stray radiation dose and second cancer risk for a pediatric patient receiving craniospinal irradiation with proton beams. Physics in medicine and biology. 2009;54:2259–75. doi: 10.1088/0031-9155/54/8/001. [DOI] [PMC free article] [PubMed] [Google Scholar]
- Titt U, Sahoo N, Ding X, Zheng Y, Newhauser WD, Zhu XR, Polf JC, Gillin MT, Mohan R. Assessment of the accuracy of an MCNPX-based Monte Carlo simulation model for predicting three-dimensional absorbed dose distributions. Physics in medicine and biology. 2008;53:4455–70. doi: 10.1088/0031-9155/53/16/016. [DOI] [PMC free article] [PubMed] [Google Scholar]
- Wallace WH, Thomson AB, Kelsey TW. The radiosensitivity of the human oocyte. Hum Reprod. 2003;18:117–21. doi: 10.1093/humrep/deg016. [DOI] [PubMed] [Google Scholar]
- Wallace WH, Thomson AB, Saran F, Kelsey TW. Predicting age of ovarian failure after radiation to a field that includes the ovaries. Int J Radiat Oncol Biol Phys. 2005;62:738–44. doi: 10.1016/j.ijrobp.2004.11.038. [DOI] [PubMed] [Google Scholar]
- Wo JY, Viswanathan AN. Impact of radiotherapy on fertility, pregnancy, and neonatal outcomes in female cancer patients. Int J Radiat Oncol Biol Phys. 2009;73:1304–12. doi: 10.1016/j.ijrobp.2008.12.016. [DOI] [PMC free article] [PubMed] [Google Scholar]
- Yom SS, Frija EK, Mahajan A, Chang E, Klein K, Shiu A, Ohrt J, Woo S. Field-in-field technique with intrafractionally modulated junction shifts for craniospinal irradiation. International Journal of Radiation Oncology Biology Physics. 2007;69:1193–8. doi: 10.1016/j.ijrobp.2007.04.062. [DOI] [PubMed] [Google Scholar]
- Zheng Y, Fontenot J, Taddei P, Mirkovic D, Newhauser W. Monte Carlo simulations of neutron spectral fluence, radiation weighting factor and ambient dose equivalent for a passively scattered proton therapy unit. Physics in medicine and biology. 2008;53:187–201. doi: 10.1088/0031-9155/53/1/013. [DOI] [PubMed] [Google Scholar]