

Abstract
The initial site of smoking‐induced lung disease is the small airway epithelium, which is difficult and time consuming to sample by fiberoptic bronchoscopy. We developed a rapid, office‐based procedure to obtain trachea epithelium without conscious sedation from healthy nonsmokers (n= 26) and healthy smokers (n= 19, 27 ± 15 pack‐year). Gene expression differences (fold change >1.5, p < 0.01, Benjamini–Hochberg correction) were assessed with Affymetrix microarrays. A total of 1,057 probe sets were differentially expressed in healthy smokers versus nonsmokers, representing >500 genes. Trachea gene expression was compared to an independent group of small airway epithelial samples (n= 23 healthy nonsmokers, n= 19 healthy smokers, 25 ± 12 pack‐year). The trachea epithelium is more sensitive to smoking, responding with threefold more differentially expressed genes than small airway epithelium. The trachea transcriptome paralleled the small airway epithelium, with 156 of 167 (93%) genes that are significantly up‐ and downregulated by smoking in the small airway epithelium showing similar direction and magnitude of response to smoking in the trachea. Trachea epithelium can be obtained without conscious sedation, representing a less invasive surrogate “canary” for smoking‐induced changes in the small airway epithelium. This should prove useful in epidemiologic studies correlating gene expression with clinical outcome in assessing smoking‐induced lung disease.
Keywords: epithelium, airway, gene expression
Introduction
Cigarette smoking is the major risk factor for two common disorders, chronic obstructive pulmonary disease (COPD) and bronchogenic carcinoma. 1 , 2 , 3 , 4 Despite extensive public health efforts to decrease the incidence of smoking, 22% of adult males and 17% of adult females smoke in the United States. 5 Consistent with this, while many of the common human disorders are decreasing in incidence, COPD is currently the fourth cause of death in the United States and is expected to rise to the third by 2020, 6 and bronchogenic carcinoma is now the most common cause of death from cancer for both men and women, accounting for 29% of all cancer deaths in the United States with an estimated mortality of over 161,000 in 2008. 7 Based on the knowledge that only 15% to 20% of smokers develop either or both disorders 8 , 9 and that for those that do, a favorable prognosis is skewed toward those individuals for whom there is early diagnosis and institution of therapy, 6 , 10 , 11 the outcome of both COPD and bronchogenic carcinoma could be improved if strategies could be developed to permit early identification of individuals at risk for smoking‐induced lung disease.
While considerable progress has been made in imaging technology for the diagnosis of COPD and bronchogenic carcinoma, 12 , 13 , 14 significant advances could be made if biomarkers were available that provided sensitive assessment of the impact of smoking on the lung, that could then be used in epidemiologic studies to determine which smokers were at risk for these disorders. The challenge in developing such biomarkers is that the cell population central to the pathogenesis of COPD and the majority of bronchogenic carcinomas is primarily the small airway epithelium, the pseudostratified layer of cells in the sixth order bronchi that takes the brunt of the stress of cigarette smoking. 15 , 16 , 17 , 18 , 19 Although a great deal is known about the airway epithelium, it represents less than 1% of the total respiratory epithelial surface, and thus contributes little to the biologic components in blood or urine that could be used as biomarkers. 20 , 21 Although there are systemic biomarkers that correlate with lung inflammation in COPD and may be useful in predicting clinical outcome, despite considerable efforts over many decades, there are no unique, airway epithelial‐specific biomarkers detectable in blood, exhaled breath condensate, serum, or urine that correlate with the complex cellular responses of the human airway epithelium to smoking. 22 , 23
Based on work from our laboratory and others using microarray analysis of the airway epithelial transcriptome of smokers compared to nonsmokers, we know that smokers, despite the fact that they are “healthy” based on routine clinical testing, have up‐ and downregulation of hundreds of genes in the airway epithelium, without any significant systemic correlates. 24 , 25 , 26 , 27 , 28 , 29 , 30 In this context, the airway epithelium per se is a logical source of biomarkers to assess the impact on the respiratory tract of environmental insults such as cigarette smoking. The challenge in using direct sampling of the airway epithelium to obtain biomarkers is that this requires fiberoptic bronchoscopy with conscious sedation, a time‐consuming procedure with its attendant risks of oversedation, hypoventilation, vasovagal events, and arrhythmias, and the requirement for monitoring postsedation. 31 , 32 , 33 However, if the airway epithelium could be repetitively and easily sampled in an outpatient setting without resorting to conscious sedation, it should be possible to adapt microarray technology to assess the responses of the airway epithelium to smoking while mitigating the procedural risks that are attributable to sedation (oversedation and hypoventilation) as well as the need for postsedation monitoring.
The present study describes a strategy to sample the human airway epithelium that is simple, rapid and safe, and does not require the use of conscious sedation. We applied this strategy to sample the tracheal epithelium of healthy nonsmokers and healthy smokers and used microarrays to assess tracheal epithelial mRNA expression of the smoking responsive genes in the trachea. To determine if the trachea epithelium can serve as a “canary” for the small airway epithelium, we compared these data to an independent assessment of smoking‐induced gene expression in the small airway epithelium of healthy smokers and healthy nonsmokers. The data show that this short office procedure without conscious sedation is well tolerated and yields sufficient amounts of high‐quality tracheal epithelium and RNA that can be assessed by microarray analysis to identify genes that are differentially expressed in response to smoking. Interestingly, although the trachea epithelium exhibits a greater number of genes responsive to smoking compared to the small airway epithelium, the trachea epithelium is a good “canary” of the changes in gene expression induced by smoking in the small airway epithelium.
Methods
Study population
Normal nonsmokers and phenotypic normal smokers were recruited using local print and online media. Subjects were evaluated at the Weill Cornell NIH General Clinical Research Center and Department of Genetic Medicine Clinical Research Facility. The study was approved by the Weill Cornell Medical College Institutional Review Board and written informed consent was obtained from each individual prior to enrollment in the study. All individuals were HIV negative and determined to be phenotypically normal based on assessment including: routine history and physical exam; complete blood count, chemistry panel, coagulation studies, liver function tests, urinalysis, chest X‐ray, and pulmonary function tests. Healthy nonsmokers were defined as never‐smokers with a healthy history, physical exam, lung function, and chest X‐ray. Healthy smokers were individuals currently smoking with a normal history, physical exam, lung function, and chest X‐ray. To verify smoking status, in both the healthy nonsmoker and healthy smoker groups, a complete smoking history was obtained, urine samples were evaluated for nicotine and cotinine, and venous blood was evaluated for carboxyhemoglobin on both the day of the screen and the day of airway epithelial sampling.
After baseline evaluation, all individuals who met inclusion/ exclusion criteria underwent tracheal brushing without conscious sedation to obtain trachea epithelial cells. For comparison, an independent group of healthy nonsmokers and healthy smokers who met the inclusion/exclusion criteria underwent fiberoptic bronchoscopy with conscious sedation to obtain small airway epithelial cells.
Sampling trachea epithelium and small airway epithelium
A fiberoptic bronchoscope (Pentax, Tokyo, Japan, EB‐1530T3) was used to collect tracheal epithelial cells. To decrease salivary and bronchial secretions, atropine 0.6 mg was given IM and 2.5 mL, 0.02% ipratropium was nebulized. Topical anesthesia of the posterior pharynx and vocal cords was obtained by inhalation with 2 mL, 4% lidocaine followed by administering 1 spray of 20% benzocaine to the posterior pharynx. Unless there was a contraindication, the bronchoscope was introduced through the nostril after application of viscous 2% lidocaine with the patient sitting upright. Once the bronchoscope passed to the posterior pharynx, further topical anesthesia of the vocal cords and trachea was obtained with 1 mL aliquots of 1% lidocaine through the working port of the bronchoscope. The maximum amount of lidocaine used was 5 mg/kg body weight. After adequate topical anesthesia was obtained, a 2 mm cytology brush (Kimberly Clark, Roswell, GA, USA) was advanced through the working channel of the bronchoscope and tracheal epithelial cells were obtained by gently gliding the brush back and forth 20 times on tracheal epithelium in at least five different locations.
To sample the small airway epithelium, after achieving mild sedation with meperidine and midazolam and routine anesthesia of the vocal cords and bronchial airways with topical lidocaine, the fiberoptic bronchoscope was positioned proximal to the opening of a desired lobar bronchus. 27 A 2 mm diameter brush was advanced approximately 7 to 10 cm distal from the third‐order bronchial branch and the end of the brush was wedged at about the 10th to 12th generation branch of the right lower lobe. Small airway epithelial cells were collected by gently gliding the brush back and forth on the epithelium 5 to 10 times in 8 to 10 different locations in the same general area.
For both the trachea and small airway epithelium, cells were detached by flicking the brush into 5 mL of ice‐cold bronchial epithelial basal cell medium (BEBM, Clonetics, Walkersville, MD, USA). An aliquot of 0.5 mL was used to perform a differential cell count. The remaining 4.5 mL was immediately processed for RNA extraction. Total cell number was determined by counting on a hemocytometer and cell morphology and differential cell count (percentage of inflammatory and epithelial cells as well as proportions of ciliated, basal, secretory, and undifferentiated epithelial cells) were assessed on sedimented cells prepared by centrifugation (Cytospin 11, Shandon instruments, Pittsburgh, PA, USA) and stained with Diff‐Quik (Dade Behring, Newark, NJ, USA).
RNA extraction and preparation for microarray
The HG‐U133 Plus 2.0 array chip (Affymetrix, Santa Clara, CA, USA) was used to evaluate gene expression. This chip includes probes representing approximately 47,000 full‐length human genes. Total RNA was extracted using TRIzol (Invitrogen, Carlsbad, CA, USA), followed by purification (RNeasy MinElute RNA purification kit, Qiagen, Valencia, CA, USA). After extraction, all RNA samples were stored in RNA Secure (Ambion, Austin, TX, USA) at −80°C. An aliquot of each RNA sample was evaluated using an Agilent Bioanalyzer (Agilent Technologies, Palo Alto, CA, USA) to visualize and quantify the degree of RNA integrity. The NanoDrop ND‐1000 spectrophotometer (NanoDrop Technologies, Wilmington, DE, USA) was used to determine concentration. RNA samples were required to meet three criteria to be accepted for further processing: (1) A 260/A 280 ratio between 1.7 and 2.3; (2) concentration between 0.2 and 6 μg/mL; and (3) Agilent electropherogram displaying two distinct peaks corresponding to the 28S and 18S ribosomal RNA bands at a ratio of >0.5 with minimal or no degradation. Total RNA (3 μg) was used to synthesize double stranded cDNA using the GeneChip One‐Cycle cDNA synthesis kit, followed by cleanup with GeneChip Sample Cleanup Module, in vitro transcription (IVT) reaction using the GeneChip IVT labeling kit, and cleanup and quantification of the biotin‐labeled cDNA yield by spectrophotometry. All kits were from Affymetrix (Santa Clara, CA, USA). Hybridizations to test chips and to the HG‐U133 Plus 2.0 microarray were performed according to Affymetrix protocols, processed by the Affymetrix GeneChip Fluidics Station 450, and scanned with an Affymetrix GeneChip Scanner 3000 7G. Overall microarray quality was determined by evaluating the following criteria: (1) RNA integrity number (RIN) >7.0; (2) 3’/5’ ratio for GAPDH <3; and (3) scaling factor <10.
Microarray data analysis
Microarray data were processed using the MAS5 algorithm (Affymetrix Microarray Suite Version 5 software), which takes into account the perfect match and mismatch probes. MAS5‐processed data were normalized using GeneSpring by setting measurements <0.01 to 0.01 and by normalizing per chip to the median expression value on the array. In order to compare expression levels between two locations (trachea and small airway), data for small airway and trachea were normalized together, per gene, to the median expression value across arrays for the subset of genes for which direct comparisons of expression values were made. Probe sets that were significantly modified by smoking were selected according to the following criteria: (1) P call of “Present” in ≥20% of samples; (2) magnitude of fold change in average expression value for healthy smokers versus nonsmokers ≥1.5 24 , 34 , 35 , 36 , 37 and (3) p < 0.01 with a Benjamini–Hochberg correction to limit the false positive rate. 38 Functional annotation was carried out using the NetAffx Analysis Center (http://www.affymetrix.com) to retrieve the Gene Ontology (GO) annotations from the National Center for Biotechnology (NCBI) databases. For genes without GO annotations, other public databases were searched (Human Protein Reference Database, Online Mendelian Inheritance in Man, PubMed). Hierarchical clustering was carried out for the significantly changed genes using the MAS5‐analyzed data with the Spearman correlation as similarity measure and the complete linkage clustering algorithm using GeneSpring software. Overlap with published data was evaluated by eliminating absent and duplicate gene symbols from the lists of smoking‐responsive probe sets in the trachea and small airway and comparing these lists to the published data of Spira 25 , 39 and Zhang. 30
Principal component analysis
Partek Genomics Suite was used to perform principal component analysis (Partek® software, version 6.3, Partek Inc., St. Louis, MO, USA) for the trachea data from all healthy nonsmokers and healthy smokers using the 1,057 probe sets differentially expressed in smokers. The data were visualized by plotting on a two‐dimensional graph representing the first two principal components.
TaqMan real‐time RT‐PCR
In order to confirm the microarray results, the relative expression of eight representative genes found to be significantly modulated by smoking in the trachea was measured by TaqMan real‐time RT‐PCR using a subset of nonsmoker (n= 12) and healthy smoker (n= 10) tracheal epithelial samples. Pre‐made TaqMan Gene Expression Assays™ were purchased from Applied Biosystems (Foster City, CA, USA). The relative quantitation method was used, with the mRNA level for the gene of interest normalized to the level of ribosomal RNA or β‐actin as the internal control, and relative expression levels were calculated using the Ct method (Applied Biosystems) with one nonsmoker sample as the calibrator value. The PCR reactions were run in an Applied Biosystems Sequence Detection System 7500. Fold changes were evaluated as the ratio of the mean expression value in healthy smokers to the mean expression value in nonsmokers and p values were assessed using an unpaired Student's t‐test.
Statistical analysis
Comparisons of the subjects’ ages, cell yields and percent of cell types, and other continuous variables in smokers and nonsmokers were determined by a two‐tailed Student's t‐test. A chi‐square test was used to compare discrete variables such as ancestry and sex. In order to assess overall smoking responsiveness in the trachea compared to the small airway, the number and overlap in genes that were significantly up‐ and downregulated by smoking was compared, and a linear regression with 95% confidence limits was plotted for the fold change in the small airway compared to the fold change in the trachea for all known unique genes that were significantly up‐ or downregulated by smoking in the small airway epithelium.
Web deposition of data
All gene expression data have been deposited at the Gene Expression Omnibus (GEO) site (http://www.ncbi.nlm.nih.gov/geo/), a high‐throughput gene expression/molecular abundance data repository curated by the National Center for Bioinformatics (NCBI) site. The accession number for this data set is GSE13933.
Results
Trachea study population and biologic samples
The study population consisted of 26 healthy nonsmokers and 20 healthy smokers ( Table 1 ). All individuals were determined to be phenotypically normal based on history, physical exam, routine blood and urine studies, chest X‐ray, and pulmonary function tests. Trachea epithelial RNA of sufficient amount and quality was obtained in 45 of 46 of the subjects; the following information pertains to those 45 subjects.
Table 1.
Demographics of the study population assessed by tracheal brushing.*
| Parameter | Healthy nonsmokers | Healthy smokers | p value† |
|---|---|---|---|
| n | 26 | 19 | |
| Gender (male/female) | 17/9 | 16/3 | >0.15 |
| Age (year) | 40 ± 9 | 44 ± 6 | >0.07 |
| Race (B/W/H/O)‡ | 15/7/3/1 | 16/2/1/0 | >0.28 |
| Body mass index§ | 27 ± 7 | 28 ± 6 | >0.63 |
| Smoking history (pack‐year) | 0 | 27 ± 15 | |
| Smoking habits (packs per day) | 0 | 0.92 ± 0.54 | |
| Urine nicotine (ng/mL)∥ | neg | 1,167 ± 1,102 | |
| Urine cotinine (ng/mL)∥ | neg | 1,306 ± 757 | |
| Venous carboxyhemoglobin (%)¶ | 0.3 ± 0.5 | 1.6 ± 1.2 | |
| Pulmonary function parameters** | |||
| FVC | 107 ± 14 | 114 ± 14 | >0.09 |
| FEV1 | 106 ± 17 | 111 ± 15 | >0.24 |
| FEV1/FVC | 81 ± 6 | 78 ± 5 | >0.18 |
| TLC | 98 ± 13 | 102 ± 10 | >0.23 |
| DLCO | 97 ± 16 | 91 ± 7 | >0.06 |
*Demographic characteristics of 26 healthy nonsmokers and 19 healthy normal smokers assessed by tracheal sampling. Data are shown for subjects for whom satisfactory microarray data of epithelium were obtained (see Table 2 ). Data are presented as mean ± standard deviation.
†A p value of <0.05 was considered to be statistically significant.
‡B = Black; W = White; H = Hispanic; O = Other.
§Body mass index calculated as kg/m2.
∥Urine nicotine and cotinine used as screen to ensure current smoking; >200 = active smoker, 50 to 200 = passive exposure; <50 = nonsmoker. Data represent the mean of two determinations from the day of the initial screening and day of bronchoscopy; “neg”= not detectable.
¶Determined for all 19 smokers and 26 nonsmokers; venous carboxyhemoglobin was used as a secondary marker of current smoking; nonsmokers <1.5%.
**FVC = forced vital capacity; FEV1 = forced expiratory volume in 1 second; TLC = total lung capacity; DLCO = total diffusion capacity. FVC, FEV1, TLC, and DLCO are presented as percent predicted; FEV1/FVC is expressed as percent observed.
The nonsmoker and smoker groups were similar in regard to gender, age, race, and pulmonary function testing parameters. The average smoking pack‐year history of the smokers was 27 ± 15 and urinary nicotine and cotinine and venous carboxyhemoglobin confirmed the smoking status. The procedure to obtain tracheal epithelium was successful in 100% of nonsmokers and 95% of smokers ( Table 2 ). For that smoker in whom the procedure was not successful, the subject tolerated the procedure and brushes and an adequate amount of RNA were obtained, but the RNA did not pass quality control measures. The number of cells recovered in all groups was similar, as was the percent of epithelial cells recovered (average >99% both groups). Compared to the nonsmokers, the smokers had a lower proportion of ciliated cells, a higher proportion of basal and undifferentiated cells, and a similar proportion of secretory cells. Among all samples, the average RNA yield was 15 ± 4 μg/subject for nonsmokers and 22 ± 10 μg/ subject for smokers (p > 0.09). On average, the time to perform the procedure from introduction to removal of bronchoscope was 20 ± 6 minutes without significant difference between the nonsmoker and smoker groups (p > 0.7). None of the subjects had any reported side effects or complications post‐procedure.
Table 2.
Tracheal airway samples.
| Parameter | Healthy nonsmokers | Healthy smokers | p value* |
|---|---|---|---|
| n total of procedures | 26 | 20 | |
| n total of successful procedures† | 26 | 19 | |
| Percentage of successful procedures (%) | 100 | 95 | |
| Total number of brushes performed | 9 ± 1 | 9 ± 2 | >0.99 |
| Total number of cells recovered (×106)‡ | 5 ± 2 | 6 ± 2 | >0.68 |
| Percentage total cells | |||
| Epithelial | 99.9 ± 0.2 | 99.6 ± 1.1 | >0.32 |
| Inflammatory | 0.1 ± 0.2 | 0.2 ± 0.3 | >0.40 |
| Percentage epithelial cells | |||
| Ciliated | 48 ± 9 | 32 ± 11 | <0.001 |
| Secretory | 7 ± 5 | 8 ± 4 | >0.42 |
| Basal | 29 ± 8 | 35 ± 6 | <0.01 |
| Undifferentiated | 16 ± 5 | 24 ± 11 | <0.01 |
| Amount of RNA obtained (μg) | 15 ± 4 | 22 ± 10 | >0.09 |
| Time to perform procedure (min)§ | 19 ± 6 | 24 ± 4 | >0.70 |
*A p value of <0.05 was considered to be statistically significant.
†Success was defined by ability to obtain enough material from which to extract at least 4 μg of RNA that passed quality control criteria.
‡Cytospin preparations were stained with Diff Quik to determine the percentage of epithelial versus inflammatory cells, and to identify ciliated, secretory, basal, and undifferentiated epithelial cells.
§Procedure time refers to time from introduction of bronchoscope until removal of bronchoscope from subject.
Assessment of trachea gene expression
Using the criteria of P call of “Present” in 20% of samples, magnitude of fold change in healthy smokers versus nonsmokers 1.5, p < 0.01 with Benjamini–Hochberg correction to limit the false positive rate, 1,057 probe sets were identified as having expression levels significantly responsive to smoking in the trachea ( Figure 1A ; Table S1). Expression levels of 430 probe sets were downregulated and of 627 probe sets were upregulated in smokers compared to nonsmokers. Of these probe sets, 679 represented genes with known biological function; these were functionally grouped into categories based on annotations in public databases and literature review. These 679 probe sets represented 501 unique known genes. The specific categories containing the greatest numbers of smoking responsive genes were metabolism and signal transduction ( Figure 1B ). The xenobiotic and oxidant‐related category contained the genes displaying the greatest magnitude of change in expression levels in healthy smokers.
Figure 1.
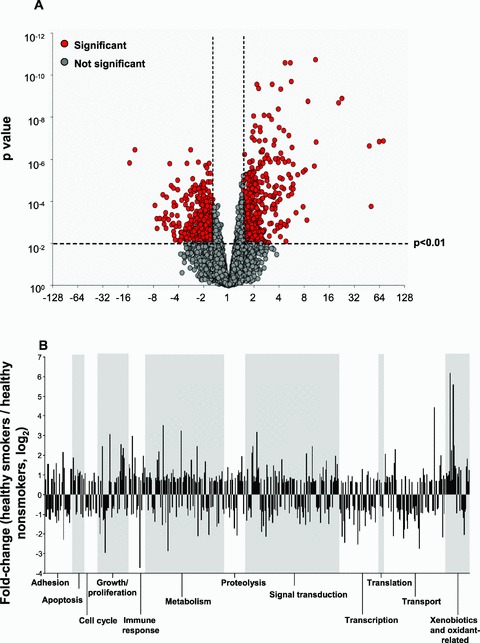

Differential gene expression profiles in trachea epithelium in healthy nonsmokers and healthy smokers. Expression levels normalized by array and by gene were compared for n= 19 healthy smokers and n= 26 healthy nonsmokers for all probe sets “present” in at least 20% of samples in the Affymetrix HG‐U133 Plus 2.0 array, using a 1.5 fold change, p < 0.01 with Benjamini–Hochberg correction. The fold change was calculated by dividing the average expression value for each probe set in all smoker samples by the average expression value in nonsmoker samples. (A) Volcano plot showing the 1,057 smoking responsive probe sets in the trachea epithelium. The mean expression level for smokers versus nonsmokers is expressed as fold change (log2, abscissa) plotted against the p value (ordinate) by t‐test. Each probe set with a significant difference in expression level in smokers is shown in red and those not differentially expressed in gray. Genes that are upregulated with a higher expression level in smokers are to the top right and those that are downregulated with a lower expression level in smokers are to the top left. (B) Skyscraper plots of fold changes for 501 unique genes with known function significantly differentially expressed in smokers versus nonsmokers in the trachea. Fold changes of smoking responsive genes are presented on log2 scale. Alternating gray and white bands indicate probe sets that belong to different functional categories. (C) Cluster plot. Probe sets expressed above average are in red, below average in blue, and average white. Probe sets are represented horizontally and individual subjects (orange: smokers, green: nonsmokers) are represented vertically. (D) Principal component analysis. Each axis represents one principal component (PC), with PC1 on the x axis and PC2 on the y axis. Nonsmokers are represented by green dots and healthy smokers by yellow dots. The nonsmokers and smokers separate along the first principal component.
Unsupervised hierarchical cluster analysis of the trachea epithelial gene expression profiles for the 26 nonsmokers and 19 healthy smokers was carried out using a Spearman correlation. This analysis clearly and completely separated the healthy smokers from nonsmokers ( Figure 1C ). Principal component analysis (PCA) was carried out for all individuals using the 1,057 smoking‐responsive probe sets and the first two principal components were plotted in two‐dimensional space ( Figure 1D ). Principal component 1 (PC1) captured 42.1% of the variability in the gene expression data, and PC2 accounted for 8.1% of gene expression variance. The two groups separated clearly on the basis of exposure to cigarette smoking.
Confirmation of microarray results by real‐time PCR
To confirm the microarray observations by an alternate method, TaqMan RT‐PCR was used to measure expression levels for eight representative genes found to be significantly modulated by smoking in the trachea epithelium. The genes evaluated were ADH7, alcohol dehydrogenase 7 (class IV), mu or sigma polypeptide; B3GNT6, UDP‐GlcNAc:betaGal beta‐1,3‐N‐acetylglucosaminyltransferase 6 (core 3 synthase); CEACAM5, carcinoem‐bryonic antigen‐related cell adhesion molecule 5; CYP1B1, cytochrome P450, family 1, subfamily B, polypeptide 1; ITLN1, intelectin 1 (galactofuranose binding); ME1, malic enzyme 1, NADP(+)‐dependent, cytosolic; MUC5B, mucin 5B, oligomeric mucus/ gel‐forming; and NQO1, NAD(P)H dehydrogenase, quinone 1. In each case, the PCR findings validated the smoking response observed in the microarray (Table S2).
Small airway epithelium study population and biologic samples
To determine the usefulness of the trachea epithelium as a “canary” for the small airway epithelium, smoking responsive gene expression was assessed in an independent group of 23 healthy nonsmokers and 19 healthy smokers matched (by gender, age, race, and smoking history) to the individuals who underwent trachea brushing. The small airway epithelium smoker and nonsmoker groups were not significantly different based on gender, age, race, and lung function test parameters (p > 0.10, all comparisons, Table 3 ). The average tobacco pack‐year history of the smokers was 27 ± 15. Similar numbers of cells were recovered in all groups (p > 0.8). The proportions of epithelial cells recovered were, on average, >99% in both nonsmokers and smokers. More undifferentiated cells were recovered in smokers than nonsmokers (10% vs. 7%, p < 0.02); otherwise there were no significant differences in the proportions of cell types recovered from each group.
Table 3.
Demographics and biologics of the study population assessed by small airway epithelium brushing.*
| Parameter | Small airway epithelium | p value† | |||
|---|---|---|---|---|---|
| Healthy nonsmokers | Healthy smokers | SAE** nonsmokers versus SAE smokers | SAE nonsmokers versus trachea nonsmokers†† | SAE smokers versus trachea smokers†† | |
| n | 23 | 19 | |||
| Sex (male/female) | 16/7 | 16/3 | >0.46 | >0.75 | >0.90 |
| Age (year) | 43 ± 13 | 44 ± 4 | >0.80 | >0.32 | >0.92 |
| Race (B/W/H/O)‡ | 10/11/1/1 | 16/2/1/0 | >0.10 | >0.63 | >0.90 |
| Body mass indexs§ | 25 ± 3 | 27 ± 5 | >0.22 | >0.30 | >0.65 |
| Smoking history (pack‐year) | 0 | 25 ± 12 | <0.0001 | >0.90 | >0.57 |
| Smoking habits (packs per day) | 0 | 0.89 ± 0.43 | <0.0001 | >0.90 | >0.81 |
| Urine nicotine (ng/mL)∥ | neg | 1237 ± 1174 | <0.001 | >0.90 | >0.85 |
| Urine cotinine (ng/mL)∥ | neg | 1322 ± 1076 | <0.0001 | >0.90 | >0.95 |
| Venous carboxyhemoglobin (%)¶ | 0.7 ± 0.9 | 2.03 ± 1.81 | <0.007 | >0.10 | >0.39 |
| Pulmonary function parameters# | |||||
| FVC | 107 ± 9 | 113 ± 15 | >0.19 | > 0.89 | >0.73 |
| FEV1 | 105 ± 11 | 110 ± 15 | >0.16 | >0.39 | >0.32 |
| FEV1/FVC | 81 ± 7 | 79 ± 4 | >0.18 | >0.61 | >0.10 |
| TLC | 102 ± 12 | 102 ± 11 | >0.81 | >0.25 | >0.81 |
| DLCO | 96 ± 11 | 93 ± 13 | >0.58 | >0.70 | >0.39 |
| Total number of brushes performed | 8 ± 1 | 9 ± 2 | >0.13 | >0.17 | >0.57 |
| Total number of cells recovered (×106)** | 7 ± 4 | 7 ± 2 | >0.87 | >0.07 | >0.19 |
| Percentage of total cells | |||||
| Epithelial | 99.6 ± 0.8 | 99.3 ± 1 | >0.42 | <0.06 | >0.39 |
| Inflammatory | 0.4 ± 0.8 | 0.8 ± 1 | >0.31 | <0.06 | >0.06 |
| Percentage of epithelial cells | |||||
| Ciliated | 75 ± 6 | 70 ± 10 | >0.06 | <0.0001 | <0.0001 |
| Secretory | 6 ± 3 | 9 ± 6 | >0.08 | >0.38 | >0.76 |
| Basal | 12 ± 5 | 10 ± 4 | >0.31 | <0.0001 | <0.0001 |
| Undifferentiated | 7 ± 3 | 10 ± 5 | <0.02 | <0.0001 | <0.0001 |
* Demographic characteristics of 23 healthy nonsmokers and 19 healthy normal smokers in whom small airway epithelium samples were obtained. Subjects are an independent data set of different individuals from the trachea data, but are matched to the trachea data set based on age, gender, race, and smoking history. Data are presented as mean ± standard deviation.
† A p value of <0.05 was considered to be statistically significant.
‡ B = Black; W = White; H = Hispanic, O = Other.
§ Body mass index calculated as kg/m2.
∥ Urine nicotine and cotinine used as screen to ensure current smoking; >200 = active smoker, 50–200 = passive exposure; <50 = nonsmoker. Data represent the mean of two determinations from the day of the initial screening and day of bronchoscopy.
¶ Determined for all in 23 nonsmokers and 19 smokers; venous carboxyhemoglobin was used as a secondary marker of current smoking; nonsmokers <1.5%.
# FVC = forced vital capacity; FEV1 = forced expiratory volume in 1 second; TLC = total lung capacity; DLCO = total diffusion capacity. FVC, FEV1, TLC, and DLCO are presented as percent predicted; FEV1/FVC is expressed as percent observed.
** SAE = small airway epithelium.
A comparison of the trachea nonsmokers and smokers and small airway epithelium nonsmokers and smokers showed no significant differences on the basis of sex, age, or race among all four groups (p > 0.1; Table 3 ). There was no difference in tobacco history between the trachea smoker and small airway epithelium smoker groups (p > 0.5). As expected by differences in location, there were significant differences between the groups in regard to the percentages of cell types obtained. The numbers of ciliated cells were not significantly different between the nonsmoker and smoker small airway epithelium groups, but both small airway epithelium groups had increased numbers of ciliated cells as compared to either trachea group, and trachea nonsmokers had more ciliated cells than trachea smokers (p < 0.001, all comparisons). The trachea epithelium had increased percentages of basal and undifferentiated cells as compared with either small airway epithelium group, and the trachea smokers had increased percentages of these cells as compared to trachea nonsmokers (p < 0.01, all comparisons). There were no significant differences between the small airway epithelium groups in proportions of basal and undifferentiated cells. There were no differences in pulmonary function test parameters among the groups.
Comparison of gene expression in small airway epithelium versus trachea epithelium
A comparison of global gene expression demonstrated that based on a P call of “Present” in 20% of samples from each group, the trachea expressed 32,239 probe sets and the small airway epithelium expressed 30,897 probe sets, with the vast majority (30,122, >97%) of probe sets expressed in both airway locations. However, in contrast to the 1,057 probe sets (representing 501 unique genes) identified as being smoking responsive in the trachea epithelium, using the same criteria, only 252 probe sets (representing 167 genes) were identified as having expression levels significantly responsive to smoking in the independent small airway epithelium data set (Tables S1 and S3). Of these, 74 probe sets were upregulated and 178 were downregulated in healthy smokers compared to nonsmokers. Thus, it appears that the trachea epithelium is more sensitive to the stress of smoking than is the small airway epithelium, with the trachea up‐ or downregulating threefold more genes than an independent small airway epithelium sample set matched for age, gender, ancestry, and smoking history.
While the trachea responds to smoking more vigorously than does the small airway epithelium, the trachea could still serve as a good surrogate for the small airway epithelium if the genes up‐ and downmodified in response to smoking in the small airway epithelium exhibited parallel up‐ and downmodification in the trachea. In this regard, most of the genes significantly smoking responsive in the small airway epithelium were also smoking responsive in the trachea epithelium, with a similar direction and magnitude of change in gene expression in response to smoking ( Figure 2 ). Among these genes were those representing growth and proliferation ( Figure 3A ), metabolism ( Figure 3B ), signal transduction ( Figure 3C ), transcription ( Figure 3D ), transport ( Figure 3E ), and xenobiotics/anti‐oxidant response ( Figure 3F ).
Figure 2.

Comparison of smoking responsive gene expression in small airway to that of trachea epithelium. Using the small airway epithelium response to smoking as the “gold standard,” shown are the smoking responsive genes (1.5 fold change up‐ or down; p > 0.01, Benjamini–Hochberg correction) in the small airway epithelium (panel A) compared to the response of the same genes to smoking in the trachea epithelium (panel B). (A) Skyscraper plot of fold changes for 167 unique genes with known function that are significantly differentially expressed in the small airway epithelium in smokers (n= 19) versus nonsmokers (n= 23). (B) Skyscraper plot of the smoker (n= 19) to nonsmoker (n= 26) fold changes in the trachea epithelium of the 167 smoking responsive genes responsive to smoking in the small airway epithelium. For both A and B, the fold changes are on a log2 scale and alternating gray and white bands indicate probe sets that belong to different functional categories.
Figure 3.


Examples of smoking responsive genes within different functional categories in healthy nonsmokers and healthy smokers, showing relative expression levels in tracheal epithelium samples as compared with small airway epithelium samples. (A) Growth and proliferation genes; chemokine (C‐X3‐C motif) ligand 1 (CX3CLI), fibrillin 1 (FBN1), and tropomyosin 2 (beta) (TPM2); (B) Metabolism; carbonyl reductase 3 (CBR1), malic enzyme 1, NADP(+)‐dependent, cytosolic (ME1), and aldehyde dehydrogenase 3 family, member A1 (ALDH3A1); (C) Signal transduction; protein phosphatase 1, regulatory (inhibitor) subunit 16B (PPP1R16B), slit homolog 2 (Drosophila) (SLIT2), and erythrocyte membrane protein band 4.1‐like 2 (EPB41L2); (D) Transcription; transcription factor 7‐like 1 (T‐cell specific, HMG‐box) (TCF7L1), collagen, type IX, alpha 2 (COL9A2), and GLI‐Kruppel family member GLI3 (Greig cephalopolysyndactyly syndrome) (GLI3); (E) Transport; flavin containing monooxygenase 2 (non‐functional) (FMO2), metallothionein 1G (MTIG), and STEAP family member 4 (STEAP4); and (F) Xenobiotics/anti‐oxidant‐response; aldo‐keto reductase family 1, member C3 (3‐alpha hydroxysteroid dehydrogenase, type II) (AKR1C3), glutathione peroxidase 2 (gastrointestinal) (GPX2), and alcohol dehydrogenase 7 (class IV), mu or sigma polypeptide (ADH7). Data are presented as mean expression values ± standard error. The p values are based on unpaired t‐tests with Benjamini– Hochberg correction.
To further assess whether smoking responsive gene expression in the trachea epithelium was a good surrogate for the small airway epithelium response, the 167 smoking responsive genes in the small airway epithelium were plotted as smoker/nonsmoker fold change of each gene in the trachea against the smoker/nonsmoker fold change in small airway epithelium ( Figure 4 ), and the regression line and confidence intervals were determined. Analysis of these 167 genes showed that overall, the gene response was similar in the trachea and small airway epithelium, with almost all genes (93%, 156 of 167) falling within the 95% confidence limits (r 2= 0.83, p < 0.001).
Figure 4.

Regression analysis of smoking‐responsive gene expression in the trachea versus small airway epithelium. Abscissa–fold change of the 167 genes response to smoking in the small airway epithelium (1.5‐fold, p < 0.01, Benjamini–Hochberg correction) expressed as a fold change of healthy smokers compared to healthy nonsmokers. Ordinate–for the same 167 genes identified as being significantly up‐ or downregulated in the small airway epithelium, shown for each gene is the fold change (healthy smokers to healthy nonsmokers) in the trachea of an independent group of smokers and nonsmokers. This solid diagonal line is the linear regression, and the 2 dashed diagonal lines are the 95% confidence limits of the range around the line. (r 2= 0.83, p < 0.001). The vertical dotted lines indicate the up‐ and downregulated 1.5‐fold range, beyond which genes were considered significantly modified by smoking in the small airway epithelium. Of the 141 genes significantly up‐ and downregulated by smoking in the small airway epithelium, 93% (156/167) of the fold change in the trachea are within the 95% confidence limits, i.e., assessment of the trachea provides representation of the response of the small airway epithelium to smoking.
Of the 11 of 167 (6.6%) genes falling outside of the 95% confidence limits, two genes were more highly smoking responsive in the small airway epithelium compared to the trachea (ADH7, alcohol dehydrogenase 7 class I V, mu or sigma polypeptide; and UCHL1, ubiquitin carboxyl‐terminal esterase L1 [ubiquitin thiolesterase] were upregulated). Four genes were more highly smoking responsive in the trachea compared to the small airway epithelium (CYP1B1, cytochrome P450, family 1, subfamily B, polypeptide 1; and SLC7A11, solute carrier family 7, [cationic amino acid transporter, y+ system] member 11, were upregulated; FHOD3, formin homology 2 domain containing 3; and NPAS3, neuronal PAS domain protein 3 were downregulated). Four genes were only smoking responsive in the small airway epithelium and showed no significant change in the trachea (SPP1, secreted phosphoprotein 1 was upregulated; and CSGALNACT1, chondroitin sulfate N‐acetylgalactosaminyltransferase 1; DSG2, desmoglein 2; and LRP2, low density lipoprotein‐related protein 2 were downregulated). Only one gene showed an opposite pattern in the trachea compared to the small airway. GLB1L3, galactosidase, beta 1‐like 3, was significantly upregulated in the small airway but was significantly downregulated in the trachea. Thus, only 6.6% (11 of 167) smoking responsive genes in the small airway epithelium were not similarly responsive to smoking in the trachea epithelium, i.e., 156 of 167 (93.4%) of genes up‐ and downmodulated by smoking in the small airway epithelium respond to smoking with a similar direction and magnitude in the trachea (see Tables S4 and S5 for details).
The similarity of smoking‐responsive genes in the trachea and in the small airway was compared to published gene lists by Spira 25 , 39 and Zhang. 30 In the list of smoking‐responsive genes in the trachea, the least overlap was observed with the cancer biomarker gene set of Spira et al. 39 (<1% overlap) and the greatest overlap was seen with the smoking‐responsive gene set of Zhang et al. 30 (13% overlap; Table S6). Among the smoking‐responsive genes in the small airway, the same pattern was observed, with 1.4% overlap with the cancer biomarker set and 8.5% overlap with the smoking‐responsive genes reported by Zhang et al. 30 (Table S7).
Discussion
The airway epithelium serves as the first barrier to environmental contaminants in the inhaled air. 40 The most stressful of these contaminants, and the major cause of chronic obstructive pulmonary disease and bronchogenic carcinoma, is cigarette smoking, with its >1000 xenobiotics and >1014 oxidants/puff. 41 The present study demonstrates that using local anesthesia without conscious sedation, it is possible to easily sample the trachea epithelium to permit assessment of the effects of cigarette smoke on epithelial gene expression. The data show that the trachea is highly responsive to the stress of smoking with >500 genes significantly up‐ or downregulated in healthy smokers compared to healthy nonsmokers. Based on the knowledge that the majority of smoking‐induced lung disease is initiated in the small airway epithelium, we asked: how good is the response of the trachea epithelium to smoking as a surrogate for the response of the small airway epithelium? To determine whether the more easily accessible trachea epithelium could serve as a “canary” for the small airway epithelium, a parallel analysis was carried out in an independent, matched set of small airway epithelium samples obtained via bronchoscopy and conscious sedation of healthy nonsmokers and healthy smokers. We chose an unpaired study design in order to evaluate whether tracheal gene expression is representative of small airway expression for a subset of genes that are smoking‐responsive in the small airway even in an independent population. A paired study design could be of interest for a future study, however, and would provide data on intra‐individual similarity of gene expression at the two sites. Interestingly, the trachea epithelium was far more sensitive to smoking than the small airway epithelium, with threefold more genes up‐ or down regulated by smoking compared to the small airway epithelium. However, when the analysis was limited to the genes significantly modified by smoking in the small airway epithelium compared to the same genes in the trachea, it was apparent that, in general, the trachea epithelium behaves in a similar fashion as the small airway epithelium, with >90% of the smoking‐responsive genes in the small airway showing a similar direction and magnitude of response in the trachea. While it is not known whether gene expression in the small airway epithelium or the tracheal epithelium might better predict risk for disease, we hypothesize that the most relevant genes are those that respond to smoking in the small airway, the earliest site of smoking‐related lung disease. Rather than suggesting that gene expression in the trachea for any particular gene provides a good prediction of that gene's expression in the small airway epithelium, we believe that the trachea is a good surrogate on average, across all smoking responsive genes. We conclude that the trachea epithelial response to cigarette smoking is a good “canary” for the effects of smoking on the small airway.
Biomarkers of smoking‐induced lung disease
Cigarette smoking is the main risk factor for the development of COPD and bronchogenic carcinoma. 3 , 6 , 9 However, only 10% to 20% of smokers develop smoking‐related lung disease, suggesting genetic differences are likely involved in determining smoking‐induced lung disease risk. 8 , 9 , 42 , 43 , 44 A variety of genetic variations have been associated with smoking‐induced lung disease, but other than the autosomal recessive genetic variation causing α1‐antitrypsin defficiency, 45 it is likely that multiple genes are involved in the genetic susceptibility to COPD or bronchogenic carcinoma, each contributing only a small risk above background. 42 , 43 , 44
A variety of studies have investigated biologic markers relevant to COPD in blood, sputum, urine, and exhaled breath condensate. 23 , 46 , 47 Blood‐based markers include C‐reactive protein, interleukin 6 (IL‐6), fibrinogen, Clara cell secretory protein, surfactant protein D, and tumor necrosis factor‐α (TNF‐α). 48 , 49 , 50 , 51 Sputum‐related biomarkers include inflammatory cells such as neutrophils, eosinophils, and CD8+ T cells 52 , 53 , 54 and inflammatory mediators including interleukin 8, TNF‐α, and proteases such as neutrophil elastase and metalloproteinases ‐8 and ‐9. 52 , 55 , 56 , 57 , 58 Urine biomarkers include desmosine 59 and exhaled breath condensate biomarkers include hydrogen peroxide, 8‐isoprostane, leukotriene B4, prostaglandin E2, and IL‐6. 60 , 61 , 62 While several of these studies are encouraging, blood, sputum, and exhaled breath biomarkers do not directly correlate with the processes ongoing in small airway, the initial site of smoking‐induced changes in the lung, and none predict which specific smokers are at risk for developing COPD. Similarly, efforts are ongoing to develop noninvasive lung cancer biomarkers, but to date there are no blood, sputum or exhaled breath biomarkers that are validated to predict risk for bronchogenic carcinoma. 63
Because the airway epithelium represents the initial site of abnormalities of smoking‐induced lung disease, we and others have focused on directly assessing the transcriptome of the airway epithelium recovered by bronchoscopy and airway brushing. 24 , 25 , 26 , 27 , 28 , 29 , 30 , 35 , 64 , 65 Smoking changes the genome‐wide transcriptome of the airway epithelium and studies have looked at both the large airway epithelium and the small airway epithelium. For example, Spira et al. 25 used microarray analysis to describe the effects of cigarette smoking on the large airway epithelium and found 97 genes differentially expressed in smokers versus nonsmokers as well as a subset of genes that returned to nonsmoker levels and a subset that remained abnormally expressed after smoking cessation. Similarly, Zhang et al. 30 applied microarray analysis and identified genes differentially expressed in smokers compared with nonsmokers, and described a subset of genes that remain abnormal after smoking cessation. Analysis of gene expression on large airway epithelium brushings has also been used to identify gene expression profiles among smokers, nonsmokers, and former smokers. 66 Pierrou et al. 28 studied gene expression in the large airway epithelium of nonsmokers, healthy smokers, and smokers with COPD and found differential gene expression of oxidant genes among these groups. Hackett et al. 24 used microarray to show individual variability in oxidant‐related genes in the large airway epithelium of healthy smokers.
In the context that the small airway epithelium (airways <2 mm, 6th to 23rd generations) is the site of earliest abnormalities associated with smoking damage and development of COPD, our group has focused on directly assessing gene expression in this site. 15 , 17 , 18 , 19 , 27 , 67 We have developed a strategy to use fiberoptic bronchoscopy to sample the distal airway epithelium and have observed the up‐ and downregulation of hundreds of smoking responsive genes. 27 Similar to the large airway epithelium, we have demonstrated individual variability in the small airway epithelial gene expression in response to smoking. 29
The airway epithelium transcriptome of both the large and small airway is clearly smoking responsive, demonstrating differences in gene expression among nonsmokers, smokers, and former smokers. The goal is to ultimately be able to use this as a tool for early diagnosis and prediction of risk. In that context, Spira et al. 39 used microarray analysis to profile gene expression in the uninvolved large airways of those who were undergoing bronchoscopy for suspicion of bronchogenic carcinoma. The group was able to construct an 80‐gene biomarker set that predicts development of lung cancer and that maintained sensitivity and specificity when tested on independent data sets, furthering the concept of using gene expression information derived from the airways as a biomarker.
Trachea as a surrogate for the small airway epithelium
While direct assessment of the large and small airways is the most direct way to assess ongoing processes in the airway epithelium, in the context of the evidence that the airway epithelium is the primary site of disease in COPD 18 and the site of origin of a large proportion of lung cancers, 68 it would be ideal to identify candidate biomarkers that can predict smoking‐related damage in airway epithelium through less invasive measures than fiberoptic bronchoscopy with conscious sedation. The knowledge that cigarette smoke creates a field of injury to exposed epithelial cells has prompted the comparison of gene expression in the large airway epithelium to that of the buccal and nasal mucosa. Smith et al. 69 performed brush biopsies of buccal mucosa and found >100 genes that could separate smokers and nonsmokers. Spivack et al. 70 took brush biopsies of buccal epithelium and demonstrated that gene expression at this site correlated to expression of genes in laser‐microdissected lung samples from the same subjects. Recently, Sridhar et al. 71 compared global gene expression among the nasal, buccal, and large airway epithelial mucosa among never smokers and used PCA and cluster analysis to show that global gene expression at these locations separated them from other locations such as esophagus, skin, kidney, heart, and brain. These investigators then took a subset of 361 genes differentially expressed in the large airway epithelium in response to smoking and compared it to the extrathoracic mucosal samples. The data suggested that extrathoracic airway epithelial cells may reffect changes occurring in the large airway epithelium.
Conclusions
The strategy used in the present study was to assess the trachea as the surrogate for smoking responsiveness in the small airway epithelium. The tracheal epithelium is composed of the same pseudostratified columnar epithelial cells as the airway bronchi, is contiguous with the bronchi, and is exposed to cigarette smoke during each inhalation and exhalation. We hypothesized that the histological similarity between tracheal epithelium and small airway epithelium and the direct contact that the trachea has with smoke would make this a sensitive location from which to compile a gene expression profile with which to distinguish smokers and nonsmokers. Although a few studies have looked at gene expression in the human trachea, 72 to our knowledge, there are no studies in the tracheal epithelium describing the genome‐wide tracheal transcriptome, the response of the tracheal transcriptome to cigarette smoking, or a comparison between tracheal and bronchial gene expression. In this context, we developed an office‐based procedure to obtain trachea epithelium that is relatively easy, and requires only topical anesthesia without any conscious sedation. This methodology enables recovery of large amounts of high‐quality RNA. With the availability of microarray analysis strategies requiring less RNA, 73 , 74 the time required for the procedure can be reduced further. The data show that the trachea serves as a good “canary” for the small airway epithelium, with smoking responsiveness of >98% of the genes modified by smoking in the small airway epithelium also up‐ and downregulated by smoking in the trachea. We suggest that, while the trachea is not as accurate as the small airway epithelium per se, it is a sufficient surrogate that should prove useful in an office setting and for epidemiologic studies where the conscious sedation and formal bronchoscopic studies are not practical.
Supporting information
Table S1. Smoking‐related Differentially Expressed Genes in the Trachea Epithelium of Healthy Nonsmokers and Healthy Smokers
Table S2. TaqMan RT‐PCR Validation of Microarray Results
Table S3. Smoking‐related Differentially Expressed Genes in the Small Airway Epithelium of Healthy Nonsmokers and Healthy Smokers
Table S4. Genes for Which the Trachea Epithelium Is a Reasonable Approximation of the Response to Smoking in Small Airway Epithelium
Table S5. Genes which the Trachea Epithelium is a Poor Approximation of the Response to Smoking in the Small Airway Epithelium
Table S6. Overlap of Genes Differentially Expressed in the Trachea of Healthy Smokers vs Nonsmokers with Other Reported Smoking‐Responsive Genes
Table S7. Overlap of Genes Differentially Expressed in the SAE of Healthy Smokers vs Nonsmokers with Other Reported Smoking‐Responsive Genes
Please note: Wiley‐Blackwell Publishing is not responsible for the content or functionality of any supporting information supplied by the authors. Any queries (other than missing material) should be directed to the corresponding author for the article.
Supporting info item
Acknowledgments
We thank C. Hollmann, M. Aquilato, and S. Hyde for coordinating the study, C. Schlemme and M. Yeotsas for help with regulatory submissions, and T. Virgin‐Bryan and N. Mohamed for help in preparing this manuscript. The work was supported, in part, by R01 HL074326, P50 HL084936, and UL1‐RR024996.
References
- 1. Doll R, Peto R. Mortality in relation to smoking: 20 years’ observations on male British doctors. Br Med J. 1976; 2: 1525–1536. [DOI] [PMC free article] [PubMed] [Google Scholar]
- 2. Shopland DR. Tobacco use and its contribution to early cancer mortality with a special emphasis on cigarette smoking. Environ Health Perspect. 1995; 103(Suppl 8): 131–142. [DOI] [PMC free article] [PubMed] [Google Scholar]
- 3. Rennard SI. COPD: overview of definitions, epidemiology, and factors influencing its development. Chest. 1998; 113: 235S–41S. [DOI] [PubMed] [Google Scholar]
- 4. Hecht SS. Tobacco carcinogens, their biomarkers and tobacco‐induced cancer. Nat Rev Cancer. 2003; 3: 733–744. [DOI] [PubMed] [Google Scholar]
- 5. Cigarette smoking among adults–United States, 2007. MMWR Morb Mortal Wkly Rep 2008; 57: 1221–1226. [PubMed] [Google Scholar]
- 6. Pauwels RA, Buist AS, Calverley PM, Jenkins CR, Hurd SS. Global strategy for the diagnosis, management, and prevention of chronic obstructive pulmonary disease. NHLBI/WHO Global Initiative for Chronic Obstructive Lung Disease (GOLD) Workshop summary. Am J Respir Crit Care Med. 2001; 163: 1256–1276. [DOI] [PubMed] [Google Scholar]
- 7. Jemal A, Siegel R, Ward E, Hao Y, Xu J, Murray T, Thun MJ. Cancer statistics, 2008. CA Cancer J Clin. 2008; 58: 71–96. [DOI] [PubMed] [Google Scholar]
- 8. Fletcher C, Peto R. The natural history of chronic airflow obstruction. Br Med J. 1977; 1: 1645–1648. [DOI] [PMC free article] [PubMed] [Google Scholar]
- 9. Cigarette smoking and health. American Thoracic Society. Am J Respir Crit Care Med. 1996; 153: 861–865. [DOI] [PubMed] [Google Scholar]
- 10. Anthonisen NR, Connett JE, Murray RP. Smoking and lung function of Lung Health Study participants after 11 years. Am J Respir Crit Care Med. 2002; 166: 675–679. [DOI] [PubMed] [Google Scholar]
- 11. Goldstraw P, Crowley J, Chansky K, Giroux DJ, Groome PA, Rami‐Porta R, Postmus PE, Rusch V, Sobin L. The IASLC Lung Cancer Staging Project: proposals for the revision of the TNM stage groupings in the forthcoming (seventh) edition of the TNM Classification of malignant tumours. J Thorac Oncol. 2007; 2: 706–714. [DOI] [PubMed] [Google Scholar]
- 12. Coxson HO, Rogers RM. Quantitative computed tomography of chronic obstructive pulmonary disease. Acad Radiol. 2005; 12: 1457–1463. [DOI] [PubMed] [Google Scholar]
- 13. Bach PB, Jett JR, Pastorino U, Tockman MS, Swensen SJ, Begg CB. Computed tomography screening and lung cancer outcomes. JAMA. 2007; 297: 953–961. [DOI] [PubMed] [Google Scholar]
- 14. Henschke CI, Yankelevitz DF, Libby DM, Pasmantier MW, Smith JP, Miettinen OS. Survival of patients with stage I lung cancer detected on CT screening. N Engl J Med. 2006; 355: 1763–1771. [DOI] [PubMed] [Google Scholar]
- 15. Hogg JC, Macklem PT, Thurlbeck WM. Site and nature of airway obstruction in chronic obstructive lung disease. N Engl J Med. 1968; 278: 1355–1360. [DOI] [PubMed] [Google Scholar]
- 16. Auerbach O, Hammond EC, Garfinkel L. Changes in bronchial epithelium in relation to cigarette smoking, 1955–1960 vs. 1970–1977. N Engl J Med. 1979; 300: 381–385. [DOI] [PubMed] [Google Scholar]
- 17. Cosio MG, Hale KA, Niewoehner DE. Morphologic and morphometric effects of prolonged cigarette smoking on the small airways. Am Rev Respir Dis. 1980; 122: 265–321. [DOI] [PubMed] [Google Scholar]
- 18. Hogg JC, Chu F, Utokaparch S, Woods R, Elliott WM, Buzatu L, Cherniack RM, Rogers RM, Sciurba FC, Coxson HO, Pare PD. The nature of small‐airway obstruction in chronic obstructive pulmonary disease. N Engl J Med. 2004; 350: 2645–2653. [DOI] [PubMed] [Google Scholar]
- 19. Hogg JC. Pathophysiology of airflow limitation in chronic obstructive pulmonary disease. Lancet. 2004; 364: 709–721. [DOI] [PubMed] [Google Scholar]
- 20. Mercer RR, Russell ML, Roggli VL, Crapo JD. Cell number and distribution in human and rat airways. Am J Respir Cell Mol Biol. 1994; 10: 613–624. [DOI] [PubMed] [Google Scholar]
- 21. Weibel ER. Design and morphometry of the pulmonary gas exchanger In: Crystal RG, West JB, Weibel ER, Barnes PJ, eds. The Lung Scientific Foundations. 2nd ed Philadelphia : Lippincott‐Raven, 2009, 1147–1157. [Google Scholar]
- 22. Barnes PJ, Chowdhury B, Kharitonov SA, Magnussen H, Page CP, Postma D, Saetta M. Pulmonary biomarkers in chronic obstructive pulmonary disease. Am J Respir Crit Care Med. 2006; 174: 6–14. [DOI] [PubMed] [Google Scholar]
- 23. Cazzola M, MacNee W, Martinez FJ, Rabe KF, Franciosi LG, Barnes PJ, Brusasco V, Burge PS, Calverley PM, Celli BR, Jones PW, Mahler DA, Make B, Miravitlles M, Page CP, Palange P, Parr D, Pistolesi M, Rennard SI, Rutten‐van Molken MP, Stockley R, Sullivan SD, Wedzicha JA, Wouters EF. Outcomes for COPD pharmacological trials: from lung function to biomarkers. Eur Respir J. 2008; 31: 416–469. [DOI] [PubMed] [Google Scholar]
- 24. Hackett NR, Heguy A, Harvey BG, O’Connor TP, Luettich K, Flieder DB, Kaplan R, Crystal RG. Variability of antioxidant‐related gene expression in the airway epithelium of cigarette smokers. Am J Respir Cell Mol Biol. 2003; 29: 331–343. [DOI] [PubMed] [Google Scholar]
- 25. Spira A, Beane J, Shah V, Liu G, Schembri F, Yang X, Palma J, Brody JS. Effects of cigarette smoke on the human airway epithelial cell transcriptome. Proc Natl Acad Sci USA. 2004; 101: 10143–10148. [DOI] [PMC free article] [PubMed] [Google Scholar]
- 26. Beane J, Sebastiani P, Liu G, Brody JS, Lenburg ME, Spira A. Reversible and permanent effects of tobacco smoke exposure on airway epithelial gene expression. Genome Biol. 2007; 8: R201. [DOI] [PMC free article] [PubMed] [Google Scholar]
- 27. Harvey BG, Heguy A, Leopold PL, Carolan BJ, Ferris B, Crystal RG. Modification of gene expression of the small airway epithelium in response to cigarette smoking. J Mol Med. 2007; 85: 39–53. [DOI] [PubMed] [Google Scholar]
- 28. Pierrou S, Broberg P, O’Donnell RA, Pawlowski K, Virtala R, Lindqvist E, Richter A, Wilson SJ, Angco G, Moller S, Bergstrand H, Koopmann W, Wieslander E, Stromstedt PE, Holgate ST, Davies DE, Lund J, Djukanovic R. Expression of genes involved in oxidative stress responses in airway epithelial cells of smokers with chronic obstructive pulmonary disease. Am J Respir Crit Care Med. 2007; 175: 577–586. [DOI] [PubMed] [Google Scholar]
- 29. Ammous Z, Hackett NR, Butler MW, Raman T, Dolgalev I, O’Connor TP, Harvey BG, Crystal RG. Variability in small airway epithelial gene expression among normal smokers. Chest. 2008; 133: 1344–1353. [DOI] [PMC free article] [PubMed] [Google Scholar]
- 30. Zhang LI, Lee J, Tang H, Fan YH, Xiao L, Ren H, Kurie J, Morice RC, Hong WK, Mao H. Impact of smoking cessation on global gene expression in the bronchial epithelium of chronic smokers. Cancer Prev Res. 2008; 1: 112–118. [DOI] [PMC free article] [PubMed] [Google Scholar]
- 31. Suratt PM, Smiddy JF, Gruber B. Deaths and complications associated with fiberoptic bronchoscopy. Chest. 1976; 69: 747–751. [DOI] [PubMed] [Google Scholar]
- 32. Pereira W Jr, Kovnat DM, Snider GL. A prospective cooperative study of complications following flexible fiberoptic bronchoscopy. Chest. 1978; 73: 813–816. [DOI] [PubMed] [Google Scholar]
- 33. Pue CA, Pacht ER. Complications of fiberoptic bronchoscopy at a university hospital. Chest. 1995; 107: 430–432. [DOI] [PubMed] [Google Scholar]
- 34. Lu BS, Yu AD, Zhu X, Garrity ER Jr, Vigneswaran WT, Bhorade SM. Sequential gene expression profiling in lung transplant recipients with chronic rejection. Chest. 2006; 130: 847–854. [DOI] [PubMed] [Google Scholar]
- 35. Heguy A, Harvey BG, Leopold PL, Dolgalev I, Raman T, Crystal RG. Responses of the human airway epithelium transcriptome to in vivo injury. Physiol Genomics. 2007; 29: 139–148. [DOI] [PubMed] [Google Scholar]
- 36. Kramer EL, Deutsch GH, Sartor MA, Hardie WD, Ikegami M, Korfhagen TR, Le Cras TD. Perinatal increases in TGF‐{alpha} disrupt the saccular phase of lung morphogenesis and cause remodeling: microarray analysis. Am J Physiol Lung Cell Mol Physiol. 2007; 293: L314–L327. [DOI] [PubMed] [Google Scholar]
- 37. Tilley AE, Harvey BG, Heguy A, Hackett NR, Wang R, O’Connor TP, Crystal RG. Down‐regulation of the notch pathway in human airway epithelium in association with smoking and chronic obstructive pulmonary disease. Am J Respir Crit Care Med. 2009; 179: 457–466. [DOI] [PMC free article] [PubMed] [Google Scholar]
- 38. Benjamini Y, Hochberg Y. Controlling the false discovery rate: a practical and powerful approach to multiple testing. J Royal Statist Soc. 2009; 57: 289–300. [Google Scholar]
- 39. Spira A, Beane JE, Shah V, Steiling K, Liu G, Schembri F, Gilman S, Dumas YM, Calner P, Sebastiani P, Sridhar S, Beamis J, Lamb C, Anderson T, Gerry N, Keane J, Lenburg ME, Brody JS. Airway epithelial gene expression in the diagnostic evaluation of smokers with suspect lung cancer. Nat Med. 2007; 13: 361–366. [DOI] [PubMed] [Google Scholar]
- 40. Thompson AB, Robbins RA, Romberger DJ, Sisson JH, Spurzem JR, Teschler H, Rennard SI. Immunological functions of the pulmonary epithelium. Eur Respir J. 1995; 8: 127–149. [DOI] [PubMed] [Google Scholar]
- 41. MacNee W. Oxidative stress and lung infl ammation in airways disease. Eur J Pharmacol. 2001; 429: 195–207. [DOI] [PubMed] [Google Scholar]
- 42. Barnes PJ. Genetics and pulmonary medicine. 9. Molecular genetics of chronic obstructive pulmonary disease. Thorax. 1999; 54: 245–252. [DOI] [PMC free article] [PubMed] [Google Scholar]
- 43. Silverman EK, Chapman HA, Drazen JM, Weiss ST, Rosner B, Campbell EJ, O’Donnell WJ, Reilly JJ, Ginns L, Mentzer S, Wain J, Speizer FE. Genetic epidemiology of severe, early‐onset chronic obstructive pulmonary disease. Risk to relatives for airfl ow obstruction and chronic bronchitis. Am J Respir Crit Care Med. 1998; 157: 1770–1778. [DOI] [PubMed] [Google Scholar]
- 44. Molfino NA. Current thinking on genetics of chronic obstructive pulmonary disease. Curr Opin Pulm Med. 2007; 13: 107–113. [DOI] [PubMed] [Google Scholar]
- 45. Mastrangeli A, Crystal RG. Alpha 1‐antitrypsin deficiency In: Crystal RG, editor. Alpha 1‐Antitrypsin Deficiency. New York : Marcel Dekker, Inc, 1996, 3–18. [Google Scholar]
- 46. Jones PW, Agusti AG. Outcomes and markers in the assessment of chronic obstructive pulmonary disease. Eur Respir J. 2006; 27: 822–832. [DOI] [PubMed] [Google Scholar]
- 47. Tzortzaki EG, Tsoumakidou M, Makris D, Siafakas NM. Laboratory markers for COPD in “susceptible” smokers. Clin Chim Acta. 2006; 364: 124–138. [DOI] [PubMed] [Google Scholar]
- 48. Gan WQ, Man SF, Senthilselvan A, Sin DD. Association between chronic obstructive pulmonary disease and systemic inflammation: a systematic review and a meta‐analysis. Thorax. 2004; 59: 574–580. [DOI] [PMC free article] [PubMed] [Google Scholar]
- 49. Karadag F, Karul AB, Cildag O, Yilmaz M, Ozcan H. Biomarkers of systemic infl ammation in stable and exacerbation phases of COPD. Lung. 2008; 186: 403–409. [DOI] [PubMed] [Google Scholar]
- 50. Lomas DA, Silverman EK, Edwards LD, Miller BE, Coxson HO, Tal‐Singer R. Evaluation of serum CC‐16 as a biomarker for COPD in the ECLIPSE cohort. Thorax. 2008; 63: 1058–1063. [DOI] [PubMed] [Google Scholar]
- 51. Sin DD, Man SF, Marciniuk DD, Ford G, FitzGerald M, Wong E, York E, Mainra RR, Ramesh W, Melenka LS, Wilde E, Cowie RL, Williams D, Gan WQ, Rousseau R. The effects of fluticasone with or without salmeterol on systemic biomarkers of inflammation in chronic obstructive pulmonary disease. Am J Respir Crit Care Med. 2008; 177: 1207–1214. [DOI] [PubMed] [Google Scholar]
- 52. Keatings VM, Collins PD, Scott DM, Barnes PJ. Differences in interleukin‐8 and tumor necrosis factor‐alpha in induced sputum from patients with chronic obstructive pulmonary disease or asthma. Am J Respir Crit Care Med. 1996; 153: 530–534. [DOI] [PubMed] [Google Scholar]
- 53. Brightling CE, Monteiro W, Ward R, Parker D, Morgan MD, Wardlaw AJ, Pavord ID. Sputum eosinophilia and short‐term response to prednisolone in chronic obstructive pulmonary disease: a randomised controlled trial. Lancet. 2000; 356: 1480–1485. [DOI] [PubMed] [Google Scholar]
- 54. Tsoumakidou M, Tzanakis N, Chrysofakis G, Kyriakou D, Siafakas NM. Changes in sputum T‐lymphocyte subpopulations at the onset of severe exacerbations of chronic obstructive pulmonary disease. Respir Med. 2005; 99: 572–579. [DOI] [PubMed] [Google Scholar]
- 55. Yamamoto C, Yoneda T, Yoshikawa M, Fu A, Tokuyama T, Tsukaguchi K, Narita N. Airway inflammation in COPD assessed by sputum levels of interleukin‐8. Chest. 1997; 112: 505–510. [DOI] [PubMed] [Google Scholar]
- 56. Hill AT, Bayley D, Stockley RA. The interrelationship of sputum inflammatory markers in patients with chronic bronchitis. Am J Respir Crit Care Med. 1999; 160: 893–898. [DOI] [PubMed] [Google Scholar]
- 57. Vernooy JH, Lindeman JH, Jacobs JA, Hanemaaijer R, Wouters EF. Increased activity of matrix metalloproteinase‐8 and matrix metalloproteinase‐9 in induced sputum from patients with COPD. Chest. 2004; 126: 1802–1810. [DOI] [PubMed] [Google Scholar]
- 58. Franciosi LG, Page CP, Celli BR, Cazzola M, Walker MJ, Danhof M, Rabe KF, Della Pasqua OE. Markers of disease severity in chronic obstructive pulmonary disease. Pulm Pharmacol Ther. 2006; 19: 189–199. [DOI] [PubMed] [Google Scholar]
- 59. Luisetti M, Ma S, Iadarola P, Stone PJ, Viglio S, Casado B, Lin YY, Snider GL, Turino GM. Desmosine as a biomarker of elastin degradation in COPD: current status and future directions. Eur Respir J. 2008; 32: 1146–1157. [DOI] [PubMed] [Google Scholar]
- 60. Montuschi P, Collins JV, Ciabattoni G, Lazzeri N, Corradi M, Kharitonov SA, Barnes PJ. Exhaled 8‐isoprostane as an in vivo biomarker of lung oxidative stress in patients with COPD and healthy smokers. Am J Respir Crit Care Med. 2000; 162: 1175–1177. [DOI] [PubMed] [Google Scholar]
- 61. Kostikas K, Papatheodorou G, Psathakis K, Panagou P, Loukides S. Oxidative stress in expired breath condensate of patients with COPD. Chest. 2003; 124: 1373–1380. [DOI] [PubMed] [Google Scholar]
- 62. Kharitonov SA, Barnes PJ. Exhaled biomarkers. Chest. 2006; 130: 1541–1546. [DOI] [PubMed] [Google Scholar]
- 63. Sung HJ, Cho JY. Biomarkers for the lung cancer diagnosis and their advances in proteomics. BMB Rep. 2008; 41: 615–625. [DOI] [PubMed] [Google Scholar]
- 64. Danel C, Erzurum SC, McElvaney NG, Crystal RG. Quantitative assessment of the epithelial and inflammatory cell populations in large airways of normals and individuals with cystic fibrosis. Am J Respir Crit Care Med. 1996; 153: 362–368. [DOI] [PubMed] [Google Scholar]
- 65. Heguy A, Harvey BG, O’Connor TP, Hackett NR, Crystal RG. Sampling‐dependent up‐regulation of gene expression in sequential samples of human airway epithelial cells. Mol Med. 2003; 9: 200–208. [DOI] [PMC free article] [PubMed] [Google Scholar]
- 66. Chari R, Lonergan KM, Ng RT, MacAulay C, Lam WL, Lam S. Effect of active smoking on the human bronchial epithelium transcriptome. BMC Genomics. 2007; 8: 297. [DOI] [PMC free article] [PubMed] [Google Scholar]
- 67. Barnes PJ, Shapiro SD, Pauwels RA. Chronic obstructive pulmonary disease: molecular and cellular mechanisms. Eur Respir J. 2003; 22: 672–688. [DOI] [PubMed] [Google Scholar]
- 68. Garber ME, Troyanskaya OG, Schluens K, Petersen S, Thaesler Z, Pacyna‐Gengelbach M, Van De Rijn M, Rosen GD, Perou CM, Whyte RI, Altman RB, Brown PO, Botstein D, Petersen I. Diversity of gene expression in adenocarcinoma of the lung. Proc Natl Acad Sci USA. 2001; 98: 13784–13789. [DOI] [PMC free article] [PubMed] [Google Scholar]
- 69. Smith RV, Schlecht NF, Childs G, Prystowsky MB, Belbin TJ. Pilot study of mucosal genetic differences in early smokers and nonsmokers. Laryngoscope. 2006; 116: 1375–1379. [DOI] [PubMed] [Google Scholar]
- 70. Spivack SD, Hurteau GJ, Jain R, Kumar SV, Aldous KM, Gierthy JF, Kaminsky LS. Gene‐environment interaction signatures by quantitative mRNA profiling in exfoliated buccal mucosal cells. Cancer Res. 2004; 64: 6805–6813. [DOI] [PubMed] [Google Scholar]
- 71. Sridhar S, Schembri F, Zeskind J, Shah V, Gustafson AM, Steiling K, Liu G, Dumas YM, Zhang X, Brody JS, Lenburg ME, Spira A. Smoking‐induced gene expression changes in the bronchial airway are reflected in nasal and buccal epithelium. BMC Genomics. 2008; 9: 259. [DOI] [PMC free article] [PubMed] [Google Scholar]
- 72. Nagai K, Betsuyaku T, Suzuki M, Nasuhara Y, Kaga K, Kondo S, Nishimura M. Dual oxidase 1 and 2 expression in airway epithelium of smokers and patients with mild/moderate chronic obstructive pulmonary disease. Antioxid Redox Signal. 2008; 10: 705–714. [DOI] [PubMed] [Google Scholar]
- 73. Lee NH, Saeed AI. Microarrays: an overiview In: Hilario E, Mackay J, eds. Methods in Molecular Biology. 2nd ed Totowa : Humana Press Inc, 2007, 265–300. [DOI] [PubMed] [Google Scholar]
- 74. Peano C, Severgnini M, Cifola I, De BG, Battaglia C. Transcriptome amplification methods in gene expression profiling. Expert Rev Mol Diagn. 2006; 6: 465–480. [DOI] [PubMed] [Google Scholar]
Associated Data
This section collects any data citations, data availability statements, or supplementary materials included in this article.
Supplementary Materials
Table S1. Smoking‐related Differentially Expressed Genes in the Trachea Epithelium of Healthy Nonsmokers and Healthy Smokers
Table S2. TaqMan RT‐PCR Validation of Microarray Results
Table S3. Smoking‐related Differentially Expressed Genes in the Small Airway Epithelium of Healthy Nonsmokers and Healthy Smokers
Table S4. Genes for Which the Trachea Epithelium Is a Reasonable Approximation of the Response to Smoking in Small Airway Epithelium
Table S5. Genes which the Trachea Epithelium is a Poor Approximation of the Response to Smoking in the Small Airway Epithelium
Table S6. Overlap of Genes Differentially Expressed in the Trachea of Healthy Smokers vs Nonsmokers with Other Reported Smoking‐Responsive Genes
Table S7. Overlap of Genes Differentially Expressed in the SAE of Healthy Smokers vs Nonsmokers with Other Reported Smoking‐Responsive Genes
Please note: Wiley‐Blackwell Publishing is not responsible for the content or functionality of any supporting information supplied by the authors. Any queries (other than missing material) should be directed to the corresponding author for the article.
Supporting info item