

Abstract
Understanding the molecular mechanisms involved in thyroid cancer progression may provide targets for more effective treatment of aggressive thyroid cancers. Epithelial-mesenchymal transition (EMT) is a major pathologic mechanism in tumor progression and is linked to the acquisition of stem-like properties of cancer cells. We examined expression of ZEB1 which activates EMT by binding to the E-box elements in the E-cadherin promoter, and expression of E-cadherin in normal and neoplastic thyroid tissues in a tissue microarray (TMA) which included 127 neoplasms and 10 normal thyroid specimens. Thyroid follicular adenomas (FA, n=32), follicular thyroid carcinomas (FTC, n=28), and papillary thyroid carcinomas (PTC, n=57) all expressed E-cadherin and were mostly negative for ZEB1 while most anaplastic thyroid carcinomas (ATC, n=10) were negative for E-cadherin, but positive for ZEB1. A validation set of 10 whole sections of ATCs showed 90% of cases positive for ZEB1 and all cases were negative for E-cadherin. Analysis of three cell lines (normal thyroid, NTHY-OR13-1; PTC, TPC-1 and ATC, THJ-21T) showed that the ATC cell line expressed the highest levels of ZEB1 while the normal thyroid cell line expressed the highest levels of E-Cadherin. Quantitative RT-PCR analyses showed that Smad7 mRNA was significantly higher in ATC than in any other group (p<0.05). These results indicate that ATCs show evidence of EMT including decreased expression of E-cadherin and increased expression of ZEB1 compared to well differentiated thyroid carcinomas and that increased expression of Smad7 may be associated with thyroid tumor progression.
Keywords: Thyroid carcinoma, Anaplastic thyroid carcinoma, ZEB1, Smad7, E-cadherin
Introduction
The aggressive behavior of anaplastic thyroid carcinoma (ATC) makes it one of the most lethal human malignancies with its rapid growth, invasion of adjacent tissues and metastases to distant organs (1, 2). Although recent studies have used multiple chemotherapeutic approaches to improve the prognosis of some patients with ATCs (2), it remains one of the most lethal cancers. Understanding the molecular mechanisms involved in thyroid cancer progression may provide targets for the effective treatment of ATC and other aggressive thyroid cancers.
Epithelial-mesenchymal transition (EMT) is a major pathologic mechanism in epithelial tumor progression. Local invasion and metastasis are linked to the acquisition of stem-like properties of cancer cells (3, 4). TGFbeta induces EMT by both Smad-dependent and-independent signaling events (5–11). TGFbeta1 ligand extends its signaling effects by activating a heteromeric receptor of two transmembrane serine/threonine kinases type I and type II receptors (TGFbetaR1 and TGFbetaRII). TGFbetaRII transphosphorylates TGFbetaR1 by activating its kinase function and then phosphorylates intracellular Smad 2/3. The transphosphorylated Smads 2/3 associates with Smad4 and the activated complex is translocated to the nucleus where it interacts with other transcriptional co-activators and co-repressors to regulate expression of numerous genes (9–11). The Smad-dependent signaling which includes the stimulatory Smads(Smad 2/3, Smad 4 and inhibitory Smads including Smad7 regulates expression of various transcription factors that help to regulate EMT including Snail, Slug, Twist, ZEB1, and ZEB2 (9, 10). ZEB1/2 are important regulators of EMT during embryonic development and in cancer (11, 12). ZEB1/2 activates EMT by binding to E-box elements present in the E-cadherin promoter and suppressing its synthesis (13). ZEB1 also promotes EMT by repressing expression of basement membrane components and cell polarity proteins (14–17). Our recent studies showed that ATCs showed evidence of EMT with expression of high levels of Slug and Twist and low levels of E-cadherin compared to well differentiated thyroid carcinomas (18). To further investigate the role of ZEB1 and E-cadherin on EMT and on thyroid cancer progression, we examined the association between ZEB1, E-cadherin, and Smad 7 proteins in normal thyroid, benign thyroid tumors and in well differentiated thyroid carcinomas and ATCs.
Methods
Patient Material
Formalin fixed paraffin embedded (FFPE) tissues from 137 cases were used to construct a tissue microarray (TMA) as previously reported (18). Briefly, the TMA consisted of 10 normal thyroids, 32 follicular adenomas (FA), 28 follicular carcinomas (FTC), 57 papillary thyroid carcinomas (PTC) made up of 29 conventional PTC, 28 follicular variants of PTC (FVPTC), and 10 ATCs. The study was approved by the IRB at the University of Wisconsin Medical Center. The TMA consisted of triplicate 0.6mm cores made by using a manual tissue microarray (Beecher Instrument, Sun Prairie, WI, USA). The normal thyroid consisted of tissues from patients undergoing surgery for hyperparathyroidism or the opposite (histologically normal) thyroid lobe in patients with follicular or papillary carcinomas. Selection of regions in the tissue block for the cores included two cores from the periphery of the lesion and one core from the center of the lesion. A set of tissues consisting of 10 whole sections of ATC were used to validate the findings from the TMA.
Cell Lines
The normal thyroid cell line NTHY-ORI 3-1 was purchased from Sigma chemical (St Louis, MO, USA). TPC-1 cell line, which is a PTC cell line with RET-PTC rearrangement, but no BRAF mutation (19), was kindly provided by Dr. H. Chen (Department of Surgery, University of Wisconsin-Madison, WI USA). Both cell lines were maintained in RPMI and 10% FBS plus 1% penicillin/streptomycin at 37°C, 5% CO2. The THJ-21T cell line was kindly provided by Dr. J. Copland (Department of Cancer Biology, Mayo Clinic, Jacksonville, FL, USA) and maintained in RPMI with 10% FBS, 1% non-essential amino acids, 1% sodium pyruvate and 1% penicillin/streptomycin at 37°C, 5% CO2.
Immunohistochemistry
For automated immunostaining, 5 microns thick tissue microarray sections were deparaffinized followed by heat-induced epitope retrieval using the Lab Vision PT module (Thermo Scientific) with Lab Vision citrate bufferer pH 6.0. All immunolabeling was performed at room temperature using the Lab Vision 360 LV-1 Autostainer system (Thermo Scientific). All reagents used were from Biocare Medical, Chicago Il, USA, except where noted. Endogenous peroxidase was blocked for 5 min with Peroxidazed 1. Nonspecific protein binding was blocked by Sniper and nonspecific avidin was blocked using the Avidin-Biotin kit, incubating 15 min for each reagent. Antibodies to E-cadherin (Cell Signaling Technology, Beverley, MA, USA, clone 24#10, 1:400), ZEB1 (Genway, 1/25), and Smad7 (Abnova, 1/500) were incubated for 60 min followed by incubation with biotinylated goat anti-mouse IgG for 15 min and subsequent 4plus Streptavidin-HRP treatment for 15 min. Beta-zoid Diaminobenzidene and Mayer’s Hematoxyin were each incubated for 1 min. Primary antibodies were omitted in negative controls, which resulted in no staining. For positive controls, thyroid tumors previously shown to express the antigen of interest by immunohistochemistry and by RT-PCR were used. For manual immunostaining with the large tissue sections of ATC used in the validation studies, full tissue sections of the anaplastic thyroid carcinomas were deparaffinized followed by microwave heat-induced epitope retrieval with 10 mM citrate buffer pH 6 for 20 min. Endogenous peroxidase was blocked with 3% hydrogen peroxide for 15 min followed by incubation for 30 min with the Universal Peroxidase Reagent Kit (Vector Laboratories, Burlingame, CA, USA) and developed with the ImmPACT DAB Kit (Vector Laboratories) and Gills Hematoxylin (Vector Laboratories) incubating each for 1 min.
The immunohistochemistry scoring was performed by two independent observers (CMG and RVL) using conventional bright field microscopy and differences in interpretation were reviewed for consensus. Unequivocal nuclear staining pattern for ZEB1, cytoplasmic staining for Smad7, and membranous staining for E-Cadherin were interpreted based on the intensity as negative, weak (1+), moderate (2+), and strong (3+). The expression was considered focal if positive cells comprised of 2–25% of all tumor cells in the tissue microarray sample and diffuse if this ratio was >25%. Focal staining of <1% of all tumor cells was considered to be negative.
RNA isolation and quantitative RT-PCR
Sections of formalin fixed paraffin embedded (FFPE) tumor samples (100 microns) were deparaffinized with succession of xylene and ethanol washes. Sections of cell lines were also used for RNA extraction. Total RNA was isolated with TRIzol Reagent (Invitrogen, Grand Island, NY, USA) according to manufacturer’s instructions. RNA quality and concentration were assessed on the NanoDrop 1000 (Thermo Scientific, Pittsburgh PA, USA). Total RNA of 1 μg was reverse transcribed using the All-In-One First-Strand cDNA Synthesis Kit (GeneCopoeia, Rockville, MD, USA) with Oligo(dT) primer. PCR primers used were as follows: ECAD forward 5′-CCAGGAACCTCTGTGATGGA-3′ and ECAD reverse 5′-TTTTGTCAGGGAGCTCAGGA-3′, ZEB1 forward 5′-GCACAACCAAGTGCAGAAGA-3′ and ZEB1 reverse 5′-GCCTGGTTCAGGAGAAGATG-3″, Smad7 forward 5′-TCACCTTAGCCGACTCTGC-3′ and Smad7 reverse 5′-ACACCCACACACCATCCAC-3′. Annealing temperatures for mRNA primers was 58° C. The qRT-PCR was performed on the CFX96 PCR detection system (Bio-Rad, Hercules, CA, USA). Relative quantities were normalized to 18S and determined by the delta–delta CT method. Each experiment was repeated three times.
Statistical Analysis
Variables were assessed using x2, or with Fisher’s exact test and Student t test. Numerical variables were compared with one-way ANOVA. The statistical comparisons were performed using R software or GraphPad Prism version 5 software (San Diego, CA, USA) (18).
Results
Clinicopathological characteristics
The demographic and follow up information about the cases represented on the TMA are shown in Tables 1 and 2. Patients with ATC were older than patients in all other groups with a mean age of 74 years at diagnosis. The mean tumor size was significantly larger in the FTC and ATC groups (p<0.001, two tailed one-way ANOVA). Some of the FTC showed oncocytic features (48%). Four of the ATC had focal areas of PTC (two cases) or FTC (two cases) suggesting dedifferentiation from well differentiated carcinomas. The mean follow up ranged from 6 months to 46.5 months (Table 2). The most favorable clinical outcomes were observed in patients with PTC and the most aggressive tumors were in patients with ATC (Table 2). Five patients with ATC died of their disease while 2 patients died without disease and three patients were alive without disease. These 5 cases included patients who all had small foci of ATC which were discovered during surgery for PTCs. The 10 additional cases of ATC used as a validation set all had large cancers and they were all died from ATC within 14 months of diagnosis.
Table 1.
Patient and Tumor Characteristics of the Thyroid Tumor Cases
| Parameter | FA | FTC | PTC | ATC |
|---|---|---|---|---|
| Number of cases | 32 | 28 | 57 | 10 |
| Gender | 8M/24F | 12M/16F | 16M/41F | 4M/6F |
| Age, median (range | 48 (16–77) | 55 (18–83) | 47 (25–76) | 74 (60–86) |
| Size (mean, st dev), mm | 33.5 +/− 14.5 | 43.9 +/− 25 | 24.2 +/− 14.1 | 51.2 +/− 36.1 |
| LN metastases | 0 | 3 (11%) | 10 (33.3%) | 1 (10%) |
| Systemic metastasis | 0 | 6 (21%) | 1 (1.7%) | 4 (40%) |
FA-follicular adenoma, FTC-follicular thyroid carcinoma, PTC-papillary thyroid
carcinoma, ATC-anaplastic thyroid carcinoma
Table 2.
Clinical Outcomes of Patients with Thyroid Tumors
| Patient Outcome | FTC | PTC | ATC |
|---|---|---|---|
| Alive without disease | 16 | 44 | 3 |
| Alive with disease | 3 | 4 | 0 |
| Died of disease | 5 | 0 | 5 |
| Died, no evidence of disease | 1 | 0 | 2 |
| Lost to follow up | 3 | 9 | 0 |
| Total | 28 | 57 | 10 |
FTC-follicular thyroid carcinoma, PTC-papillary thyroid carcinoma, ATC-anaplastic
thyroid carcinoma
Immunohistochemistry
The TMA analysis is summarized in Table 3. ZEB1 staining was nuclear and it was expressed mainly by cases with ATC (Figure 1) with one patient with FTC also expressing ZEB1 (Table 3). The one case of FTC with ZEB1 expression was from a 58 year old man who had a 5.3 cm follicular carcinoma with capsular and vascular invasion. The patient subsequently developed lung metastases and died of thyroid cancer 5 years after surgery. The expression of ZEB1 was significantly higher in ATC compared to all other groups (p= 0.001). ZEB1 immunostaining was also noted in some stromal fibroblasts and endothelial cells in the TMA (Figure 1E). E-cadherin membrane staining was expressed by all cases in the normal thyroid, in FA, FTC and in PTC (Figures 1A, B). Focal staining for E-cadherin was present in 3 of 10 cases of ATC, but was absent in all other cases. Smad7 was expressed in the nuclei of all thyroid tissues, but cytoplasmic Smad7 staining was lower in the normal thyroid compared to the adenomas and carcinomas (Figure C, F and I) (Table 3). The validation set of ten additional ATCs cases showed 9 cases positive for ZEB1 (90%) with diffuse staining in all cases; all cases were negative for E-cadherin.
Table 3.
Expression of ZEB1, E-Cadherin, and SMAD7 by immunohistochemistry (positive/total cases)
| Diagnosis | |||||
|---|---|---|---|---|---|
| Antibody | NT | FA | FTC | PTC | ATC |
| ZEB1 | 0/10 (0%) | 0/32 (0%) | 1/28 (3.6%) | 0/57 (0%) | 6/10 (60%) *** |
| E-Cadherin | 10/10 (100%) | 32/32 (100%) | 28/28 (100%) | 57/57 (100%) | 3/10 (30%) *** |
| SMAD7a | 3/10 (30%) | 21/32 (65%) | 15/28 (54%) | 40/57 (70%) | 8/10 (80%) |
Immunohistochemical analysis was done on the tissue microarray and quantified as indicated in the Materials and Methods section.
NT-normal thyroid, FA-follicular adenoma, FTC-follicular thyroid carcinoma, PTC-papillary thyroid carcinoma, ATC-anaplastic thyroid carcinoma
All cases also had nuclear staining for Smad7. Data showed in Table 3 represent cytoplasmic staining
p<= 0.001 compared to all other groups.
Figure 1.

Examples of E-cadherin, ZEB1 and Smad 7 immunostaining in TMA sections of formalin-fixed paraffin-embedded sections of thyroid tissues (A–I). Membranous staining for E-cadherin was present in the normal thyroid and PTC (A and D) while most ATC were negative for E-cadherin (H). ZEB1 was expressed in the nucleus of most ATCs (1H), while the normal thyroid (B) and PTC (E) showed ZEB1 staining in the stromal fibroblast, but not in the neoplastic follicular epithelial cells. Smad7 showed nuclear staining in all cases; cytoplasmic staining and was higher in the carcinomas compared to the normal thyroid (C, F, I).
qRT-PCR
Cell lines were used to analyze expression of ZEB1 mRNA since immunostaining of the paraffin sections showed that endothelial cells and stromal fibroblasts also expressed ZEB1 (Figure 2). The normal thyroid cell line had the highest levels of E-cadherin while ZEB1 was mostly highly expressed in the ATC cell line. Analysis of the FFPE tissues for Smad 7 mRNA expression showed significantly higher levels in the ATCs compared to the well differentiated carcinomas and normal thyroids (p<0.05).
Figure 2.
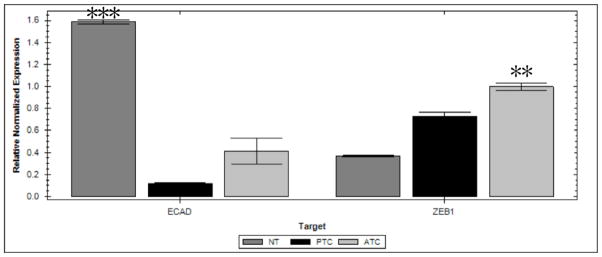
Quantitative RT-PCR analysis showing relative expression of the EMT markers E-cadherin (ECAD) and ZEB1 in thyroid cell lines. Significantly higher levels of ECAD are expressed in the normal thyroid (NT) cell line (NTHY-UR13-1) compared to the TPC-1 cell line (p<0.0005) and anaplastic thyroid carcinoma (ATC THJ-21T) (P=0.035) cell line. Significantly higher levels of ZEB1 was present in the ATC cell line compared to the PTC (p=0.02) and the normal thyroid (p=0.008) cell lines. Mean +/− SEM. (N= 3 samples for each group).
Discussion
This study showed increased expression of ZEB1 in ATCs compared to well differentiated thyroid carcinoma and normal thyroid tissues. Our laboratory (18) and others (20–23) have previously shown increased expression of Slug and Twist1 in anaplastic thyroid carcinomas compared to well differentiated carcinomas. Increased expression of ZEB1/2 and decreased expression of E-Cadherin has recently been reported in anaplastic thyroid carcinomas using molecular studies (16, 17). However this is the first demonstration of increased ZEB1 expression in ATCs using immunohistochemical analysis of paraffin embedded tissues to show nuclear localization. ZEB1 has been found to be associated with mesenchymal phenotypes in advanced pancreatic and other cancers in contrast to low expression in association with epithelial phenotypes (6). Studies of thyroid carcinomas have also shown that the leading front of PTCs has been associated with a more mesenchymal phenotype (24) suggesting EMT at the advancing front of thyroid carcinomas. Most studies of EMT in thyroid tissues have used ATC cell lines or tissues (20–23). However the study of Vasko et al with PTC tumors showed that the invasive front of the PTC overexpressed vimentin as well as TGFbeta, NFkappaB and integrin pathway members (24). They showed that EMT was common in PTC invasion and that vimentin regulated thyroid cancer EMT. The high expression of ZEB1 in primary thyroid carcinomas was significantly associated with repression of E-cadherin expression and with more aggressive carcinomas. This observation agrees with recent findings in pancreatic cancers in which ZEB1 and ZEB2 expression was associated with more aggressive behavior (6). Other studies have also shown that the miR200-family mediates posttranslational repression through sequence-specific binding to ZEB1 and ZEB2 mRNAs (16, 25, 26). The E-cadherin and N-cadherin molecules have different roles in EMT, since E-cadherin decreases during EMT while N-Cadherin increases (27). Curtis et al (27) showed that E-cadherin promote different phenotypes and behavior probably by interacting with proteins such as growth factors receptors and were responsible for the diverse cellular phenotypes observed when a cell expressed different cadherins (27). The molecular basis of EMT has not been completely elucidated (28). However the molecules involved in EMT may represent potential targets for pharmacological agents to control metastatic spread in the treatment of malignancies (28).
Quantitative qRT-PCR analysis showed significantly higher levels of Smad7 in ATC compared to the well differentiated carcinomas and normal thyroids. This suggests that high expression of this inhibitory Smad in ATC could contribute to the attenuation of canonical Smad’s antiproliferative signaling in ATCs. Matsuo et al reported that in their immunohistochemical studies with normal thyroid and well differentiated thyroid carcinomas, there were higher levels of Smad7 in the carcinomas compared to normal thyroids (29). Other investigators have also noted a role of Smad 7 in other malignancies (30–34). Although Matsuo et al (29) reported mainly cytoplasmic staining for Smad7, Smad7 was present in both the nucleus and the cytoplasm in our studies. Eloy et al (35) analyzed Smad 2/Smad3, Smad4 and Smad7 in thyroid tumors and reported nuclear expression of Smad7 and noted that nuclear expression of this Smad protein was more frequent in the encapsulated lower grade PTCs. Smad7 inhibits apoptosiss and growth arrest induced by TGF beta and activin (30, 31) and cytoplasmic Smad7 was noted to inhibit signal transduction of TGF beta as well as TGFbeta receptor activation (32). Upregulation of Smad7 has also been reported in other carcinomas including colorectal and endometrial carcinomas (34, 35), so this may be a common inhibitory mechanism in various cancers.
The use of E-Cadherin, ZEB 1 and Smad7 in recognizing more aggressive well differentiated thyroid carcinomas is premature at this stage and studies with the more aggressive variant of PTC such as tall cell carcinomas as well as widely invasive follicular carcinomas will have to be examined in future studies to establish the utility of these proteins as biomarkers for more aggressive thyroid carcinomas.
In conclusion, our study showed that ZEB1 is highly expressed in ATCs and is associated with loss of E-cadherin supporting a role for EMT in high grade thyroid carcinoma development. The presence of increased levels of expression of Smad 7 in ATCs compared to well differentiated carcinomas suggests that increased expression of Smad7 may also be associated with tumor progression in thyroid carcinomas.
Figure 3.
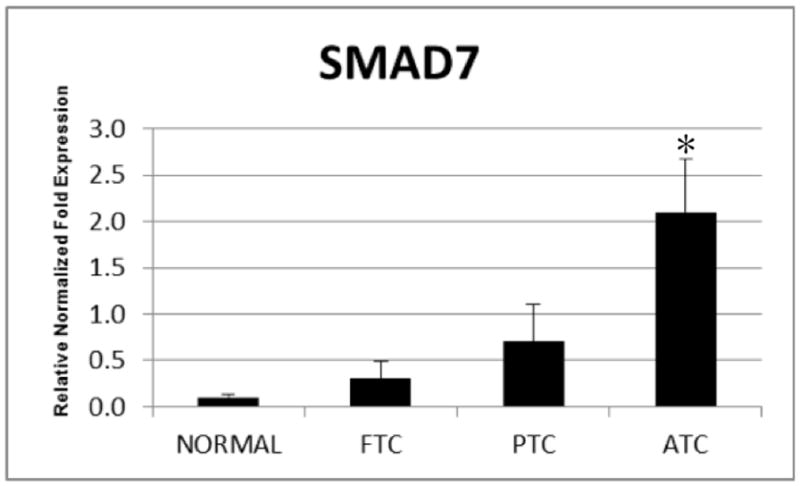
Quantitative RT-PCR showing relative expression of Smad7 from total RNA derived from FFPE samples including normal thyroid (NT), follicular thyroid carcinoma (FTC), papillary thyroid carcinoma (PTC) and anaplastic thyroid carcinoma (ATC). Expression of Smad7 is significantly higher in ATC compared to NT (p=0.01), FTC (p<0.05) and PTC (p<0.05). Mean+/− SEM. (N= 3 samples of FFPE tissues for each group from the same blocks used for TMA construction).
Acknowledgments
This work was presented in part at the 102nd United States and Canadian Academy of Pathology Annual Meeting, Baltimore Maryland, March 1–March 8, 2013.
We thank Dr. J Copland at the Mayo Clinic Jacksonville for the THJ-21T cell line, and the Translational Research in Pathology Lab at the UW School of Medicine for the TMA construction and immunohistochemistry analyses. The study was supported by NIH-R01 CA121115 and American Cancer Society MEN2 Thyroid Cancer Professorship (HC) and CCSG P30 CA014520-39(RVL).
Footnotes
Disclosure Statement
The authors declare no disclosures or conflicts of interest.
References
- 1.Kebebew E, Greenspan FS, Clark OH, Woeber KA, McMillan A. Anaplastic thyroid carcinoma. Treatment outcome and prognostic factors. Cancer. 2005;103:1330–1335. doi: 10.1002/cncr.20936. [DOI] [PubMed] [Google Scholar]
- 2.Foote RL, Molina JR, Kasperbauer JL, Lloyd RV, McIver B, Morris JC, Grant CS, Thompson GB, Richards ML, Hay ID, Smallridge RC, Bible KC. Enhanced survival in locoregionally confined anaplastic thyroid carcinoma: a single-institution experience using aggressive multimodal therapy. Thyroid. 2011;21:25–30. doi: 10.1089/thy.2010.0220. [DOI] [PubMed] [Google Scholar]
- 3.Thiery JP, Acloque H, Huang RY, Nieto MA. Epithelial-mesenchymal transitions in development and disease. Cell. 2009;139:871–890. doi: 10.1016/j.cell.2009.11.007. [DOI] [PubMed] [Google Scholar]
- 4.Polyak K, Weinberg RA. Transitions between epithelial and mesenchymal states: acquisition of malignant and stem cell traits. Nat Rev Cancer. 2009;9:265–273. doi: 10.1038/nrc2620. [DOI] [PubMed] [Google Scholar]
- 5.Das S, Becker BN, Hoffmann FM, Mertz JE. Complete reversal of epithelial to mesenchymal transition requires inhibition of both ZEB expression and the Rho pathway. BMC Cell Biol. 2009;10:94–112. doi: 10.1186/1471-2121-10-94. [DOI] [PMC free article] [PubMed] [Google Scholar]
- 6.Kurahara H, Takao S, Maemura K, Mataki Y, Kuwahata T, Maeda K, Ding Q, Sakoda M, Lino S, Ishigami S, Ueno S, Shinchi H, Natsugoe S. Epithelial-mesenchymal transition and mesenchymal-epithelial transition via regulation of ZEB-1 and ZEB-2 expression in pancreatic cancer. J Surg Oncol. 2012;105:655–661. doi: 10.1002/jso.23020. [DOI] [PubMed] [Google Scholar]
- 7.Moustakas A, Helding CH. Signaling networks guiding epithelial-mesenchymal transitions during embryogenesis and cancer progression. Cancer Sci. 2007;98:1512–1520. doi: 10.1111/j.1349-7006.2007.00550.x. [DOI] [PMC free article] [PubMed] [Google Scholar]
- 8.Ozdamar B, Bose R, Barrios-Rodiles M, Wang HR, Zhang Y, Wrana JL. Regulation of the polarity protein Par6 by TGFbeta receptors controls epithelial cell plasticity. Science. 2005;307:1603–1609. doi: 10.1126/science.1105718. [DOI] [PubMed] [Google Scholar]
- 9.Massague J. TGFB signaling in context. Nat Rev Mol Cell Biol. 2012;13:616–30. doi: 10.1038/nrm3434. [DOI] [PMC free article] [PubMed] [Google Scholar]
- 10.Drabsch Y, ten Dijke P. TGF-B signaling and its role in cancer progression and metastasis. Cancer Metastasis Rev. 2012;31:553–568. doi: 10.1007/s10555-012-9375-7. [DOI] [PubMed] [Google Scholar]
- 11.Katsuno Y, Lamouille S, Derynck R. TGFB signaling and epithelial-mesenchymal transition in cancer progression. Curr Opin Oncol. 2013;25:78–84. doi: 10.1097/CCO.0b013e32835b6371. [DOI] [PubMed] [Google Scholar]
- 12.Spaderna S, Schmaljofer O, Wahlbuhl M, Dimmler A, Bauer K, Sultan A, Hlubek F, Jung A, Strand D, Eger A, Kirchner T, Behrens J, Brabletz T. The transcriptional repressor ZEB1 promotes metastasis and loss of cell polarity in cancer. Cancer Res. 2008;68:537–544. doi: 10.1158/0008-5472.CAN-07-5682. [DOI] [PubMed] [Google Scholar]
- 13.Hurt EM, Saykally JN, Anose BM, Kalli KR, Sanders MM. Expression of the ZEB1 (deltaEF1) transcription factor in human: additional insights. Mol Cell Biochem. 2008;318:89–99. doi: 10.1007/s11010-008-9860-z. [DOI] [PubMed] [Google Scholar]
- 14.Aigner K, Dampier B, Descovich L, Mikula M, Sultan A, Schreiber M, Mikulits W, Brabletz T, Strand D, Obrist P, Sommergruber W, Schweifer N, Wernitznig A, Beug H, Foisner R, Eger A. The transcription factor ZEB1 (deltaEF1) promotes tumour cell dedifferentiation by repressing master regulators of epithelial polarity. Oncogene. 2007;26:6979–6988. doi: 10.1038/sj.onc.1210508. [DOI] [PMC free article] [PubMed] [Google Scholar]
- 15.Aigner K, Descovich L, Mikula M, Sultan A, Dampier B, Bonne S, van Roy F, Mikulits W, Schreiber M, Brabletz T, Sommergruber W, Schweifer N, Werntznig A, Berg H, Foisner R, Eager A. The transcription factor ZEB1(deltaEF) repressed Plakophilin 3 during human cancer progression. FEBS Lett. 2007;581:1617–1624. doi: 10.1016/j.febslet.2007.03.026. [DOI] [PMC free article] [PubMed] [Google Scholar]
- 16.Braun J, Hoang-Vu C, Dralle H, Huttelmaier S. Downregulation of microRNAs directs the EMT and invasive potential of anaplastic thyroid carcinomas. Oncogene. 2010;29:4237–4244. doi: 10.1038/onc.2010.169. [DOI] [PubMed] [Google Scholar]
- 17.Hebrant A, Dom G, Deqaele M, Andry G, Tresallet C, Leteurte E, Dumont JE, Maenhaut C. mRNA expression in papillary and anaplastic thyroid carcinoma: molecular anatomy of a killing switch. PLoS One. 2012;7:e37807. doi: 10.1371/journal.pone.0037807. [DOI] [PMC free article] [PubMed] [Google Scholar]
- 18.Buehler D, Hardin H, Shan W, Montemayor-Garcia C, Rush Ps, Asioli S, Chen H, Lloyd RV. Expression of epithelial-mesenchymal transition regulators SNAI2 and TWIST1 in thyroid carcinomas. Mod Pathol. 2013;26:54–61. doi: 10.1038/modpathol.2012.137. [DOI] [PMC free article] [PubMed] [Google Scholar]
- 19.Saiselet M, Floor S, Tarabichi M, Dom G, Hebrant A, van Staveren WGG, Maenhauf C. Thyroid cancer cell lines: an overview. Frontiers in endocrinology. 2012;3:1–9. doi: 10.3389/fendo.2012.00133. [DOI] [PMC free article] [PubMed] [Google Scholar]
- 20.Salerno P, Garcia-Rostan G, Piccinin S, Bencivenga TC, Di Maro G, Doglioni C, Basolo F, Maetro R, Fusco A, Santor M, Salvatore G. TWIST1 plays a pleotrophic role in determining the anaplastic thyroid carcinoma phenotype. J Clin Endocrinol Metab. 2011;96:E772–E781. doi: 10.1210/jc.2010-1182. [DOI] [PubMed] [Google Scholar]
- 21.Hardy RG, Vincente-Duenas C, Gonzalez-Herrero I, Anderson C, Flores T, Hughes S, Tselepis C, Ross JA, Sanchez-Garcia I. Snail family transcription factors are implicated in thyroid carcinogenesis. Am J Patho. 2007;171:1037–1046. doi: 10.2353/ajpath.2007.061211. [DOI] [PMC free article] [PubMed] [Google Scholar]
- 22.Liu J, Brown RE. Immunohistochemical detection of epithelial mesenchymal transition associated with stemness phenotype in anaplastic thyroid carcinoma. Int J Exp Pathol. 2010;3:755–762. [PMC free article] [PubMed] [Google Scholar]
- 23.Knauf JA, Sartor MA, Medvedovic M, Lundsmith E, Ryder M, Salzano M, Nikiforov YE, Giordano TJ, Ghossein RA, Fagin JA. Progression of BRAF-induced thyroid cancer is associated with epithelial-mesenchymal transition requiring concomitant MAP kinase and TGFbeta signaling. Oncogene. 2011;30:3153–3162. doi: 10.1038/onc.2011.44. [DOI] [PMC free article] [PubMed] [Google Scholar]
- 24.Vasko V, Espinosa AV, Scouten W, He H, Auer H, Liyanarachchi S, Larin A, Savchenko V, Francis GL, de la Chapelle A, Saji M, Ringel MD. Gene expression and functional evidence of epithelial-to-mesenchymal transition in papillary thyroid carcinoma invasion. Proc Natl Acad Sci USA. 2007;20:2803–2808. doi: 10.1073/pnas.0610733104. [DOI] [PMC free article] [PubMed] [Google Scholar]
- 25.Bracken CP, Gregory PA, Kolesnikoff N, Bert AG, Wang J, Shannon MF, Goodall GJ. A double negative feedback between ZEB1-SIP1 and the microRNA-200 family regulates epithelial-mesenchymal transition. Cancer Res. 2008;68:7846–7854. doi: 10.1158/0008-5472.CAN-08-1942. [DOI] [PubMed] [Google Scholar]
- 26.Burk U, Schubert J, Wellner U, Schmalhofer O, Vincan E, Spaderna S, Brabletz T. A reciprocal repression between ZEB1 and members of the miR200 family promotes EMT and invasion in cancer cells. EMBO Rep. 2008;9:582–589. doi: 10.1038/embor.2008.74. [DOI] [PMC free article] [PubMed] [Google Scholar]
- 27.Curtis MW, Johnson KR, Wheelock MJ. E-cadherin/catenin complexes are formed co-translationally in the endoplasmic reticulum/Golgi compartments. Cell Commun Adhes. 2008;15:365–378. doi: 10.1080/15419060802460748. [DOI] [PMC free article] [PubMed] [Google Scholar]
- 28.Guarino M, rubino B, Ballabio G. the role of epithelialmesencymal transition in cancer pathology. Pathology. 2007;39:305–318. doi: 10.1080/00313020701329914. [DOI] [PubMed] [Google Scholar]
- 29.Matsuo SE, Fiore AP, Siguematu SM, Ebina KN, Frigulietti CU, Ferro MC, Kulcsar MA, Kimura ET. Expression of SMAD proteins, TGF-beta/activin signaling mediators, in human thyroid tissues. Arg Bras Endocrinol Metabol. 2010;54:406–412. doi: 10.1590/s0004-27302010000400010. [DOI] [PubMed] [Google Scholar]
- 30.Ishisaki A, Yamato K, Nakao A, Nonaka K, Ohguchi M, ten Dijke P, Nishihara T. Smad7 is an activin-inhibin inhibitor of activin-induced growth arrest and apopstosis in mouse B cells. J Biol Chem. 1998;273:24293–24296. doi: 10.1074/jbc.273.38.24293. [DOI] [PubMed] [Google Scholar]
- 31.Halder SK, Beauchamp RD, Datta PK. Smad7 induces tumorigenesis by blocking TGF-beta-induced growth inhibition and apopstosis. Exp Cell Res. 2005;307:231–246. doi: 10.1016/j.yexcr.2005.03.009. [DOI] [PubMed] [Google Scholar]
- 32.Itoh S, Landstrom M, Hermansson A, Itoh F, Heldin CH, Heldin NE, ten Kijke P. Transforming growth factor beta1 induces nuclear export of inhibitory smad 7. J Biol Chem. 1998;273:29195–29201. doi: 10.1074/jbc.273.44.29195. [DOI] [PubMed] [Google Scholar]
- 33.Boulay JL, Mild G, Lowy A, Reuter J, Langrange M, Terracciano L, Laffer U, Herrmann R, Rochlitz C. SMAD7 is a prognostic marker in patients with colorectal cancer. Int J cancer. 2003;104:446–449. doi: 10.1002/ijc.10908. [DOI] [PubMed] [Google Scholar]
- 34.Dowdy SC, Mariani A, Reinholz MM, Keeney GL, Spelsberg TC, Podratz KC, Janknecht R. Overexpression of the TGF-beta antagonist Smad7 in endometrial cancer. Gynecol Oncol. 2005;96:368–373. doi: 10.1016/j.ygyno.2004.10.006. [DOI] [PubMed] [Google Scholar]
- 35.Eloy C, Santos J, Cameselle-Teijeiro J, Soares P, Sobrinho-Simoes M. TGF-beta/Smad pathway and RAF mutation play different roles in circumscribed and infiltrative papillary thyroid carcinoma. Virchows Arch. 2012;460:587–600. doi: 10.1007/s00428-012-1234-y. [DOI] [PubMed] [Google Scholar]