

Abstract
DNA variants (SNPs) that predispose to common traits often localize within noncoding regulatory elements such as enhancers. Moreover, loci identified by genome-wide association studies (GWAS) often contain multiple SNPs in linkage disequilibrium (LD), any of which may be causal. Thus, determining the effect of these multiple variant SNPs on target transcript levels has been a major challenge. Here, we provide evidence that for six common autoimmune disorders (rheumatoid arthritis, Crohn's disease, celiac disease, multiple sclerosis, lupus, and ulcerative colitis), the GWAS association arises from multiple polymorphisms in LD that map to clusters of enhancer elements active in the same cell type. This finding suggests a “multiple enhancer variant” hypothesis for common traits, where several variants in LD impact multiple enhancers and cooperatively affect gene expression. Using a novel method to delineate enhancer–gene interactions, we show that multiple enhancer variants within a given locus typically target the same gene. Using available data from HapMap and B lymphoblasts as a model system, we provide evidence at numerous loci that multiple enhancer variants cooperatively contribute to altered expression of their gene targets. The effects on target transcript levels tend to be modest and can be either gain- or loss-of-function. Additionally, the genes associated with multiple enhancer variants encode proteins that are often functionally related and enriched in common pathways. Overall, the multiple enhancer variant hypothesis offers a new paradigm by which noncoding variants can confer susceptibility to common traits.
Since 2005 more than 1350 genome-wide association studies (GWAS) have been published, identifying thousands of single nucleotide polymorphisms (SNPs) associated with more than 600 common traits and diseases. The vast majority of these GWAS variants (93%–96%) are located outside protein-coding genes, and only 10%–15% are in linkage disequilibrium (LD) with a protein-coding variant (Maurano et al. 2012; Schaub et al. 2012). Thus, it is hypothesized that causal GWAS variants influence the function of noncoding gene regulatory elements such as enhancers. Consistent with this hypothesis, The ENCODE Project Consortium and other groups have localized thousands of GWAS variants to enhancer elements identified through epigenomic profiling studies. Specifically, DNase I hypersensitivity site (DHS) profiling in 349 different human cell types revealed that 77% of GWAS SNPs are located in open chromatin presumed to contain enhancer elements (Maurano et al. 2012). Other studies have shown that GWAS SNPs correlate with enhancer elements marked with H3K4me1, H3K27ac, and H3K4me3, usually in cell types that are considered relevant to a given disorder (Ernst et al. 2011; Akhtar-Zaidi et al. 2012; Trynka et al. 2013).
Although a considerable number of GWAS variants have been identified and mapped to enhancer elements, our understanding of how these GWAS SNPs confer risk to a given trait is incomplete. The prevailing hypothesis posits that enhancer variants impact expression of the gene normally regulated by the enhancer. However, because the gene targets of most enhancers have not yet been identified, the impact of most enhancer variants on target transcript levels remains unknown. Even in instances where the target gene is known, assessing the transcriptional impact of the risk variant is complicated. Reporter assays can be employed, but these fail to recapitulate native chromatin context. As an alternative, one can compare levels of the predicted target gene between individuals carrying the risk allele and those carrying the nonrisk allele. However, because the enhancer landscape differs considerably between cell types, identifying the appropriate target tissue to examine is challenging. Large sample sizes are required to account for interindividual variability in gene expression. There are often multiple SNPs in LD with the “lead” SNP at any given GWAS locus, any of which could be causal. The prevailing assumption is that the causal variants are those that perturb a given regulatory element located within the locus defined by the GWAS-association signal, but this has not been thoroughly investigated for all but a few GWAS loci (Pomerantz et al. 2009; Zhang et al. 2012). It is likely that the expression of many if not most genes is often under exquisite control by multiple regulatory elements, but few studies have considered the possibility that, at a given GWAS locus, multiple LD SNPs may impact the function of more than one regulatory element and coordinately affect gene expression.
Here we provide evidence that for six human autoimmune traits, the GWAS association often arises from several polymorphisms in LD that map to multiple enhancer elements in cis and active in the same cell type. This finding suggests that, for many common traits, there is not a single causal variant that underlies the association signal, but rather several distributed among multiple enhancers that cooperatively influence gene expression. We call this the “multiple enhancer variant” hypothesis. Using a novel method to delineate enhancer–gene interactions across the epigenome, we show that for a given GWAS locus involving multiple enhancer variants, the associated enhancers always target the same gene. Using available data from HapMap and B lymphoblasts as a model system, we provide evidence at numerous loci that multiple enhancer variants cooperatively contribute to altered expression of their gene targets. Our study provides a novel explanation for how noncoding regulatory variants confer susceptibility to common traits. Our study also serves as a general framework for annotating noncoding GWAS SNPs, pinpointing the causal variants and their gene targets, and assessing their impact on target gene expression. Finally, these findings may help explain the missing heritability of many common traits and complex disorders.
Results
Common disease loci often involve multiple enhancer variants in LD
To study the impact of GWAS–enhancer variants on gene expression, we first set out to identify a specific cell type for which the enhancer landscape showed a significant correlation with SNPs associated with a given trait. To do this, SNPs (both lead SNPs and those in LD) associated with 627 traits were mapped to H3K4me1 sites (putative enhancer elements) identified through ChIP-seq in 13 different cell types (The ENCODE Project Consortium 2007; Bernstein et al. 2010; Joseph et al. 2010; Ernst et al. 2011; Hindorff et al. 2012). Among the SNPs that overlapped H3K4me1 sites, those associated with six traits including rheumatoid arthritis, Crohn's disease, systemic lupus, multiple sclerosis, ulcerative colitis, and celiac disease—generally considered autoimmune disorders—often mapped within H3K4me1 sites in B lymphoblasts (GM12878). We performed Variant Set Enrichment Analysis (Akhtar-Zaidi et al. 2012; Cowper-Sal lari et al. 2012) to test the significance of the correlations between H3K4me1 sites in B lymphoblasts and all SNPs associated with each of the six autoimmune-related traits. For comparison, 12 additional cell types were also analyzed. Highly significant correlations were found between the risk SNPs associated with all six traits and H3K4me1 sites in GM12878 cells (Fig. 1A,B; Supplemental Fig. S1). Other cell types showed correlations that were either insignificant or less significant than those observed in the B lymphoblasts. Two-thirds of the H3K4me1 sites containing SNPs were enriched for H3K27ac and were hypersensitive to DNase I digestion, and thus contain the signature features of active enhancer elements (Fig. 1C–E). Additionally, 94% were located distal (>1 kb) to transcription start sites. These results establish B lymphoblasts as a relevant model to investigate the function of enhancer variants associated with six different traits.
Figure 1.

Multiple enhancer variant loci associated with autoimmune diseases. (A) Variant Set Enrichment (VSE) analysis depicting enrichment of rheumatoid arthritis SNPs in putative enhancer elements in GM12878 cells. Boxplots represent the normalized null distribution generated using 1000 matched-random SNP sets. Diamonds correspond to the observed value relative to the null distribution. The red line denotes the threshold for significance, corrected for multiple testing. (B) Noncoding SNPs associated with rheumatoid arthritis. Shaded boxes denote instances where an H3K4me1 ChIP-seq peak detected in the indicated cell types overlaps either the GWAS lead SNP (listed to the right), or a SNP in LD with the lead SNP. The red boxes denote SNPs that drive the significant association with H3K4me1 sites in colon crypt and GM12878 cells. (C, left) Average H3K4me1 ChIP-seq signal at loci containing autoimmune disease-associated SNPs (red) and control H3K4me1 sites not associated with disease (black). (Right) H3K4me1 ChIP-seq signals at autoimmune disease-associated loci. Each row corresponds to an H3K4me1 site containing a SNP associated with any one of the six autoimmune diseases. (D) Same as C for H3K27ac. The dashed red line corresponds to the threshold of H3K27ac enrichment. (*) P < 0.004, Wilcoxon test (paired samples). (E) Same as C for DNase I hypersensitivity. The dashed red line corresponds to the threshold of DNase I HS. (F) Example of multiple enhancer variant locus associated with Crohn's disease. SNPs in LD with the lead SNP (rs762421) fall within multiple putative enhancer sites (gray boxes) enriched for H3K4me1 (black), DHS (purple), and H3K27ac (red). (G) Example of single enhancer variant locus associated with ulcerative colitis and Crohn's disease. Lead SNP (rs3024505) and LD SNPs fall in one enhancer (gray box). (H) Number of multiple enhancer variant loci and single enhancer variant loci detected for each of the six autoimmune traits. For example, for RA, 29 loci show evidence of multiple enhancer involvement, while seven show evidence of single enhancer involvement. (I) Bars display the number of GWAS loci in which the lead or LD SNP falls within coding regions (red), GM12878 putative enhancer elements (purple), and other (gray). Piecharts display the number of enhancers containing SNPs for each GWAS locus. (J) Percent of loci associated with all six autoimmune diseases showing evidence of multiple enhancer involvement in B lymphoblasts (red), compared with loci not known to be associated with a disease (gray). (**) P < 0.0001, by Fisher's exact test.
We next inspected individual loci where autoimmune SNPs overlapped putative enhancer elements in B lymphoblasts. At most loci, multiple common SNPs in LD were found to overlap multiple putative enhancers arranged in cis. We call these regions “multiple enhancer variant loci”, which we define as loci where at least two GWAS SNPs in LD overlap at least two distinct H3K4me1 sites. An example is shown in Figure 1F, where several Crohn's disease SNPs in tight LD (LOD > 2 and D′ > 0.99) with one another are located within multiple putative enhancers distributed across the ICOSLG locus. These sites are distinguished from “single enhancer variant loci”, in which one or more common SNPs overlap only one enhancer at a given locus (Fig. 1G). All six autoimmune traits showed evidence of multiple enhancer involvement. Moreover, for all six traits, the number of multiple enhancer variant loci was far greater than the number of single enhancer variant loci (Fig. 1H). The number of enhancers associated with each GWAS locus is shown in Figure 1I. Additionally, compared with 67% of autoimmune-associated enhancer SNP loci, 51% of randomly selected enhancer SNPs not associated with disease were in LD with another SNP that mapped to a separate putative enhancer (Fig. 1J). Thus, autoimmune disease-associated loci are inherently biased toward multiple enhancer involvement over the background rate at which common SNPs in LD at a given locus map to multiple enhancers. These findings led us to consider the possibility that multiple variants mapping to multiple enhancers within a given GWAS locus collectively contribute to the GWAS signal and confer genetic predisposition to common disease. We call this the “multiple enhancer variant” hypothesis.
Delineation of enhancer–gene interactions with PreSTIGE
We next set out to connect enhancer variants with their gene targets. The epigenome of a given cell type contains ∼75,000 H3K4me1 sites, and these putative enhancers can be located considerably far upstream of or downstream from the gene whose expression they influence, and can even influence the expression of multiple target genes (Spilianakis and Flavell 2004; Vernimmen et al. 2009). The most common method of assigning an enhancer to its nearest gene is imprecise. We considered previously described computational approaches designed to delineate enhancer–gene interactions (Ernst et al. 2011; Shen et al. 2012; Thurman et al. 2012), but these methods are not publicly available and their false discovery rates (FDR) are unknown (Supplemental Table S1). Moreover, when applied to GWAS, these methods link <10% of noncoding variants with a predicted gene target. Due to these limitations, we developed our own bioinformatics approach for delineating enhancer–gene interactions, which we call PreSTIGE (Predicting Specific Tissue Interactions of Genes and Enhancers). PreSTIGE integrates available H3K4me1 ChIP-seq and RNA-seq data sets from a panel of diverse cell types, and then pairs cell type-specific H3K4me1 signals with genes that are specifically expressed in each cell type (Fig. 2A; Supplemental Figs. S2–S10; Supplemental Material). Using PreSTIGE, we delineated enhancer–gene interactions in each of the 13 cell types listed in Figure 1A. Enhancer–gene predictions were made using two different gene–enhancer specificity thresholds: low and high. In each cell type, we predicted interactions for 46% and 28% of all expressed genes at low and high threshold, respectively. We verified accuracy by comparing PreSTIGE-identified interactions to those identified through multiple experimental approaches including 3C (Vernimmen et al. 2009), 5C (Sanyal et al. 2012), ChIA-PET (Li et al. 2012), and eQTL (Stranger et al. 2007; Schadt et al. 2008; Montgomery et al. 2010) analysis. The enhancer–gene interactions identified by PreSTIGE were highly enriched among interactions detected by all four methods (Supplemental Figs. S11–S14).
Figure 2.

PreSTIGE methodology and FDR. (A) PreSTIGE links cell type-specific enhancers to genes specifically expressed in the same cell type. GM12878-specific H3K4me1 sites outlined in black are predicted to interact with the SOCS1 promoter, and not the RMI2 promoter. Levels of SOCS1 and RMI2 transcripts quantified by RNA-seq in each cell type. (FPKM) Fragments per kilobase of transcript per million fragments mapped. (B) UCSC Genome Browser image of putative enhancers lost in CRC (lost VELs) relative to normal colon crypts. The three H3K4me1 sites highlighted in gray are predicted to target TCEA3 in the colon crypts. Gene expression in the colon cancer cell lines relative to the colon crypt for the predicted target, TCEA3, and nonpredicted control gene, ASAP3. Note that TCEA3 levels are reduced in CRC lines containing lost VELs while ASAP3 is unaffected. (C) UCSC Genome Browser image of a representative gained enhancer locus (gained VEL). The H3K4me1 sites highlighted in gray are predicted to target SERBP1 in CRC lines V9P and V703. Gene expression in the colon cancer cell lines relative to the colon crypt for the predicted target SERBP1 and nonpredicted control gene IL12RB2. Note that SERBP1 expression is elevated in lines containing gained VELs while IL12RB2 is unaffected. (D) Heatmap showing overall correlation between VELs and gene expression. The left side of the heatmap corresponds to the number of lost (top) or gained (bottom) VELs associated with each gene (rows) in each of the nine CRC cell lines (columns). Dark blue denotes multiple VELs, whereas white indicates no VEL. The right side of the heatmap is ordered identically to the left side, and illustrates the change in expression (CRC/crypt) of the genes associated with the VELs by PreSTIGE (left) and the nearest gene to the VEL (right). (E) Approximation of PreSTIGE FDR (mean ± SEM) based on colon cancer VEL data compared with five commonly used computational methods. (*) P < 0.003, by paired t-test.
To validate the accuracy of PreSTIGE further and assign a FDR, we took advantage of recent findings from our lab indicating that colorectal cancer (CRC) cells display variant enhancer loci (VELs), which are locus-specific losses and gains of the H3K4me1 mark relative to normal colonic crypts, from which these cancers are derived (Akhtar-Zaidi et al. 2012). Similar to a knockdown or knockout experiment, locus-specific loss of the H3K4me1–enhancer mark in CRC relative to normal crypt, i.e., a lost VEL, would be expected to lead to reduced expression of the crypt-predicted target in CRC, assuming the gene has been correctly assigned to its enhancer. Likewise, we would expect the correctly predicted target of a gained VEL in CRC to show elevated expression in CRC relative to crypts. Examples are shown in Figure 2B,C. Extending this validation approach genome-wide, we plotted the levels of all PreSTIGE-predicted gene targets of lost and gained VELs detected among nine CRC cell lines. The results show high concordance between VELs and PreSTIGE-predicted gene targets, with lost VEL genes showing reduced levels in CRC relative to crypts, and gained VEL genes showing elevated levels relative to crypts (Fig. 2D, left). The magnitude of the transcriptional effect was largely quantitative with the number of VELs involved. Genes associated with a high number of lost VELs were expressed at lower levels than genes associated with fewer lost VELs, and transcripts linked to multiple gained VELs were elevated more than genes linked to fewer gained VELs. Verifying the specificity of the predicted interactions, the correlations between VELs and gene expression were greatly diminished when the expression of the gene nearest to the VEL was analyzed (Fig. 2D, right). Additionally, the transcriptional effect was specific to the predicted gene targets of the VELs and was not observed for nearby genes not predicted to be regulated by the VEL (Supplemental Fig. S15). Overall, we estimate the FDR at 23%–38% for low stringency PreSTIGE predictions, and 13%–25% for high stringency predictions. This represents a 1.5- to 4.5-fold improvement over the nearest gene, the nearest expressed gene, and other commonly used methods for assigning enhancers to their gene targets (Fig. 2E; Supplemental Fig. S16). To evaluate our FDR approximation as conservatively as possible we next compared the PreSTIGE FDR with that of randomly assigning genes to enhancer elements. Random association of gene targets results in an FDR of 70%. We then corrected the PreSTIGE FDR based on the chance that a randomly assigned gene decreases in expression. This conservative approach approximates the FDR for PreSTIGE high stringency predictions to be 13%–35% (Supplemental Figs. S16, S17). We provide PreSTIGE as an open-source, freely available tool (for details, see Supplemental Material).
Multiple enhancer variants in LD are often predicted to target the same gene
We used PreSTIGE to predict the gene targets of the autoimmune-associated enhancer variants in B lymphoblasts. Of the 207 total autoimmune-disorder-associated loci examined, PreSTIGE predicted a gene target for 122 (59%) at low stringency and 88 (43%) at high stringency. We next divided the 88 loci into those involving multiple enhancer variants (61%) and those involving single enhancer variants (39%). Remarkably, 100% of the multiple enhancer variant loci contained at least two enhancers in cis predicted to target the same gene. As an example, we highlight the set of Crohn's disease SNPs distributed among multiple putative enhancers at the ICOSLG locus (Fig. 1F). These enhancers were predicted by PreSTIGE to interact with the ICOSLG gene. As a second example, we highlight ulcerative colitis-associated LD SNPs distributed among four enhancers, all predicted to target IRF5 (Fig. 3A). The 88 enhancer-associated loci were dispersed throughout the genome, with only a small fraction overlapping among the six different traits (Supplemental Fig. S18).
Figure 3.

Impact of multiple enhancer variants on gene expression. (A) UCSC Genome Browser image of multiple enhancer variant locus associated with ulcerative colitis. Red arrow indicates lead SNP (rs4728142). FPKMs (fragments per kilobase per million reads) of the predicted target transcript IRF5 and nonpredicted transcript TNPO3 based on SNP genotype at the ulcerative colitis locus are shown (bottom). Gray Tukey plots display the normal range of expression for each gene. (B) Percent of GWAS loci with transcripts that show differential gene expression based on SNP genotype at single (left) and multiple (right) enhancer variant loci. Enhancer SNPs linked to a gene target using PreSTIGE are shown in purple and red. Controls include the expressed gene nearest the SNP that is not a PreSTIGE-predicted target (gray) and a randomly selected expressed gene (within 500 kb) that is not a PreSTIGE-predicted target (black) (Fisher's exact test). (C) Percent of GWAS loci associated with differential gene expression for single enhancer variant loci (purple) versus all multiple enhancer variant loci (red) and loci with more than four enhancers with variants (black) (Fisher's exact test). (D–G) Expression of transcripts in B-lymphoblasts derived from individuals carrying the risk allele compared with those homozygous for the nonrisk allele for four representative loci. Gray Tukey plots display the normal range of expression for each gene. “rs” numbers correspond to the lead SNPs at each GWAS locus (Mann-Whitney-Wilcoxon test). (*) P < 0.02, (**) P < 0.007, (***) P < 0.0001.
Multiple enhancer variant loci were significantly enriched for 14 known transcription factor binding site motifs (Supplemental Table S3; Davydov et al. 2010). Many of these motifs corresponded to transcription factors with clear roles in regulating immune-system activity, including the IRF (interferon regulatory factor) family. Also of interest, 97% of multiple enhancer variant loci involve at least two enhancers that share at least one common motif, implying cooperative regulation. As an example, we highlight rs2301436, a Crohn's disease-associated locus on chromosome 6. This locus has three enhancer elements that share the motif for ELF1, a member of the ETS transcription factor family associated with autoimmune function (Gallant and Gilkeson 2006). Variants contained within single and multiple enhancer loci showed similar degrees of evolutionary conservation (Supplemental Fig. S19; Davydov et al. 2010).
Multiple enhancer variants impact target gene expression
Given that the SNPs associated with the six autoimmune traits were significantly enriched among enhancers in a B lymphoblast cell line, we reasoned that B lymphoblast lines derived from a cohort of individuals could be exploited to study the impact of multiple enhancer variants on target transcript levels. To this end, we obtained B lymphoblast transcriptome data (Pickrell et al. 2010) (RNA-seq) along with corresponding SNP genotype data from a cohort of 61 CEU individuals, made available through the International HapMap Consortium (The International HapMap Consortium 2007; The International HapMap 3 Consortium 2010). The 61 individuals were stratified by their genotypes (risk versus nonrisk) at 42 GWAS loci for which the GWAS-associated SNPs were in “perfect LD” and for which there was adequate genotypic diversity among individuals for sufficient statistical power. Of the 42 loci, 14 were single enhancer variant loci, and 28 were multiple enhancer variant loci. The levels of predicted transcripts at each locus were then plotted as FPKMs (fragments per kilobase per million reads) for each individual, stratified by genotype. Transcript levels at each locus were somewhat variable among individuals with the same genotype, reducing power. Nonetheless, 13 out of 28 (46%) multiple enhancer variant loci contained genes that were differentially expressed between individuals with the risk genotype and those with the nonrisk genotype. By comparison, a difference between risk and nonrisk genotypes was observed for only 1 out of 14 (7%) single enhancer variant loci. The rate at which single enhancer variants impacted gene expression was comparable to the background rate calculated from nearest control (nearest nonpredicted gene target) and a control set of randomly selected expressed genes (>0.3 FPKM) located within 500 kb of the lead enhancer SNP at each locus (Fig. 3A). Thus, an effect on gene expression was rarely observed for genes not predicted to be regulated by PreSTIGE. Approximately 70% of loci associated with SNPs hitting more than four enhancers contained transcripts that significantly differed between risk and nonrisk genotypes, compared with 46% of all multiple enhancer variant loci (two or more enhancers involved) and 7% of single enhancer variant loci (Fig. 3B). Results for five genes associated with multiple enhancer variants, including those found at the IRF5 (ulcerative colitis) and ICOSLG (Crohn's disease) exemplar loci, are shown in Figure 3C–G. In general, multiple enhancer variants conferred modest effects on target gene expression (<2.5-fold) and the effect was not always in the same direction. Specifically, of the loci where gene expression was significantly impacted by the genotype of the risk SNP, 75% of target transcripts were elevated, and 25% were suppressed.
Multiple enhancer variants cooperatively contribute to the effect on target transcript levels
We next took advantage of the genetic diversity among individuals within the 61-person HapMap panel to test if more than one enhancer SNP within multiple enhancer variant loci is capable of impacting the levels of the target gene. To do this, we identified regions of “imperfect LD.” SNPs in these regions of imperfect LD are reported to be in tight LD (LOD > 2 and D′ > 0.99) among the CEU population, but upon examination of the actual haplotypes within the 61-person HapMap panel, there are several individuals in which not all enhancer variants are inherited together. These loci provide an opportunity to test if multiple enhancer variants cooperatively impact gene expression. An overview of the approach is shown in Figure 4A.
Figure 4.

Effect of individual SNPs in multiple enhancer variant loci. (A) Schematic describing “imperfect LD” loci. When SNPs are in perfect LD, the lead GWAS SNP is indicative of the genotype of the entire allele and the locus includes only two haplotypes (red and purple) and three possible genotypes (red/red, red/purple, purple/purple). For loci with “imperfect LD” the lead SNP does not predict the genotype of remaining SNPs. This results in more than two haplotypes and more than three genotypes. (B) Percent of GWAS loci associated with transcripts that show differential gene expression based on SNP genotype for multiple enhancer variant loci in sites of “imperfect LD” (black) and perfect LD (red), Fisher's exact test. (C) Expression of predicted gene target (PFKFB3) of an “imperfect LD” locus which contains the RA-associated SNP rs706778. Individuals are stratified based on the genotype of each LD SNP that falls within an enhancer. (D) Each individual is color-coded based on his or her haplotype for the rs706778 “imperfect LD” locus (middle). Note that the expression of the predicted target gene PFKFB3 segregates by haplotype only when the multiple enhancer variants are in tight LD (right) (Mann-Whitney-Wilcoxon test). (E) Standard deviation of expression of predicted gene targets within multiple enhancer variant loci with “imperfect LD” for individuals stratified by lead SNP genotype (black) and stratified by haplotype (red) (Mann-Whitney-Wilcoxon test). (F) Odds ratios for multiple enhancer variant loci showing perfect (red) and imperfect LD (black) (Welch's t-test). (*) P < 0.04, (**) P < 0.009.
We stratified individuals by their genotype of the risk SNP at loci containing multiple enhancer variants, and analyzed the levels of the predicted target transcripts. At sites of imperfect LD, only 7% (two of 29) of loci contained a predicted gene target that showed a difference in gene expression between individuals stratified by the risk genotype (which was similar to the background rate of nearest and random control genes). By comparison, significant effects on target transcript levels were observed at 46% of loci in which multiple enhancer variants were inherited in perfect LD (Fig. 4B). An example of imperfect LD is shown in Figure 4C. Here, the rheumatoid arthritis risk SNP rs706778 is in imperfect LD with three additional SNPs (rs3134883, rs3118470, and rs7090530). Both SNPs rs706778 and rs3134883 map to one enhancer; rs3118470 and rs7090530 map to a separate enhancer. Both enhancers are predicted to regulate PFKFB3. PFKFB3 levels are not significantly different between individuals stratified by the genotype of any one of the four SNPs (Fig. 4C). However, examination of the haplotypes reveals multiple alleles within the population, including homozygotes for the common nonrisk allele CGTC (purple), heterozygotes for the common risk allele TACA (red), and individuals with haplotypes that vary from the two common alleles (CGTA and TGTA, black and gray). Upon exclusion of the individuals with the uncommon alleles where the LD structure is disrupted, a robust difference in PFKFB3 levels is clearly apparent between individuals who are homozygous for the nonrisk alleles and those heterozygous for the risk allele (Fig. 4D). Thus, the effect on gene expression depends on the genetic makeup of multiple SNPs within the haplotype, not just one enhancer SNP. Moreover, the SNPs associated with both enhancers need to be considered when assessing the impact on target gene expression.
We noted a high degree of variability in target transcript levels when individuals were stratified by the genotype of the risk SNP. Moreover, this variability was reduced substantially upon stratification by haplotype (Fig. 4D, cf. left to right). We extended this analysis to all 29 imperfect LD loci, plotting the average standard deviation of each target gene when stratified by the lead SNP versus the haplotype. When the entire haplotype was considered, a significant decrease in variability of transcript levels was observed (Fig. 4E). This further demonstrates that, for a given locus, SNPs at more than one enhancer are likely to mediate the transcriptional effect. Furthermore, odds ratios for risk annotation at loci involving multiple enhancer variants in perfect LD were generally higher than those in imperfect LD (Fig. 4F).
Gene targets of multiple enhancer variants are highly cell type-specific and functionally related
We noticed that PreSTIGE identified gene targets of GWAS enhancer–SNPs at a much higher rate than expected given PreSTIGE's baseline prediction rate. Specifically, although only 33% of all GM12878-specific H3K4me1 sites were assigned to a gene, 55% of GM12878-specific H3K4me1 sites containing an immune-related GWAS SNP were assigned to a gene (Fig. 5A). To investigate the basis for this bias, we “scored” all enhancers and genes by their relative levels of specificity in GM12878 cells compared with 11 other cell types. We then plotted the range of specificity scores for all enhancers and genes in GM12878 cells, enhancers and genes predicted by PreSTIGE in GM12878 cells, and PreSTIGE-predicted enhancers and genes contained within multiple enhancer variant loci. Enhancers contained within disease-associated multiple enhancer variant loci were slightly more GM12878-specific than all PreSTIGE-predicted enhancers (Fig. 5B, cf. red to gray). By comparison, genes associated with multiple enhancer variant loci were highly GM12878-specific (Fig. 5C, cf. purple to gray). Thus, PreSTIGE assigns GWAS enhancer variants to genes at a high rate because the genes associated with GWAS enhancer variants are highly cell type-specific. Genes associated with multiple enhancer variants were enriched for specialized immune functions including “regulation of immune response,” “response to interferon-gamma,” and “IL2 receptor activity” (Fig. 5D). Furthermore, genes associated with each trait were frequently enriched within common pathways (Fig. 5D). Thus, although multiple enhancer variant loci associated with a given trait are dispersed throughout the genome, the associated genes encode proteins that share similar functions and may be components of common pathways.
Figure 5.
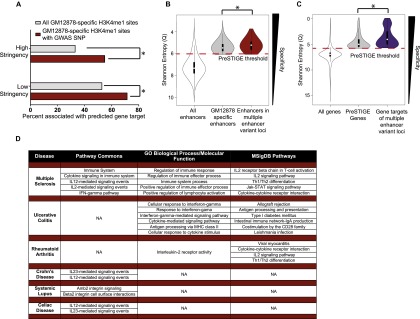
Gene targets of multiple enhancer variants are highly cell type-specific and functionally related. (A) Percent of H3K4me1 sites that are associated with a PreSTIGE prediction, for all GM12878 cell type-specific H3K4me1 sites (gray) and GM12878-specific sites that contain a GWAS SNP that is associated with the six immune-related disorders (red) (χ2, P-value < 0.0001). (B) Cell type specificity (Shannon entropy Q score) of all enhancers in the 12 cell line comparator set (white), GM12878 cell type-specific enhancers (gray), and enhancers containing disease-associated SNPs (red) (Mann-Whitney-Wilcoxon test, P-value < 5.3 × 10⁻⁶). (C) Cell type specificity (Shannon entropy Q-score) of all genes (white), genes associated with a PreSTIGE prediction in GM12878 (gray), and predicted gene targets of disease-correlated SNPs (purple) (Mann-Whitney-Wilcoxon test, P-value < 5.3 × 10⁻⁶). (D) GREAT results for each of the six diseases. Top five significant results are shown for Pathway Commons, GO biological processes/molecular function, and MSigDB pathways categories for each trait.
Many common traits show evidence of multiple enhancer involvement
We next tested if traits other than the six autoimmune diseases showed evidence of multiple enhancer involvement. We downloaded the entire NHGRI catalog of GWAS variants (Hindorff et al. [Sept. 18, 2012]), which as of September 2012 contained 7106 SNPs associated with 627 traits. We discarded all GWAS entries for which the SNP or any of its LD SNPs mapped within a coding region to identify 5824 noncoding trait-associated SNPs. These SNPs (lead SNPs and all those in LD) were intersected with H3K4me1 sites for which PreSTIGE identified a gene target in any one of 12 cell types. The traits were hierarchically clustered based on the number of GWAS loci within predicted enhancers for each cell type, and the results were plotted as a heatmap (Fig. 6A). Interestingly, related traits clustered within cell types generally considered relevant to the pathophysiology of the trait. For example, a cluster of liver-related traits including phospholipid levels, triglyercides-blood pressure, and cholesterol was observed in hepatocellular carcinoma cells (HepG2) (Fig. 6B). Neural-related traits including cognitive performance, bipolar disorder, and Alzheimer's disease correlated with enhancer–gene predictions made in neural precursor cells (NPC) (Fig. 6C). We quantified the number of liver-related traits found in the HepG2 trait cluster versus those in different cell types. Approximately 63% of the HepG2 cluster was comprised of liver traits, compared with 5%–10% in other cell types. The traits found in each cluster are listed in Supplemental Table S4. These findings are consistent with other studies showing a correlation between GWAS SNPs and enhancers in cell types generally considered relevant to a given trait (Ernst et al. 2011; Akhtar-Zaidi et al. 2012; Maurano et al. 2012). Next, we determined the percentage of GWAS loci containing multiple enhancer variants for the traits in each cluster (Fig. 6D). Remarkably, GWAS loci associated with traits in all 12 cell types showed evidence of multiple enhancer involvement, ranging from 58% of loci associated with B lymphoblast (GM12878) traits to 25% of loci associated with H1ES and MCF-7 trait clusters. In total, for all trait-associated enhancer loci, 48% involved a multiple enhancer variant locus in at least one of the 12 cell lines (Fig. 6D, black bar). Overall, these findings suggest that multiple enhancer involvement is not limited to the six traits associated with B lymphoblast enhancers, and that this trend may be a general feature of GWAS traits.
Figure 6.

Multiple enhancer variant loci are a common feature of many GWAS traits. (A) Hierarchical clustering of disease traits based on the number of SNPs that intersect with H3K4me1 sites linked to a gene target with PreSTIGE. Cluster of disease traits that correlate with SNPs present in HepG2 (B) and NPC (C) predicted enhancers (zoomed image HepG2 and NPC clusters in A). Genes predicted to be targeted by the disease-correlated SNPs are shown to the right. Columns are ordered as shown in A. (D) Percent of GWAS enhancer loci that involve multiple enhancer variants for each cluster highlighted in A.
Discussion
In this study, we present several lines of evidence in support of a “multiple enhancer variant” hypothesis for GWAS traits. We demonstrated that for certain traits, particularly those with an autoimmune component, multiple SNPs in LD at a given locus influence multiple enhancers of a given gene. Using available data from HapMap and B lymphoblasts as a model system, we provide evidence at numerous loci that multiple enhancer variants contribute to altered expression of the predicted gene targets. The multiple enhancer variants can confer either gain- or loss-of-function effects, elevating or reducing transcript levels. The effects on gene expression tend to be modest, consistent with the action of enhancers as modulators of gene expression, rather than binary switches, as previously proposed (Bajpai et al. 2010; Schnetz et al. 2010). The modest effects may become more pronounced in response to a given stimulus, as it is now well established that enhancer elements can dynamically respond to a variety of cellular cues or environmental changes (Giorgetti et al. 2010; Heinz et al. 2010; Rada-Iglesias et al. 2011; Zentner et al. 2011; Lin et al. 2013).
Some aspects of GWAS have been difficult to explain. For example, GWAS signals tend to be relatively broad, and it is often difficult to fine map these loci and narrow down the location of the causal SNP. The multiple enhancer variant hypothesis provides an explanation for these puzzling aspects of GWAS studies, since the presence of several SNPs distributed among multiple enhancers throughout the locus, rather than a single SNP, often accounts for the association signal and the impact on target gene expression. Additionally, we note that odds ratios at multiple enhancer variant loci harboring SNPs in perfect LD were generally higher than at loci of imperfect LD. GWAS typically pool cases and controls with mixed genotypes, using HapMap data from ethnically related populations to approximate LD structure. This would likely result in an underestimate of the actual effect sizes, which in turn could account for some of the missing heritability commonly seen in GWAS. Moreover, because the impact on gene expression is typically conferred by multiple enhancer variants that are in tight LD, GWA studies utilizing case–control samples with mixed LD structures may hinder detection of true association signals.
Why do GWAS loci often contain multiple enhancer variants? One possibility is that SNPs affecting a single enhancer are not sufficient to impact expression of the target gene. Alternatively, SNPs at a single enhancer could impact expression, but the degree of change is not sufficient to incur risk. We currently cannot distinguish between these possibilities. It is noteworthy that there are numerous examples of Mendelian diseases caused by mutations in a single enhancer, including preaxial polydactyly and Hirchsprung's disease (Visel et al. 2009). SNPs at the SOX9 locus that confer risk to prostate cancer disrupt transcription factor binding sites at a single enhancer and alter SOX9 transcript levels in prostate cancer cells (Zhang et al. 2012). Moreover, in our studies of enhancer function in colon cancer cells, aberrantly expressed genes in colon cancer cells were usually associated with epigenetic alterations of multiple enhancers, but there were numerous examples where epigenetic loss or gain of a single enhancer altered target transcript levels (Akhtar-Zaidi et al. 2012). Thus, although we provide evidence that many GWAS loci involve multiple enhancer variants, there are likely numerous examples where a given GWAS SNP(s) impacts a single enhancer and is sufficient to incur a biological effect. How often single versus multiple variant loci occur remains to be determined, but our data suggest that these examples of single variant SNPs influencing gene expression are far rarer than instances in which two or more enhancer variants cooperate to impact expression and confer risk. DNA-editing approaches using CRISPR/Cas or TALEN-based technologies could help distinguish between these possibilities and further refine the identity of the most influential SNPs within a given locus.
We have also considered the possibility that multiple enhancer variants provide some selective advantage during evolution. Such is the case for traits associated with “thrifty genes” such as those involved in type 2 diabetes mellitus, where one sees a past selective advantage for what is now the risk allele. Interestingly, population genome-wide scans for positive selection have reproducibly yielded genes with autoimmune-related functions (Barreiro and Quintana-Murci 2010), which may explain why multiple enhancer involvement was particularly common among the loci associated with the six autoimmune traits studied here.
The past decade has observed an explosion of activity in the identification of SNPs associated with common traits through GWAS. However, the identification of most of the genes that serve as the molecular basis of the risk etiology, as well as the identification of the causal variants, has not been nearly as successful. This is due in part to an inability to connect a risk allele to a target gene, and an inability to functionally test the transcriptional impact of the risk allele once the target gene has been identified. In fact, some critics have suggested that, even with knowledge of the target gene, the target gene will fail to show an expression difference between individuals with the risk variant versus those with the nonrisk variant, because of interindividual variability in gene expression or other confounding factors. The results of our study suggest otherwise. Specifically, when the target gene of the risk allele is known, the appropriate cell type is utilized, and the SNPs in tight LD at a given locus are considered together, the impact on target gene expression is clearly evident. These findings should have important implications for studies by the ENCODE and GTEx consortia or other groups seeking to decipher the impact of genetic variation on gene expression in all human cell types. The results of our study also suggest that accurate identification of genes regulated by multiple enhancer variants could reveal common, and potentially “druggable,” pathways frequently altered among individuals with a given common disease.
Methods
PreSTIGE prediction methodology
To connect cell type-specific enhancers to genes we considered multiple linear domain models. We systematically evaluated the use of domain models that rely on the distance between enhancers and genes, as well as those that utilized CTCF binding sites to set domain boundaries. The final domain model, selected to maximize the number of predictions made while maintaining the lowest FDR, utilizes 100 kb as a distance boundary in addition to a subset of CTCF sites to generate predicted interactions. For details on how the domain model was selected and evaluated, see Supplemental Material. For an interaction to be predicted in a given cell line, the normalized H3K4me1–enhancer signal had to be high above background (>10) and both the enhancer and the gene have to be specific to the cell line. Specificity was determined by calculating Shannon entropy Q scores. Details on the development and validation of the PreSTIGE methodology can be found in the Supplemental Material and Supplemental Figs. S2–S16.
ChIP-seq data processing
Publicly available H3K4me1 ChIP-seq and matched input data files were obtained for the 12 cell lines of the comparator set (see Supplemental Table S2A) and aligned to hg18 with BWA (Li and Durbin 2009). Duplicate reads were removed with SAMtools (Li et al. 2009). Matched inputs for each sample were trimmed to 10 million reads prior to alignment and used for peak calling with MACS (Zhang et al. 2008). Called peaks were used to generate a list of potential enhancer sites. All identified ChIP enriched peaks across the 12 cell lines were then compiled and overlapping peaks were collapsed resulting in 309,713 regions. The maximum signal was then retrieved in each region across all 12 cell lines and the results were tabled. To normalize for read depth and varying enrichment across ChIP samples, maximum signals were quantile normalized. Shannon entropy scoring was performed on normalized maximum signals to quantify cell type specificity for each region.
RNA-seq data processing
Publicly available RNA-seq data were obtained for all 12 cell lines of the comparator set (Supplemental Fig. S2A). Reads were aligned to hg18 with TopHat (Trapnell et al. 2009) allowing for a maximum of 10 multiple alignments. Gene expression score FPKM was determined for all RefSeq genes using Cufflinks (Trapnell et al. 2010). An FPKM threshold of 0.3 was chosen to balance the false discovery and false negative rates as described by Ramskold et al. (2009). Genes with FPKMs <0.3 were rounded to zero and then the results were tabled. The data obtained for neural precursor cells (NPCs) was sequenced on the ABI SOLiD platform, and was aligned using TopHat modified for colorspace reads. Given the different platforms used in sequencing the 12 samples, FPKMs were quantile normalized. Shannon entropy scoring was then performed on the normalized FPKMs to score cell line specificity of gene expression.
Colon cancer VEL data validation
H3K4me1 ChIP-seq and matching input (Supplemental Table S3B) for the colon crypt was processed as described above. The crypt peaks were added to the 309,713 peaks of the comparator set and peaks within 1 bp were consolidated. The maximum signal in all regions was obtained for all 13 cell lines and the results were tabled and quantile normalized. These results were then Shannon entropy scored. Previously published Affymetrix Human Exon 1.0 ST exon array data for healthy colon crypt and colon cancer cell lines were also obtained (Akhtar-Zaidi et al. 2012). The median PLIER normalized expression score across three biological replicates of the colon crypt was used in subsequent analysis. To accurately compare colon crypt array data to the RNA-seq data of the comparator set, array expression was quantile normalized with the RNA-seq data table and then Shannon entropy scoring was used to quantify specificity of gene expression. Predictions were made as described above for interactions that occur in the colon crypt and CRC samples. For validation of the crypt predictions, colon cancer cell lines were analyzed in pairs. H3K4me1 sites that show differential enrichment of H3K4me1 between crypt and cancer (i.e., lost VELs) and those that are defined as unchanged, present in the crypt and cancer lines, were considered for validation. As the distributions of expression were different between the six colon cancer cell lines and the median colon crypt expression, data sets were quantile normalized to control for any bias toward increase or decrease in gene expression between the cancer cell lines and the crypt due to differences in distributions.
FDR calculation with CRC VEL data
Fold changes of transcripts in colon cancer versus normal colon crypts were calculated (CRC/median of five normal crypt samples). Enhancer–gene predictions were made in the normal colon crypts and used to determine the gene targets of enhancers lost, i.e., lost VELs, in the colon cancer cell lines. If the enhancer was lost and the expression of the predicted gene targeted decreased >1.3-fold, then the enhancer–gene pair was considered successfully validated. The positive prediction rate was determined by calculating the percent of lost VEL predicted targets that decreased by >1.3-fold. Genes associated with a lost VEL that failed to show a decrease in gene expression in CRC by >1.3-fold were considered false positives. The FDR was determined by measuring the percent of genes that did not decrease by >1.3-fold. The null distribution of the FDR was determined by randomly assigning genes to colon crypt enhancers, and the percent of lost VELs that were randomly associated with a gene that decreased in expression >1.3-fold was used to calculate the null distribution for the FDR. The PreSTIGE FDR was then corrected by dividing the FDR by the FDR of randomly associating gene targets to enhancers.
Annotation of noncoding GWAS variants
We downloaded the entire NHGRI catalog of GWAS variants (Hindorff et al. [Sept. 18, 2012]). We retrieved all SNPs in LD with GWAS lead SNPs using LD blocks identified with publicly available HapMap data on the CEPH ancestry population. SNPs in strong LD (LOD > 2 and D′ > 0.99) with the lead SNP were utilized. All lead and LD SNPs were intersected with human coding exons obtained from UCSC Table Browser. If the lead SNP or any of its LD SNPs intersected with the coding sequences, that lead SNP (and its LD SNPs) was removed from the analysis. All subsequent analyses utilized the identified noncoding GWAS SNPs.
Variant Set Enrichment Analysis
To test for enrichment of immune-related disorders in B-cell enhancers we used Variant Set Enrichment Analysis. SNPs associated with one of the six disorders (rheumatoid arthritis, Crohn's disease, multiple sclerosis, systemic lupus, ulcerative colitis, and celiac disease) were intersected with the PreSTIGE-predicted enhancers for all 12 cell lines of the comparator set as well as the colon crypt. To determine if enrichment of SNPs in a given cell line is statistically significant, we generated null distributions by randomly sampling variants from the Illumina HumanOmniExpress SNP list. Random SNP sets were matched to disease-associated SNPs by size so that SNPs in the random set contained the same number of LD SNPs as the disease-associated set. Enrichment in PreSTIGE-predicted enhancers of disease-associated SNP and 1000 random size-matched sets were compared in order to obtain the significance of the enrichment (Akhtar-Zaidi et al. 2012; Cowper-Sal lari et al. 2012).
Impact of enhancer variant loci on gene expression
To determine the effect of the risk variant on the expression of the predicted gene target we obtained RNA-seq gene expression data from 61 CEU individuals (Montgomery et al. 2010) as well as the corresponding genotypes from HapMap (International HapMap Consortium 2007; The International HapMap 3 Consortium 2010). We identified individuals who were homozygous for the nonrisk allele, heterozygous for the risk allele, and homozygous for the risk allele for the GWAS loci associated with the six immune-related diseases. If fewer than three individuals were homozygous for the nonrisk allele, or fewer than three individuals inherited the risk allele, then this SNP was excluded from the analysis. We compared the gene expression of individuals who carried the risk allele (homozygous or heterozygous) with those who were homozygous for the nonrisk variant. For all analyses determining the impact of SNP genotype on expression of the target gene, the Mann-Whitney-Wilcoxon test (P-value < 0.05) was used to determine whether the effect was significant.
Enrichment of disease-associated SNPs for multiple enhancer variant loci
We determined the percentage of GWAS enhancer variants with LD SNPs that mapped to an additional enhancer predicted to target the same gene. LD SNPs were retrieved as described above. As a control we identified CEU SNPs that fall within GM12878 putative enhancers associated with PreSTIGE predictions (at high stringency) and filtered out all SNPs that have previously been associated with any disease. We then determined the percent of these control SNPs that are associated with multiple enhancer variants in LD. We randomly selected a matched number of control loci 100 times. The average of 100 iterations was utilized in Fisher's exact test comparing disease to nondisease rate of multiple enhancer variants. All analyses comparing the proportion of genes that are significantly impacted by SNP genotype were compared using Fisher's exact test.
Software availability
The PreSTIGE methodology is available for academic use at prestige.case.edu through a Galaxy interface (Giardine et al. 2005; Blankenberg et al. 2010; Goecks et al. 2010). Users can generate predictions for any cell type of interest for which H3K4me1 ChIP-seq and RNA-seq data are available. A database of the predictions for the 13 cell lines listed in Figure 1A is also available at genetics.case.edu/prestige.
Acknowledgments
We thank Anthony Wynshaw-Boris, Paul Tesar, Tom Laframboise, and Stephanie Balow for helpful comments and discussion. This work was supported by NIH grants R01CA160356 (P.C.S.), 5T32GM008056-29 (O.C.), and 5P50CA150964 (S.M., J.W.).
Footnotes
[Supplemental material is available for this article.]
Article published online before print. Article, supplemental material, and publication date are at http://www.genome.org/cgi/doi/10.1101/gr.164079.113.
References
- Akhtar-Zaidi B, Cowper-Sal-lari R, Corradin O, Saiakhova A, Bartels CF, Balasubramanian D, Myeroff L, Lutterbaugh J, Jarrar A, Kalady MF, et al. 2012. Epigenomic enhancer profiling defines a signature of colon cancer. Science 336: 736–739 [DOI] [PMC free article] [PubMed] [Google Scholar]
- Bajpai R, Chen DA, Rada-Iglesias A, Zhang J, Xiong Y, Helms J, Chang CP, Zhao Y, Swigut T, Wysocka J 2010. CHD7 cooperates with PBAF to control multipotent neural crest formation. Nature 463: 958–962 [DOI] [PMC free article] [PubMed] [Google Scholar]
- Barreiro LB, Quintana-Murci L 2010. From evolutionary genetics to human immunology: How selection shapes host defence genes. Nat Rev Genet 11: 17–30 [DOI] [PubMed] [Google Scholar]
- Bernstein BE, Stamatoyannopoulos JA, Costello JF, Ren B, Milosavljevic A, Meissner A, Kellis M, Marra MA, Beaudet AL, Ecker JR, et al. 2010. The NIH Roadmap Epigenomics Mapping Consortium. Nat Biotechnol 28: 1045–1048 [DOI] [PMC free article] [PubMed] [Google Scholar]
- Blankenberg D, Von Kuster G, Coraor N, Ananda G, Lazarus R, Mangan M, Nekrutenko A, Taylor J 2010. Galaxy: A web-based genome analysis tool for experimentalists. Curr Protoc Mol Biol 89: 19.10.1–19.10.21 [DOI] [PMC free article] [PubMed] [Google Scholar]
- Cowper-Sal lari R, Zhang X, Wright JB, Bailey SD, Cole MD, Eeckhoute J, Moore JH, Lupien M 2012. Breast cancer risk-associated SNPs modulate the affinity of chromatin for FOXA1 and alter gene expression. Nat Genet 44: 1191–1198 [DOI] [PMC free article] [PubMed] [Google Scholar]
- Davydov EV, Goode DL, Sirota M, Cooper GM, Sidow A, Batzoglou S 2010. Identifying a high fraction of the human genome to be under selective constraint using GERP++. PLoS Comput Biol 6: e1001025. [DOI] [PMC free article] [PubMed] [Google Scholar]
- The ENCODE Project Consortium 2007. Identification and analysis of functional elements in 1% of the human genome by the ENCODE pilot project. Nature 447: 799–816 [DOI] [PMC free article] [PubMed] [Google Scholar]
- Ernst J, Kheradpour P, Mikkelsen TS, Shoresh N, Ward LD, Epstein CB, Zhang X, Wang L, Issner R, Coyne M, et al. 2011. Mapping and analysis of chromatin state dynamics in nine human cell types. Nature 473: 43–49 [DOI] [PMC free article] [PubMed] [Google Scholar]
- Gallant S, Gilkeson G 2006. ETS transcription factors and regulation of immunity. Arch Immunol Ther Exp (Warsz) 54: 149–163 [DOI] [PubMed] [Google Scholar]
- Giardine B, Riemer C, Hardison RC, Burhans R, Elnitski L, Shah P, Zhang Y, Blankenberg D, Albert I, Taylor J, et al. 2005. Galaxy: A platform for interactive large-scale genome analysis. Genome Res 15: 1451–1455 [DOI] [PMC free article] [PubMed] [Google Scholar]
- Giorgetti L, Siggers T, Tiana G, Caprara G, Notarbartolo S, Corona T, Pasparakis M, Milani P, Bulyk ML, Natoli G 2010. Noncooperative interactions between transcription factors and clustered DNA binding sites enable graded transcriptional responses to environmental inputs. Mol Cell 37: 418–428 [DOI] [PubMed] [Google Scholar]
- Goecks J, Nekrutenko A, Taylor J 2010. Galaxy: A comprehensive approach for supporting accessible, reproducible, and transparent computational research in the life sciences. Genome Biol 11: R86. [DOI] [PMC free article] [PubMed] [Google Scholar]
- Heinz S, Benner C, Spann N, Bertolino E, Lin YC, Laslo P, Cheng JX, Murre C, Singh H, Glass CK 2010. Simple combinations of lineage-determining transcription factors prime cis-regulatory elements required for macrophage and B cell identities. Mol Cell 38: 576–589 [DOI] [PMC free article] [PubMed] [Google Scholar]
- Hindorff LA, MacArthur J, Morales J, Junkins HA, Hall PN, Klemm AK, Manolio TA 2012. A Catalog of Published Genome-Wide Association Studies. www.genome.gov/gwastudies
- The International HapMap Consortium 2007. A second generation human haplotype map of over 3.1 million SNPs. Nature 449: 851–861 [DOI] [PMC free article] [PubMed] [Google Scholar]
- The International HapMap 3 Consortium 2010. Integrating common and rare genetic variation in diverse human populations. Nature 467: 52–58 [DOI] [PMC free article] [PubMed] [Google Scholar]
- Joseph R, Orlov YL, Huss M, Sun W, Kong SL, Ukil L, Pan YF, Li G, Lim M, Thomsen JS, et al. 2010. Integrative model of genomic factors for determining binding site selection by estrogen receptor-α. Mol Syst Biol 6: 456. [DOI] [PMC free article] [PubMed] [Google Scholar]
- Li H, Durbin R 2009. Fast and accurate short read alignment with Burrows-Wheeler transform. Bioinformatics 25: 1754–1760 [DOI] [PMC free article] [PubMed] [Google Scholar]
- Li H, Handsaker B, Wysoker A, Fennell T, Ruan J, Homer N, Marth G, Abecasis G, Durbin R 2009. The Sequence Alignment/Map format and SAMtools. Bioinformatics 25: 2078–2079 [DOI] [PMC free article] [PubMed] [Google Scholar]
- Li G, Ruan X, Auerbach RK, Sandhu KS, Zheng M, Wang P, Poh HM, Goh Y, Lim J, Zhang J, et al. 2012. Extensive promoter-centered chromatin interactions provide a topological basis for transcription regulation. Cell 148: 84–98 [DOI] [PMC free article] [PubMed] [Google Scholar]
- Lin C, Garruss AS, Luo Z, Guo F, Shilatifard A 2013. The RNA Pol II elongation factor Ell3 marks enhancers in ES cells and primes future gene activation. Cell 152: 144–156 [DOI] [PMC free article] [PubMed] [Google Scholar]
- Maurano MT, Humbert R, Rynes E, Thurman RE, Haugen E, Wang H, Reynolds AP, Sandstrom R, Qu H, Brody J, et al. 2012. Systematic localization of common disease-associated variation in regulatory DNA. Science 337: 1190–1195 [DOI] [PMC free article] [PubMed] [Google Scholar]
- Montgomery SB, Sammeth M, Gutierrez-Arcelus M, Lach RP, Ingle C, Nisbett J, Guigo R, Dermitzakis ET 2010. Transcriptome genetics using second generation sequencing in a Caucasian population. Nature 464: 773–777 [DOI] [PMC free article] [PubMed] [Google Scholar]
- Pickrell JK, Marioni JC, Pai AA, Degner JF, Engelhardt BE, Nkadori E, Veyrieras JB, Stephens M, Gilad Y, Pritchard JK 2010. Understanding mechanisms underlying human gene expression variation with RNA sequencing. Nature 464: 768–772 [DOI] [PMC free article] [PubMed] [Google Scholar]
- Pomerantz MM, Ahmadiyeh N, Jia L, Herman P, Verzi MP, Doddapaneni H, Beckwith CA, Chan JA, Hills A, Davis M, et al. 2009. The 8q24 cancer risk variant rs6983267 shows long-range interaction with MYC in colorectal cancer. Nat Genet 41: 882–884 [DOI] [PMC free article] [PubMed] [Google Scholar]
- Rada-Iglesias A, Bajpai R, Swigut T, Brugmann SA, Flynn RA, Wysocka J 2011. A unique chromatin signature uncovers early developmental enhancers in humans. Nature 470: 279–283 [DOI] [PMC free article] [PubMed] [Google Scholar]
- Ramskold D, Wang ET, Burge CB, Sandberg R 2009. An abundance of ubiquitously expressed genes revealed by tissue transcriptome sequence data. PLoS Comput Biol 5: e1000598. [DOI] [PMC free article] [PubMed] [Google Scholar]
- Sanyal A, Lajoie BR, Jain G, Dekker J 2012. The long-range interaction landscape of gene promoters. Nature 489: 109–113 [DOI] [PMC free article] [PubMed] [Google Scholar]
- Schadt EE, Molony C, Chudin E, Hao K, Yang X, Lum PY, Kasarskis A, Zhang B, Wang S, Suver C, et al. 2008. Mapping the genetic architecture of gene expression in human liver. PLoS Biol 6: 1020–1032 [DOI] [PMC free article] [PubMed] [Google Scholar]
- Schaub MA, Boyle AP, Kundaje A, Batzoglou S, Snyder M 2012. Linking disease associations with regulatory information in the human genome. Genome Res 22: 1748–1759 [DOI] [PMC free article] [PubMed] [Google Scholar]
- Schnetz MP, Handoko L, Akhtar-Zaidi B, Bartels CF, Pereira CF, Fisher AG, Adams DJ, Flicek P, Crawford GE, Laframboise T, et al. 2010. CHD7 targets active gene enhancer elements to modulate ES cell-specific gene expression. PLoS Genet 6: e1001023. [DOI] [PMC free article] [PubMed] [Google Scholar]
- Shen Y, Yue F, McCleary DF, Ye Z, Edsall L, Kuan S, Wagner U, Dixon J, Lee L, Lobanenkov VV, et al. 2012. A map of the cis-regulatory sequences in the mouse genome. Nature 488: 116–120 [DOI] [PMC free article] [PubMed] [Google Scholar]
- Spilianakis CG, Flavell RA 2004. Long-range intrachromosomal interactions in the T helper type 2 cytokine locus. Nat Immunol 5: 1017–1027 [DOI] [PubMed] [Google Scholar]
- Stranger BE, Nica AC, Forrest MS, Dimas A, Bird CP, Beazley C, Ingle CE, Dunning M, Flicek P, Koller D, et al. 2007. Population genomics of human gene expression. Nat Genet 39: 1217–1224 [DOI] [PMC free article] [PubMed] [Google Scholar]
- Thurman RE, Rynes E, Humbert R, Vierstra J, Maurano MT, Haugen E, Sheffield NC, Stergachis AB, Wang H, Vernot B, et al. 2012. The accessible chromatin landscape of the human genome. Nature 489: 75–82 [DOI] [PMC free article] [PubMed] [Google Scholar]
- Trapnell C, Pachter L, Salzberg SL 2009. TopHat: Discovering splice junctions with RNA-Seq. Bioinformatics 25: 1105–1111 [DOI] [PMC free article] [PubMed] [Google Scholar]
- Trapnell C, Williams BA, Pertea G, Mortazavi A, Kwan G, van Baren MJ, Salzberg SL, Wold BJ, Pachter L 2010. Transcript assembly and quantification by RNA-Seq reveals unannotated transcripts and isoform switching during cell differentiation. Nat Biotechnol 28: 511–515 [DOI] [PMC free article] [PubMed] [Google Scholar]
- Trynka G, Sandor C, Han B, Xu H, Stranger BE, Liu XS, Raychaudhuri S 2013. Chromatin marks identify critical cell types for fine mapping complex trait variants. Nat Genet 45: 124–130 [DOI] [PMC free article] [PubMed] [Google Scholar]
- Vernimmen D, Marques-Kranc F, Sharpe JA, Sloane-Stanley JA, Wood WG, Wallace HAC, Smith AJH, Higgs DR 2009. Chromosome looping at the human α-globin locus is mediated via the major upstream regulatory element (HS −40). Blood 114: 4253–4260 [DOI] [PubMed] [Google Scholar]
- Visel A, Rubin EM, Pennacchio LA 2009. Genomic views of distant-acting enhancers. Nature 461: 199–205 [DOI] [PMC free article] [PubMed] [Google Scholar]
- Zentner GE, Tesar PJ, Scacheri PC 2011. Epigenetic signatures distinguish multiple classes of enhancers with distinct cellular functions. Genome Res 21: 1273–1283 [DOI] [PMC free article] [PubMed] [Google Scholar]
- Zhang Y, Liu T, Meyer CA, Eeckhoute J, Johnson DS, Bernstein BE, Nusbaum C, Myers RM, Brown M, Li W, et al. 2008. Model-based analysis of ChIP-Seq (MACS). Genome Biol 9: R137. [DOI] [PMC free article] [PubMed] [Google Scholar]
- Zhang X, Cowper-Sal lari R, Bailey SD, Moore JH, Lupien M 2012. Integrative functional genomics identifies an enhancer looping to the SOX9 gene disrupted by the 17q24.3 prostate cancer risk locus. Genome Res 22: 1437–1446 [DOI] [PMC free article] [PubMed] [Google Scholar]