

Abstract
Understanding the consequences of regulatory variation in the human genome remains a major challenge, with important implications for understanding gene regulation and interpreting the many disease-risk variants that fall outside of protein-coding regions. Here, we provide a direct window into the regulatory consequences of genetic variation by sequencing RNA from 922 genotyped individuals. We present a comprehensive description of the distribution of regulatory variation—by the specific expression phenotypes altered, the properties of affected genes, and the genomic characteristics of regulatory variants. We detect variants influencing expression of over ten thousand genes, and through the enhanced resolution offered by RNA-sequencing, for the first time we identify thousands of variants associated with specific phenotypes including splicing and allelic expression. Evaluating the effects of both long-range intra-chromosomal and trans (cross-chromosomal) regulation, we observe modularity in the regulatory network, with three-dimensional chromosomal configuration playing a particular role in regulatory modules within each chromosome. We also observe a significant depletion of regulatory variants affecting central and critical genes, along with a trend of reduced effect sizes as variant frequency increases, providing evidence that purifying selection and buffering have limited the deleterious impact of regulatory variation on the cell. Further, generalizing beyond observed variants, we have analyzed the genomic properties of variants associated with expression and splicing and developed a Bayesian model to predict regulatory consequences of genetic variants, applicable to the interpretation of individual genomes and disease studies. Together, these results represent a critical step toward characterizing the complete landscape of human regulatory variation.
Unraveling the genetics of human gene expression and describing the landscape of genetic variants affecting the transcriptome will reveal important insights into the architecture and control of the human regulatory network and allow us to more fully characterize the noncoding, regulatory regions of the genome. Population-level studies of gene expression combined with genotyping allow us to directly evaluate the association of genetic variation with expression (Goring et al. 2007; Stranger et al. 2007), revealing expression quantitative trait loci (eQTLs) in a variety of populations, tissues, and contexts (Dimas et al. 2009; Grundberg et al. 2012; Stranger et al. 2012; Liang et al. 2013). Many genetic variants shown to have impact on expression also affect higher-level traits including disease risk (Emilsson et al. 2008; Nica et al. 2010; Fairfax et al. 2012), and through investigation of expression as a cellular phenotype, we can provide a more mechanistic interpretation of individual functional variants. Further, with the advent of RNA-sequencing technology, we are now able to assay the complete transcriptome, providing access to a wider range of expression traits, including distinct isoforms and allelic expression (Mortazavi et al. 2008; Wang et al. 2008; Trapnell et al. 2010). Initial studies in cohorts of 60–70 individuals have combined RNA-sequencing and genetic information to identify variants with impact on this broad range of transcriptional phenotypes (Montgomery et al. 2010; Pickrell et al. 2010) but were limited in power and sequencing depth to fully describe the impact at the regulatory network and genome levels.
Here, we leverage the resolution offered by RNA-sequencing in a large population study utilizing a primary human tissue. We have sequenced RNA from whole blood of 922 genotyped individuals from the Depression Genes and Networks cohort (Methods), all of European ancestry. Here, we describe the impact of local and distal regulatory genetic variation on diverse expression traits, characterizing the distribution of QTLs according to the specific expression phenotypes altered, the properties of affected genes, and the genomic characteristics of regulatory variants.
We find evidence for the widespread impact of genetic variation on transcriptional phenotypes of more than 10,000 genes, including variants affecting total gene expression, alternative splicing, and allelic expression. We specifically increase the number of known splicing QTLs by nearly an order of magnitude. By evaluating distal, genome-wide regulatory impact of each genetic variant, we highlight a pattern of modularity, or coregulation of many genes by a smaller number of individual genetic variants, and intra-chromosomal modules specifically influenced by the complex three-dimensional configuration of each chromosome in the nucleus. Further, by analyzing the genes affected by regulatory variants, we find evidence consistent with the effects of selection and buffering to limit the downstream, potentially harmful consequences of regulatory variation. Specifically, important genes, including hubs in protein–protein interaction networks, transcription factors, and highly conserved genes are each depleted for cis-eQTLs. Finally, utilizing the sizeable set of detected regulatory variants, we characterize the genomic properties of variants affecting both total expression levels and gene splicing, and present a Bayesian framework, the latent regulatory variant model (LRVM), that combines these diverse properties into a unified model to predict the consequences of genetic variation. This framework offers a method for automatically evaluating the potential regulatory impact of genetic variants observed in future studies.
Results
The Depression Genes and Networks cohort is comprised of individuals of European ancestry within the United States. RNA was extracted from whole blood and, following globin RNA reduction (GLOBINclear kit [Invitrogen]), sequenced in an Illumina HiSeq 2000, yielding approximately 70 million 51-bp single-ended reads per individual. After quality control, 922 individuals remained for analysis in this study (Supplemental Figs. S2–S4). Each individual was also genotyped for 720,591 autosomal single nucleotide polymorphisms (SNPs) on the Illumina HumanOmni1-Quad BeadChip (Supplemental Fig. S1). For details of sample collection and data processing, see Methods and Supplemental Material.
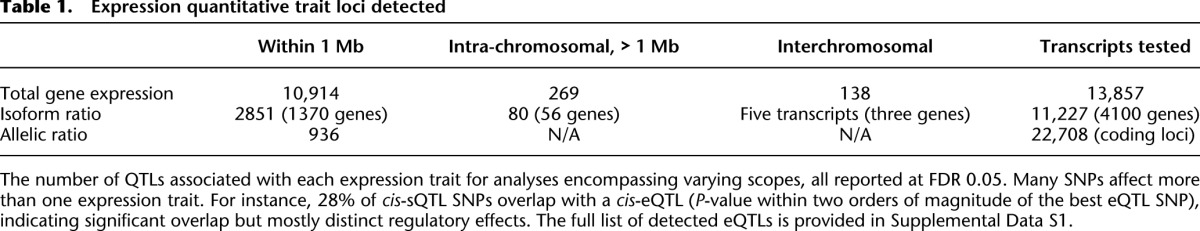
From these data, we identify expression quantitative trait loci (eQTLs) affecting the large majority (78.8% at FDR 0.05) of genes with quantifiable expression (Table 1; Supplemental Data S1; Methods). Notably, despite evaluating expression in a single tissue, 680 known trait- and disease-associated variants of 1445 tested (see Methods; Hindorff et al. 2009), are associated with expression phenotypes in this study, including 159 loci specifically associated with gene splicing (Supplemental Tables S2, S3). In each class of QTL, particularly among trans associations and disease variants, the large sample size was essential to identifying the full range of regulatory effects (Supplemental Fig. S10).
Table 1.
Expression quantitative trait loci detected
Prevalence and impact of proximal regulatory variation
We find broad impact from proximal regulatory variation across the genome, including cis-regulatory variants associated with total gene expression for 10,914 of 13,857 autosomal genes evaluated (SNPs within 1 Mb of the transcription start site; FDR 0.05). Further, although common genetic variants explain a small portion of total expression variation in each gene, their effect is greater than that of significant demographic factors, with cis-eQTLs explaining a median of 3.3% of expression variance (median 7.7% among genes with an eQTL), compared to 0.7% explained by age and sex combined (Supplemental Fig. S12; Supplemental Table S3). We do not detect substantial modulation of cis-eQTLs by sex or age, but considering strong correlation between demographic variables and other covariates including medication and depression status in this cohort, these effects warrant further investigation. We observe high replication between our reported cis-eQTLs and large microarray studies (Supplemental Material; Fehrmann et al. 2011; Grundberg et al. 2012) (ranging from 51% to 89% replication rate), although we do identify additional eQTLs with weaker association strength and among lower-expressed genes (Supplemental Fig. S11), suggesting that statistical power along with the resolution of RNA-seq is a contributor to finding eQTLs unique to this study. Genetic variants near each gene also affect alternative splicing; using isoform ratio (the fraction of a gene's expression arising from each isoform) (Methods) as a quantitative trait, we identify 2851 transcripts from 1370 unique genes with splicing QTLs (sQTLs) at FDR 0.05. Although our results agree with previous studies indicating less variation in gene splicing than in total expression (Gonzalez-Porta et al. 2012), we increase the number of splicing variants by nearly an order of magnitude beyond previous studies, which identified up to 380 genes affected by genetic variation at FDR 0.05 (Kwan et al. 2008; Fraser and Xie 2009; Pickrell et al. 2010). Again, genotype explains much more variance in isoform ratio than do age and sex—although most isoforms have no significant association, twice as many isoforms have a genetic association than have a demographic one (Supplemental Fig. S12). Furthermore, as hundreds of disease-associated loci are found among the identified proximal regulatory variants, this increased compendium of splicing effects offers new potential to elucidate functional mechanisms. In our analysis, for instance, rs3865444, a SNP associated with Alzheimer's disease (Hindorff et al. 2009; Naj et al. 2011), has a strong association with the isoform ratio of CD33 (P < 10−200), far stronger than its association with total expression (P < 10−20), suggesting a specific regulatory mechanism not previously considered for this variant.
Allele-specific expression (ASE) provides a more detailed evaluation of the distribution of cis effects—individuals who are heterozygous for a cis-regulatory variant will demonstrate allelic imbalance in which one homologous copy of a gene is more highly expressed than the other copy (Yan et al. 2002; Pastinen and Hudson 2004). Here, from ASE evaluated both per individual and across the cohort, we identify shared genetic drivers of allelic imbalance, and additionally estimate the relative frequency of common and rare cis regulatory effects. First, in a novel analysis, we identify a set of regulatory variants that are consistently associated with allelic imbalance in nearby genes across our cohort, where previous studies either identify only instances of ASE per individual without identifying the associated regulatory variants, or require specialized assays measuring allelic expression (Serre et al. 2008; Ge et al. 2009). RNA-sequencing enables direct quantification of ASE (Verlaan et al. 2009; Zhang et al. 2009; Montgomery et al. 2010; Pickrell et al. 2010), and leveraging the number of heterozygous individuals available here, we treat ASE as a quantitative trait itself and are able to identify specific genetic drivers of allelic expression. We evaluate aseQTLs by testing for statistically significant associations between heterozygous status at individual regulatory variants and allelic imbalance at nearby expressed coding loci, tested exclusively among heterozygous individuals at each coding locus (Fig. 1A,B; Methods). The resulting aseQTL associations provide strong evidence of cis-regulatory impact and are less likely than standard cis-eQTLs to arise from non-cis mechanisms, artifacts, or linkage of a noncausal SNP with a rare variant. As expected, analysis of aseQTLs demonstrates an enrichment of allele-specific effects among cis-eQTLs (Supplemental Figs. S13–S15). Although the power to detect aseQTLs in this study is still constrained by the availability of heterozygous individuals and read depth (Supplemental Fig. S16), we are able to directly confirm that 641 of our cis-eQTL SNPs are also associated with changes in allele-specific expression in the corresponding gene at FDR 0.05, providing a sizeable catalog of high-confidence cis-acting variants. This analysis also indicates a moderately high replication rate (50%–70%) (Supplemental Fig. S16c) among cis-eQTLs with sufficient power (at least 200 heterozygous individuals for varying read depths). Further, 936 exonic loci (in 528 genes) have globally significant aseQTL associations. The strongest aseQTL association is found between heterozygosity at rs4950928 and allelic imbalance within CHI3L1 (P < 10−71) (Fig. 1B). Previous studies have demonstrated associations for rs4950928 with asthma and serum levels of CHI3L1 (Ober et al. 2008), which the aseQTL result supplements with strong evidence for a direct cis-acting regulatory effect of this disease variant.
Figure 1.

Cis-regulatory variation and allelic effects. (A) Schematic illustration of aseQTL. Heterozygosity at a regulatory locus is linked to allelic imbalance detected from RNA-seq reads over a separate heterozygous coding SNP (a second, separate locus) in the corresponding gene. Conversely, individuals who are homozygous at the regulatory SNP will show balanced allelic expression at the coding SNP (still estimated among individuals who are heterozygous at the coding SNP). (B) Example of aseQTL, the most significant association in this analysis. Rs4950928, a known asthma risk variant SNP in the 5′ UTR of CHI3L1, is associated with allelic imbalance in the coding region of CHI3L1, with heterozygous individuals showing significantly increased allelic imbalance compared to individuals homozygous for either the reference or nonreference allele (P < 10−71) (Methods). (C) Distribution of significant ASE by individual. In each individual, we evaluate the fraction of testable heterozygous loci (requiring sufficient read depth and other filters) (see Supplemental Material) with significant ASE (binomial P ≤ 10−3). To evaluate the distribution of ASE not explained by heterozygosity for a common regulatory variant, we then evaluate the same set of testable loci, but only counting ASE when the individual is not heterozygous for a corresponding eQTL SNP. In this case, we consider SNPs that are significant at P ≤ 10−3 for the corresponding eQTL gene.
In addition to evaluating genetic drivers of allelic expression shared across many individuals in the cohort, we also evaluate significant ASE events in each individual (Supplemental Material) in order to assess the distribution of both common and rare regulatory effects. We find that most instances of ASE in each individual can potentially be explained by a common regulatory variant, specifically an eQTL SNP identified in the population (Fig. 1C), with 73.8% of individual ASE events co-occurring with heterozygous status for the single best cis-eQTL SNP of the same gene. However, there are many cases of ASE (21%) not co-occurring with any explanatory eQTL SNP, and such instances are candidates for rare regulatory variation in that individual. Although ASE could arise from nongenetic factors such as allele-specific methylation or imprinting, previous studies suggest genetic variation is the primary cause of ASE (Zhang et al. 2009). Overall, analysis of allelic expression provides direct evidence of cis mechanism for a large set of variants (aseQTLs) and additionally allows us to compare the distributions of common regulatory variation with other regulatory factors that would include rare genetic variation, with evidence here suggesting that common genetic variants are responsible for more transcriptional variation.
Distant variants and modular regulation
In order to address the impact of genetic variation on the full transcriptional network, we also evaluate distal regulatory relationships, both within and across chromosomes. First, the impact of genetic variation even through cis-mechanisms is not limited to a small range as measured by genomic distance. Enhancers are known to act over distances up to several Mb away (Nobrega et al. 2003; Kleinjan and van Heyningen 2005), and 3D configuration of chromosomes within the nucleus can alter the true spatial proximity of regulatory sequences with potential target genes (Spilianakis and Flavell 2004; Lieberman-Aiden et al. 2009; Cheung et al. 2010). We performed a separate, stepwise association analysis to identify all regulatory variation influencing genes within each chromosome (Methods), allowing multiple independent eQTLs per gene. Consideration of this expanded set of SNPs for each gene sacrifices some statistical power (we would identify 8580 eQTL genes at FDR 0.05), but we identify 381 genes affected by SNPs >500 kb away from the transcription start site (TSS), including 269 genes affected by SNPs >1 Mb away (Table 1). An analysis of allelic effects provides evidence that many variants well outside the standard promoter region still act through cis-mechanisms (Fig. 2A), though others could arise from indirect trans events such as a colocation of a cis-regulated transcription factor with a number of its target genes on the same chromosome.
Figure 2.

Distant and modular intra-chromosomal regulation. (A) Q-Q plot of aseQTL P-values for intra-chromosomal eQTLs of varying distances. For eQTLs implicating SNPs beyond each distance threshold from the corresponding TSS (0 kb, 20 kb, 100 kb, 300 Kb, 500 kb), we computed aseQTL association tests between the eQTL SNP and allelic ratios at all exonic loci available for the corresponding gene, taking the best association identified from these. The expected P-value distribution and 95% CIs were computed empirically from repeated random draws of SNPs similarly tested against exonic loci within each eQTL gene. We observe that distant eQTLs show more ASE than expected by chance, although the enrichment declines with distance. (B) Schematic of a genomic region on chromosome 16 containing coregulated genes, along with nearby genes and SNPs having an impact on each gene. Rs11644386 affects a discontinuous group of genes, with the farthest association (CYLD) being >400 kb away, and does not have significant associations with two intermediate genes SNX20 and NOD2. Another SNP, rs8047222, is associated with expression of NKD1 and a nearby gene NOD2, but has no influence on the more distant genes BRD7 and ADCY7.
The chromosome-wide analysis reveals a pattern of modules of coregulated genes, with 803 eQTL variants affecting two or more genes and 106 variants affecting three or more. Coexpression of nearby genes has been reported for several organisms (Lercher et al. 2002; Oliver and Misteli 2005), and our analysis specifically detects genetic variation that affects modular coregulation, and thus points to genomic regions with regulatory impact on groups of genes. Indeed, the coregulated genes here are coexpressed in excess of other proximal gene pairs (P < 10−87) and share direction of the eQTL effect (Supplemental Fig. S17). These results provide a much larger number of genetically coregulated genes than previously known, but indicate a similar rate of shared regulation, with 11% of eQTL genes compared to 8% reported previously (Stranger et al. 2012). On the other hand, among the 1556 genes in any of these modules, nearly half (769) also have a gene-specific (targeted) regulatory variant. An example of both coordinated and targeted regulation affecting five colocated genes (ADCY7, BRD7, NKD1, NOD2, and CYLD) is shown in Figure 2B and Supplemental Figure S18. Such clusters tend to occur in gene-dense spatially colocated regions of each chromosome (P < 10−47) (Supplemental Material). Beyond linear proximity among coregulated genes, three-dimensional chromosomal configuration influences regulatory modules. Specifically, falling within the same topological domain derived from Hi-C chromatin interaction frequencies (Dixon et al. 2012) is predictive of coregulation by the same variant (log-odds >0.75) (Supplemental Fig. S19; Supplemental Material). Together these results indicate that coordinated regulation of three-dimensionally colocated genes is common, particularly in gene-rich regions, but even genes with shared eQTLs are also often under the control of specific, targeted regulatory elements.
Furthermore, analyses of regulatory variants that affect expression across chromosomes (trans-eQTLs) allow us to more fully characterize the structure of the regulatory networks that govern expression traits genome-wide. After applying stringent filters to account for spurious associations arising among regions of sequence similarity (Methods; Supplemental Material; Supplemental Fig. S20), we identify a set of 138 genes whose expression is associated with a distant SNP and, interestingly, five trans-QTLs affecting isoform ratios rather than total expression for three genes. The proportion of trans splicing QTLs (compared to both proximal and distant sQTLs) is lower than that of expression QTLs, suggesting that splicing is disproportionately affected through cis mechanisms. As with the intra-chromosomal associations, we observe modularity among the trans associations, with 20% of associated SNPs affecting two or more genes, helping to identify genomic regions that coordinate the regulation of multiple genes (Emilsson et al. 2008; Gilad et al. 2008; Fehrmann et al. 2011). The largest module is a set of 57 genes, enriched for platelet aggregation function (P < 10−7), all affected by the SNP rs1354034, previously associated with mean platelet volume (Fehrmann et al. 2011; Gieger et al. 2011). Additionally, the majority of trans-eQTLs SNPs (76 of 138) also have cis-regulatory effects, affecting proximal gene expression levels (74 of 76) or isoform ratio (31 of 76; a higher fraction than expected from the global prevalence of sQTLs; P < 0.05) (Supplemental Fig. S21). One example, rs10251980, is a cis-eQTL for IKZF1, whose loss of function has been linked to prognosis in leukemia (Mullighan et al. 2009). The SNP affects eight distant genes, five of which are up-regulated in response to tretinoin treatment in leukemia (Fig. 3A; Martens et al. 2010). As another example, rs2759386 is associated with isoform ratios of the distant gene FYB (Fig. 3C). Interestingly, this effect is mediated through a cis-association with a known splicing factor, QKI, and the distribution of P-values for rs2759386 for trans-splicing effects across the genome is skewed toward smaller values, suggesting this variant may have effects on splicing of more genes than detectable at global significance levels (Supplemental Fig. S22).
Figure 3.

Trans-regulatory variation and mediation through proximal genes. (A) Example subnetwork of significant associations centered on expression of IKZF1. The SNP rs10251980 is associated with expression of the nearby gene IKZF1 (P < 10−8), along with eight distant genes (P < 10−12). IZKF1 is also coexpressed with six of the eight genes (P < 0.05). (B) Prevalence of candidate regulatory network structures for trans-eQTLs including the SNP, the corresponding distant genes, and any genes proximal to the SNP that are also associated with its genotype. For each trans-eQTL gene, we analyzed its relationship with the most strongly associated SNP, along with all genes within 1 Mb of that SNP. Network structures best fitting each set were identified using likelihood ratio tests (Methods; Supplemental Material). (C) Association between rs2759386 and isoform ratio of FYB, potentially mediated through expression of splicing factor QKI, which is proximal to the SNP. Rs2759386 is associated with total expression levels of QKI, and both this SNP and QKI are associated with isoform ratio of FYB (P < 10−14 and P < 10−16, respectively).
To better understand the causal relationships of trans-associated loci (Schadt et al. 2005), we estimate maximum likelihood Bayesian network structure for each trans SNP along with its proximal and distal associated genes (Fig. 3B; Supplemental Material). The results indicate that the expression level of nearby genes mediate the trans effect 85% of the time, although there is evidence of some residual association in most cases. The remaining 15% of the time, there is little to no explanatory power from expression of nearby genes; further, in three cases, we observe a paradoxical relationship with the SNP having opposite effects on expression levels of different targets not consistent with correlation among the targets (Supplemental Fig. S23). These seemingly paradoxical effects and evidence of incomplete mediation may reflect temporal dynamics, feedback, and nontranscriptional factors such as protein functionality. Overall, these results support a general pattern of modular trans-effects mediated by regulatory roles of nearby genes, but a complex architecture for the human regulatory network.
Limitations on deleterious impact from regulatory variation
Assessing the distribution of eQTLs according to the properties of affected genes, we find evidence supporting mechanisms that limit the deleterious impact of regulatory genetic variation on the cell. First, we observe an inverse relationship between allele frequency and the regulatory impact of each SNP, using a subsampling approach to avoid bias in estimates of effect size (Methods). Specifically, cis-eQTL effect sizes are significantly smaller for polymorphisms with higher minor allele frequencies (P < 10−7) (Fig. 4A), supported by a similar inverse relationship observed between MAF and allelic imbalance among heterozygotes for these polymorphisms (P < 0.02). This suggests that purifying selective pressure, even among common variants, acts against variation with large effects on transcription, supporting patterns previously reported among disease and functionally annotated genetic variants (Bodmer and Bonilla 2008; Zhu et al. 2011).
Figure 4.

Distribution of cis-regulatory variation and selective pressure. (A) Effect size of cis-eQTLs compared to minor allele frequency of the most significant SNP per eQTL gene (computed using subsampling) (Methods). We find a strong inverse relationship (Spearman's r = −0.13, P < 10−7). If we normalize by the observed variance of each gene, the observed relationship becomes stronger (P < 10−39). (B) A depletion of cis-eQTLs is evident (P < 0.05) among genes with many protein–protein interactions (PPI); additionally, a strong negative correlation exists between the number of interactions and eQTL effect size (P < 10−35). Protein coding genes were put into quantile buckets according to the number of known PPI relationships (Methods). The fraction of genes in each bucket having a significant cis-eQTL was computed along with the average effect size for the observed eQTLs. Fewer eQTLs are observed among genes with the most interactions (hub genes). Genes in the bottom 20% may be moderately depleted as well, although confidence intervals (95%) are overlapping with the intermediate deciles. (C) The fraction of genes with a significant cis-eQTL and average eQTL effect size are shown according to an estimate of the genes' regulatory impact. Known regulatory genes were put into quantiles according to the strength of correlation observed between their expression profile and the expression of all nonregulatory genes. Nonregulatory genes are shown in the leftmost bar for comparison. Strong regulatory genes show significant depletion of eQTLs (P < 10−2) compared to nonregulators and weak regulatory genes and, similarly, reduced eQTL effect sizes (P < 10−100).
Further, there is a depletion of cis-eQTLs among genes with annotations suggesting critical roles in cellular functioning. Previous evidence supports selective pressure on network hubs (Fraser et al. 2002; Jordan et al. 2004; Gerstein et al. 2012), and here, we directly demonstrate depletion of regulatory variants among several classes of important genes. In particular, highly conserved genes (those shared with distant species including yeast and zebrafish) and hubs in human protein–protein interaction networks (Methods) are less likely to be influenced by a detectable cis-eQTL. Furthermore, effect sizes among detected cis-eQTLs are negatively correlated with the number of known protein–protein interactions for the corresponding genes (P < 10−35) (Fig. 4B). Known transcription factors (TFs) are also depleted for cis-eQTLs; even within TFs, stronger coexpression with target genes implies both a decreased likelihood of detecting a cis-eQTL for the TF itself (P < 10−2) and reduced effect sizes among the eQTLs that we do observe (P < 10−100) (Fig. 4C; Supplemental Fig. S26). This result provides some explanation for the scarcity of trans-eQTLs observed in this and other studies (Fehrmann et al. 2011; Fairfax et al. 2012)—in exactly the cases in which a cis-acting variant affecting one gene could indirectly drive changes in expression of other genes downstream in the regulatory network, there is a depletion of cis-eQTLs. These results together suggest that genes whose expression levels have the potential for broad impact on the cell are subject to tighter control on their own expression. Potential limiting mechanisms include selective pressure constraining the frequency of deleterious regulatory variants, compensatory buffering mechanisms, and auto-regulatory feedback.
Genomic properties and prediction of regulatory variants
The large collection of QTLs from this study affords the opportunity to generalize beyond specific variants identified to their genomic properties, in order to better understand regulatory mechanisms and provide a basis from which to evaluate the regulatory potential of untested variants. First, by combining the catalog of expression and splicing QTLs with detailed annotations from The ENCODE Project Consortium and others, we explore candidate mechanisms through which genetic variation may perturb regulatory elements and finally expression (Gaffney et al. 2012; The ENCODE Project Consortium 2012; Schaub et al. 2012). Beyond the expected enrichment of both sQTLs and eQTLs near the TSS (Stranger et al. 2012; Veyrieras et al. 2012), sQTLs are concentrated among exonic and intronic loci, with less bias toward the 5′ end of the gene than observed for eQTLs (Fig. 5A). Further, splice site, essential splice site, and stop gained functional annotations are particularly enriched for sQTLs, beyond the effects of position (Fig. 5B; Supplemental Fig. S27) relative to the gene (Methods).
Figure 5.

Genomic properties of regulatory variation and prediction of eQTLs. (A) Enrichment of proximal eQTLs and sQTLs is shown as a function of distance to the TSS. Enrichment is computed here as the log odds multiplier on likelihood of association (Methods). In the zoomed, intrageneic view, enrichment (log odds multiplier) of proximal eQTLs and sQTLs is shown within gene boundaries for UTR, intronic, and exonic loci. We aggregate SNPs within all exons except the first (the closest to TSS) together, and likewise for introns. (B) Enrichment of cis-eQTLs and sQTLs for functional and genomic annotations, controlling for distance. In each case, (log) odds multipliers were computed for each category after conditioning on SNP location (Methods) shown in A and B. ChIP-seq and DNase I annotation enrichments are shown here for SNPs falling within 20 kb upstream of TSS; for full enrichment statistics see Supplemental Data S2. (C) Enrichment of cis-eQTLs stratified by LRVM score (restricting to genes and SNPs excluded from training LRVM). Each SNP-gene pair was scored by LRVM for likelihood of association, and twenty quantiles were computed for the resulting scores. Finally, enrichment was computed for each quantile, using log odds estimation after correcting for position (Methods). (D) Predicted regulatory impact of trait-associated (GWAS) SNPs according to LRVM for 263 unique disease variants not available during LRVM training. We compute the score of each SNP for each of its proximal genes. Known trait-associated SNPs score more highly that expected at random (P < 10−9), indicating enrichment for properties that match those of observed regulatory variants. (E) LRVM scores are predictive of allelic effects, indicative of cis-regulatory impact. We correlate allelic imbalance (Methods) observed among heterozygous individuals for each SNP with the score assigned by each predictive model to the corresponding SNP. Significance is estimated using the Wilcoxon rank sum test. Again, analysis is restricted to SNPs not used to train LRVM.
After controlling for SNP proximity and intragenic location, we observe strong enrichment of both eQTLs and sQTLs for many regulatory annotations derived from The ENCODE Project Consortium, including TF binding sites from ChIP-seq, RNA binding elements from RIP-seq and tiling arrays, and regions of open chromatin identified by DNase I hypersensitivity assays (Fig. 5B; Methods; Supplemental Data S2). Although enrichment statistics are not conclusive regarding causality, these observations suggest that variants affecting splicing may act not only through direct perturbation of splice sites and coding loci as has been previously described (Pickrell et al. 2010), but also through TF binding and mechanisms shared with regulation of expression. This could arise from transcription factors playing a role in the cellular pathways that regulate expression of particular isoforms under different conditions, including direct influence on mechanisms such as cotranscriptional splicing. The enrichment of most regulatory elements is strongest among variants close to the TSS and declines in significance with distance for both eQTLs and sQTLs (Supplemental Fig. S27; Supplemental Data S2), but a small number of transcription factors are enriched for eQTLs at distant locations beyond 100 kb, including MEF2A (log odds multiplier 0.25). These findings support the hypothesis that a large fraction of regulatory variants affect expression through alteration of transcription factor (TF) binding and chromatin accessibility (Degner et al. 2012), improving the resolution of previous findings and extending these observations to variants associated with gene splicing.
Additionally, we utilize these patterns to develop a predictive model of regulatory variation. With advances in sequencing technology, population and disease studies increasingly identify genetic variants not previously evaluated. Many genetic studies will not include high-resolution expression data or include enough instances of a given allele to accurately evaluate impact on the transcriptome. Thus, it would be valuable to predict the impact of noncoding and intergenic variants without requiring direct association testing (Lee et al. 2009; Cooper and Shendure 2011; Gaffney et al. 2012). Our observed associations provide a large set of eQTLs and sQTLs to support the training of predictive models to detect regulatory variation. Our approach unifies the full set of informative annotations analyzed for enrichment into a single framework, the latent regulatory variant model (LRVM; software available at http://dags.stanford.edu/dgn/). LRVM models the likelihood of observing a QTL association based on diverse genomic annotations, using a Bayesian latent variable approach to account for the confounding influences of minor allele frequency and linkage disequilibrium on eQTL association (Methods; Supplemental Material). In particular, LRVM first models the latent regulatory potential of each individual SNP based on genomic annotations, and separately, the likelihood of observing a QTL association given MAF and LD with surrounding SNPs.
Here, we trained two instances of LRVM, using the described framework but training the parameters separately to predict the effects on total expression and, in the second instance, gene splicing. In both cases, using held-out genes and SNPs not used in training, we find that LRVM stratifies candidate regulatory SNPs more accurately than any single genomic annotation and more accurately than comparable methods that ignore the effects of LD and MAF (Fig. 5C; Supplemental Figs. S28, S29). The SNPs identified by LRVM as having a high likelihood of regulatory impact are also more likely to be associated with downstream allelic imbalance (P < 10−12) (Fig. 5E), with this stringent test demonstrating that variants identified by LRVM are likely to have true cis-regulatory impact. To demonstrate the application of LRVM to interpretation of disease studies, we also predicted the regulatory impact of all known GWAS variants not used in training the model, and interestingly, observe that these variants have an increased probability of regulatory impact (Fig. 5D; Supplemental Fig. S30), indicating that many disease SNPs have genomic properties consistent with regulatory function. For example, the top-scoring disease SNP is rs2932538, a known cardiovascular risk variant (Ehret et al. 2011) that lies near the TSS of MOV10 and is annotated with multiple TF binding and DNase hypersensitivity sites, strongly supporting its regulatory potential.
Discussion
Sequencing RNA from primary tissue of nearly one thousand individuals, we identified regulatory variation underlying diverse expression phenotypes of more than 10,000 genes across the genome. These results emphasize the pervasive impact of proximal genetic variation on gene expression, and specifically demonstrate a much larger role for genetic variation in gene splicing than previously observed through smaller RNA-sequencing studies (Montgomery et al. 2010; Pickrell et al. 2010) or specialized assays (Kwan et al. 2008). We also identified a number of distal regulatory relationships, including a number of distant QTLs affecting the isoform ratio within each chromosome (which may still act in cis), but proportionally far fewer sQTLs between chromosomes. Distant intra-chromosomal and trans-eQTLs both include many variants individually acting on groups of multiple genes, supporting observations of modularity in several organisms (Lercher et al. 2002; Oliver and Misteli 2005). We demonstrated that membership of genes in coregulated modules is predicted, not only by linear proximity, but also by proximity due to three-dimensional chromosomal configuration, extending beyond specific examples of spatial proximity affecting gene regulation (Spilianakis and Flavell 2004; Lieberman-Aiden et al. 2009; Cheung et al. 2010) to suggest a broad, genome-wide pattern.
Furthermore, by analyzing the distribution of eQTLs across the genome, we have detected a depletion of regulatory variants among genes with increased potential for deleterious impact on the cell, including highly conserved genes and genes central to cellular networks. This analysis complements studies identifying evidence of purifying selection in both functionally annotated regulatory and protein-coding elements (Fraser et al. 2002; Jordan et al. 2004; Bodmer and Bonilla 2008; Zhu et al. 2011; Gerstein et al. 2012), directly demonstrating a pattern of reduced impact from regulatory variation for important genes and common variants. Finally, we combined our large set of eQTL with diverse genomic annotations, including location, functional annotations, and regulatory elements. We presented a Bayesian model, LRVM, capable of predicting regulatory impact from the properties of each SNP, combining all available genomic annotations into a unified model. LRVM improves our ability to predict the effects of genetic variation on both expression and splicing, and provides a framework to automatically identify SNPs likely to have regulatory impact even for variants not previously observed, which could contribute to the interpretation of rare variants and personal genomes.
Overall, the extensive set of eQTLs identified here has provided a more complete characterization of the landscape of human regulatory variation than previously possible. As we seek to describe the impact of both common and rare genetic variation, the combined understanding gained from ongoing genomic annotation efforts, eQTL studies, and statistical methods will contribute to our interpretation of the genetics of gene expression and potential mechanisms of effect on higher-level traits.
Methods
Sample collection
The recruitment procedure of the Depression Genes and Networks study (National Institute of Mental Health Grant 5RC2MH089916) was designed to collect samples of individuals with and without major depressive disorder, ages 21–60, from a survey research panel that was broadly representative of the United States population (Supplemental Material). Whole blood was collected in two PAXGene tubes (for RNA) and two acid-citrate-dextrose tubes (for DNA).
Genotyping
DNA was extracted and genotyped on the Illumina HumanOmni1-Quad BeadChip. Quality control was performed to identify samples with elevated heterozygosity, unexpected ancestry or pairwise IBD, and potential mislabeling (Supplemental Material; Supplemental Fig. S1).
RNA-sequencing and quality control
RNA was extracted from thawed PAXGene tubes, and the GLOBINclear Kit (Invitrogen) was applied. Sequencing libraries were prepared (without fragment size selection) according to the Illumina TruSeq protocol. Oligonucleotide barcodes were attached to all fragments of each library, and three libraries at a time were pooled and sequenced in one lane in an Illumina HiSeq 2000 (50-bp single-ended reads). FASTQ (Cock et al. 2010), Picard (http://picard.sourceforge.net/), and in-house metrics were used to evaluate data quality (Supplemental Material; Supplemental Figs. S2–S4).
Expression quantification
RNA-seq reads were mapped to the NCBI v37 H. sapiens reference genome using TopHat (Trapnell et al. 2009). HTSeq was used to quantify gene expression (http://www-huber.embl.de/users/anders/HTSeq/doc/overview.html), BEDTools (Quinlan and Hall 2010) was used to quantify exon expression, and Cufflinks (Roberts et al. 2011) was used to quantify isoform expression. Only uniquely aligned reads were used for gene and exon quantification. We consider a gene expressed if it has at least 10 reads in 100 individuals. Isoform ratio, representing the fraction of a gene's expression arising from a particular transcript, was computed for each transcript from Cufflinks output. In particular, given a gene with k transcripts, let eji represent the expression level of transcript i in individual j. The isoform ratio for the ith transcript of this gene in individual j is given by
 |
Allele-specific expression calls were made using a binomial model after filtering for potential mapping bias (Supplemental Material).
Correcting for potential confounders in RNA-seq data
We used the hidden covariates with prior (HCP) method (Mostafavi et al. 2013) to correct for technical and biological factors, including blood cell-type frequencies and the time of the blood draw (see Supplemental Table S1). We computationally inferred cell-type frequencies using an existing compendium of blood cell-type-specific signatures (Supplemental Material). HCP parameters were tuned separately for cis- and trans-eQTL analysis (Supplemental Material; Supplemental Figs. S7, S8).
Expression QTL mapping
Association testing for cis, splicing, and trans-eQTLs was performed using Spearman's rank correlation, only including autosomal SNPs with MAF ≥ 0.025. For cis-eQTLs and sQTLs, testing was limited to SNPs within 1 Mb of the transcription start site. We used Bonferroni correction to account for the number of SNPs tested per gene (Supplemental Fig. S9) and subsequently identified eQTLs using gene level significance at FDR 0.05. We identified intra-chromosomal eQTLs using stepwise regression (on ranked data for consistency with Spearman's rank correlation). For aseQTL associations, we used a Wilcoxon rank sum statistic indicating whether imbalance of the allelic ratio at the coding locus is significantly higher for individuals heterozygous at the candidate regulatory locus compared to homozygous individuals (all tested individuals are heterozygous at the coding locus). We defined allelic imbalance as  , where r and a are the number of reads mapped to the reference and alternative alleles, respectively. We require 10 individuals heterozygous at both the coding and candidate regulatory loci.
eQTL and ASE effect size
We estimated eQTL and ASE effect sizes by computing fold change, using a subsampling approach to avoid biases from allele frequency, matching across all tests the number of individuals with each allele analyzed and, in the case of ASE, read depth (Supplemental Material).
Data sources for analysis of eQTL distribution
We constructed a combined protein–protein interaction network by taking the union of interactions reported in (1) BioGRID (Breitkreutz et al. 2003) (both small scale and high-throughput); (2) MINT (Chatr-aryamontri et al. 2007); (3) HPRD (Goel et al. 2012); and (4) IntAct (Aranda et al. 2010) (all data obtained from the GeneMANIA [Warde-Farley et al. 2010] data repository [download on 01/4/2012]). Transcription factor (TF) target information was downloaded from the ChEA database (Lachmann et al. 2010). Conserved genes were obtained for each species from BioMart (Haider et al. 2009). All analyses were restricted to protein coding genes. We obtained trait and disease associated SNPs (GWAS hits) (Hindorff et al. 2009) (downloaded from NHGRI on 01/26/2011), and only considered SNPs with an association of P ≤ 10−7.
Trans-eQTL detection and filtering
To account for spurious trans-associations that stem from regions of sequence similarity and potential mapping errors, we devised a series of filters and applied them to the candidate trans-eQTLs. These filters exclude associations that involve pseudogenes (Karro et al. 2007), associations within paralog families (Vilella et al. 2009), associations between regions of high sequence similarity based on read mapping simulation, and associations that fail a “smoothness” test which evaluates the association signal across the expressed exons of a gene (Supplemental Material; Supplemental Fig. S20).
Analysis of enrichment of QTLs in genomic annotations
We collected genomic annotations from RegulomeDB (Boyle et al. 2012), collected RNA-binding data from ENCODE (The ENCODE Project Consortium 2012) (both the RIP-seq and tiling array data were used), and positional annotations from the Ensembl variant effect predictor (McLaren et al. 2010). To accurately estimate the effects of each genomic annotation on the likelihood of a SNP having regulatory impact, we first account for the location of each SNP. We categorized SNPs within the gene boundaries as exonic, intronic, or UTR, with separate categorization for the first exon and intron. Then, SNPs not within the corresponding gene boundaries are categorized into upstream and downstream regions of size 1 kb (for loci within 10 kb of the TSS), and 10 kb (regions beyond 10 kb). For each positional category, we compute the odds multiplier on observing an association using logistic regression. Fixing these parameters, we then compute the adjusted odds for each SNP based on position and find the conditional odds multiplier for each genomic annotation beyond the effects of location. We consider regions within 20 kb, 20–100 kb, and >100 kb from the TSS separately for enrichment analysis. To ensure that the enrichment signal is not mainly driven by annotations from a small number of genes or unusual genomic region, we repeated the analysis excluding each chromosome independently, and reported the minimum enrichment among these 22 estimates for each genomic feature. (See Supplemental Data S2 for the complete enrichment results.)
Regulatory variant predictive model (LRVM)
We defined a latent regulatory variant model (LRVM) (Supplemental Fig. S28a), a Bayesian network modeling the probability that each SNP will be associated with an expression trait based on genomic annotations. As we describe in details below, in order to account for associations that arise from linkage disequilibrium (LD) with a nearby eQTL, while still maintaining the ability to capture multiple independent eQTLs impacting the same gene, we model all SNPs near the same gene jointly. In addition, we also account for the effects of allele frequency (which can affect statistical power to detect an association even for causal SNPs). This framework is used for prediction of both eQTL and sQTL associations, but model parameters are trained separately to reflect differences in their genomic properties.
For each gene, we identify the set of candidate eQTL SNPs (s1,…, sk) in some chosen window near the transcription start site (TSS) of the gene (in the analysis of LRVM we focus on SNPs within 20 kb of the TSS). For each of these SNPs, we define a binary variable ai representing whether SNP i is associated with the gene, along with a separate latent binary variable di representing whether SNP i itself has strong regulatory potential. Using the location features and genomic annotations available for SNP i as a feature vector Fi (see previous section for location and genomic annotations used in this study), we define a logistic function, parameterized by a shared set of weights w, to predict di from Fi. The association variables ai are also predicted using a logistic function, where the input to each ai is the full vector of latent variables (d1, …, dk) for all nearby SNPs, each weighted by their MAF and LD with i. This model is summarized as follows:
with lk,i indicating the LD between i and kth SNP; mi indicating the MAF of ith SNP; parameters  and
and  modulating the effects of LD and MAF; and parameters
  and
and  indicating the prior odds. From a training set comprised of features Fi and observed ai from eQTL association results, we learn the parameters w,
  , and
, and  using hard expectation maximization (Dempster et al. 1977). In this method, we iterate between finding the most likely assignment to latent variables d using a current estimate of w,
  , and
, and  , and re-estimating w,
  , and
, and  using the current assignment to d. We can then test the accuracy of our model by evaluating its ability to predict associations on a held-out set of genes and SNPs (Supplemental Figs. S28b, S29, S31). Separate models (different estimates of w,
  , and
, and  ) are learned for eQTLs and sQTLs. See Supplemental Material and Supplemental Figures S28b, S29, S31, for description of evaluation and comparisons of LRVM with other models.
Data access
Genotype, raw RNA-seq, quantified expression, and covariate data are available by application through the NIMH Center for Collaborative Genomic Studies on Mental Disorders. Instructions for requesting access to data can be found at https://www.nimhgenetics.org/access_data_biomaterial.php, and inquiries should reference the “Depression Genes and Networks study (D. Levinson, PI).”
Competing interest statement
C.M. is an employee of Illumina, Inc. C.D.H. was employed by Illumina, Inc., for a portion of the study and by Personalis for a portion. R.M. is employed by Centrillion Biosciences, Inc.
Acknowledgments
We would like to thank Hoon Cho for contributions to figure preparation. This work was supported by National Institute of Mental Health Grants RC2MH089916 and R01MH090941.
Author contributions: A.B. designed and carried out the analysis, with input from D.K., D.F.L., S.B.M., S.M., and X.Z. S.M. contributed to development and implementation of statistical analysis. D.F.L. and D.K. designed the Depression Genes and Networks study, with contributions from A.E.U. X.Z. developed the RNA-seq quantification and QC pipeline and contributed to bioinformatics analysis. J.B.P. and M.M.W. performed clinical interviews for identifying appropriate subjects. C.M. and C.D.H. carried out the RNA sequencing. K.B.B. performed initial RNA sample preparation. J.S. performed the genotype QC. R.M. carried out the genotyping.
Footnotes
[Supplemental material is available for this article.]
Article published online before print. Article, supplemental material, and publication date are at http://www.genome.org/cgi/doi/10.1101/gr.155192.113.
References
- Aranda B, Achuthan P, Alam-Faruque Y, Armean I, Bridge A, Derow C, Feuermann M, Ghanbarian AT, Kerrien S, Khadake J, et al. 2010. The IntAct molecular interaction database in 2010. Nucleic Acids Res 38: D525–D531 [DOI] [PMC free article] [PubMed] [Google Scholar]
- Bodmer W, Bonilla C 2008. Common and rare variants in multifactorial susceptibility to common diseases. Nat Genet 40: 695–701 [DOI] [PMC free article] [PubMed] [Google Scholar]
- Boyle AP, Hong EL, Hariharan M, Cheng Y, Schaub MA, Kasowski M, Karczewski KJ, Park J, Hitz BC, Weng S, et al. 2012. Annotation of functional variation in personal genomes using RegulomeDB. Genome Res 22: 1790–1797 [DOI] [PMC free article] [PubMed] [Google Scholar]
- Breitkreutz BJ, Stark C, Tyers M 2003. The GRID: The General Repository for Interaction Datasets. Genome Biol 4: R23. [DOI] [PMC free article] [PubMed] [Google Scholar]
- Chatr-aryamontri A, Ceol A, Palazzi LM, Nardelli G, Schneider MV, Castagnoli L, Cesareni G 2007. MINT: The Molecular INTeraction database. Nucleic Acids Res 35: D572–D574 [DOI] [PMC free article] [PubMed] [Google Scholar]
- Cheung VG, Nayak RR, Wang IX, Elwyn S, Cousins SM, Morley M, Spielman RS 2010. Polymorphic cis- and trans-regulation of human gene expression. PLoS Biol 8: e1000480. [DOI] [PMC free article] [PubMed] [Google Scholar]
- Cock PJ, Fields CJ, Goto N, Heuer ML, Rice PM 2010. The Sanger FASTQ file format for sequences with quality scores, and the Solexa/Illumina FASTQ variants. Nucleic Acids Res 38: 1767–1771 [DOI] [PMC free article] [PubMed] [Google Scholar]
- Cooper GM, Shendure J 2011. Needles in stacks of needles: Finding disease-causal variants in a wealth of genomic data. Nat Rev Genet 12: 628–640 [DOI] [PubMed] [Google Scholar]
- Degner JF, Pai AA, Pique-Regi R, Veyrieras JB, Gaffney DJ, Pickrell JK, De Leon S, Michelini K, Lewellen N, Crawford GE, et al. 2012. DNase I sensitivity QTLs are a major determinant of human expression variation. Nature 482: 390–394 [DOI] [PMC free article] [PubMed] [Google Scholar]
- Dempster AP, Laird NM, Rubin DB 1977. Maximum likelihood from incomplete data via the EM algorithm. J R Stat Soc Ser B 39: 1–38 [Google Scholar]
- Dimas AS, Deutsch S, Stranger BE, Montgomery SB, Borel C, Attar-Cohen H, Ingle C, Beazley C, Gutierrez Arcelus M, Sekowska M, et al. 2009. Common regulatory variation impacts gene expression in a cell type-dependent manner. Science 325: 1246–1250 [DOI] [PMC free article] [PubMed] [Google Scholar]
- Dixon JR, Selvaraj S, Yue F, Kim A, Li Y, Shen Y, Hu M, Liu JS, Ren B 2012. Topological domains in mammalian genomes identified by analysis of chromatin interactions. Nature 485: 376–380 [DOI] [PMC free article] [PubMed] [Google Scholar]
- Ehret GB, Munroe PB, Rice KM, Bochud M, Johnson AD, Chasman DI, Smith AV, Tobin MD, Verwoert GC, Hwang SJ, et al. 2011. Genetic variants in novel pathways influence blood pressure and cardiovascular disease risk. Nature 478: 103–109 [DOI] [PMC free article] [PubMed] [Google Scholar]
- Emilsson V, Thorleifsson G, Zhang B, Leonardson AS, Zink F, Zhu J, Carlson S, Helgason A, Walters GB, Gunnarsdottir S, et al. 2008. Genetics of gene expression and its effect on disease. Nature 452: 423–428 [DOI] [PubMed] [Google Scholar]
- The ENCODE Project Consortium 2012. An integrated encyclopedia of DNA elements in the human genome. Nature 489: 57–74 [DOI] [PMC free article] [PubMed] [Google Scholar]
- Fairfax BP, Makino S, Radhakrishnan J, Plant K, Leslie S, Dilthey A, Ellis P, Langford C, Vannberg FO, Knight JC 2012. Genetics of gene expression in primary immune cells identifies cell type-specific master regulators and roles of HLA alleles. Nat Genet 44: 502–510 [DOI] [PMC free article] [PubMed] [Google Scholar]
- Fehrmann RS, Jansen RC, Veldink JH, Westra HJ, Arends D, Bonder MJ, Fu J, Deelen P, Groen HJ, Smolonska A, et al. 2011. Trans-eQTLs reveal that independent genetic variants associated with a complex phenotype converge on intermediate genes, with a major role for the HLA. PLoS Genet 7: e1002197. [DOI] [PMC free article] [PubMed] [Google Scholar]
- Fraser HB, Xie X 2009. Common polymorphic transcript variation in human disease. Genome Res 19: 567–575 [DOI] [PubMed] [Google Scholar]
- Fraser HB, Hirsh AE, Steinmetz LM, Scharfe C, Feldman MW 2002. Evolutionary rate in the protein interaction network. Science 296: 750–752 [DOI] [PubMed] [Google Scholar]
- Gaffney DJ, Veyrieras JB, Degner JF, Pique-Regi R, Pai AA, Crawford GE, Stephens M, Gilad Y, Pritchard JK 2012. Dissecting the regulatory architecture of gene expression QTLs. Genome Biol 13: R7. [DOI] [PMC free article] [PubMed] [Google Scholar]
- Ge B, Pokholok DK, Kwan T, Grundberg E, Morcos L, Verlaan DJ, Le J, Koka V, Lam KC, Gagne V, et al. 2009. Global patterns of cis variation in human cells revealed by high-density allelic expression analysis. Nat Genet 41: 1216–1222 [DOI] [PubMed] [Google Scholar]
- Gerstein MB, Kundaje A, Hariharan M, Landt SG, Yan KK, Cheng C, Mu XJ, Khurana E, Rozowsky J, Alexander R, et al. 2012. Architecture of the human regulatory network derived from ENCODE data. Nature 489: 91–100 [DOI] [PMC free article] [PubMed] [Google Scholar]
- Gieger C, Radhakrishnan A, Cvejic A, Tang W, Porcu E, Pistis G, Serbanovic-Canic J, Elling U, Goodall AH, Labrune Y, et al. 2011. New gene functions in megakaryopoiesis and platelet formation. Nature 480: 201–208 [DOI] [PMC free article] [PubMed] [Google Scholar]
- Gilad Y, Rifkin SA, Pritchard JK 2008. Revealing the architecture of gene regulation: The promise of eQTL studies. Trends Genet 24: 408–415 [DOI] [PMC free article] [PubMed] [Google Scholar]
- Goel R, Harsha HC, Pandey A, Prasad TS 2012. Human Protein Reference Database and Human Proteinpedia as resources for phosphoproteome analysis. Mol Biosyst 8: 453–463 [DOI] [PMC free article] [PubMed] [Google Scholar]
- Gonzàlez-Porta M, Calvo M, Sammeth M, Guigó R 2012. Estimation of alternative splicing variability in human populations. Genome Res 22: 528–538 [DOI] [PMC free article] [PubMed] [Google Scholar]
- Goring HH, Curran JE, Johnson MP, Dyer TD, Charlesworth J, Cole SA, Jowett JB, Abraham LJ, Rainwater DL, Comuzzie AG, et al. 2007. Discovery of expression QTLs using large-scale transcriptional profiling in human lymphocytes. Nat Genet 39: 1208–1216 [DOI] [PubMed] [Google Scholar]
- Grundberg E, Small KS, Hedman AK, Nica AC, Buil A, Keildson S, Bell JT, Yang TP, Meduri E, Barrett A, et al. 2012. Mapping cis- and trans-regulatory effects across multiple tissues in twins. Nat Genet 44: 1084–1089 [DOI] [PMC free article] [PubMed] [Google Scholar]
- Haider S, Ballester B, Smedley D, Zhang J, Rice P, Kasprzyk A 2009. BioMart Central Portal–unified access to biological data. Nucleic Acids Res 37: W23–W27 [DOI] [PMC free article] [PubMed] [Google Scholar]
- Hindorff LA, Sethupathy P, Junkins HA, Ramos EM, Mehta JP, Collins FS, Manolio TA 2009. Potential etiologic and functional implications of genome-wide association loci for human diseases and traits. Proc Natl Acad Sci 106: 9362–9367 [DOI] [PMC free article] [PubMed] [Google Scholar]
- Jordan IK, Mariño-Ramírez L, Wolf YI, Koonin EV 2004. Conservation and coevolution in the scale-free human gene coexpression network. Mol Biol Evol 21: 2058–2070 [DOI] [PubMed] [Google Scholar]
- Karro JE, Yan Y, Zheng D, Zhang Z, Carriero N, Cayting P, Harrrison P, Gerstein M 2007. Pseudogene.org: A comprehensive database and comparison platform for pseudogene annotation. Nucleic Acids Res 35: D55–D60 [DOI] [PMC free article] [PubMed] [Google Scholar]
- Kleinjan DA, van Heyningen V 2005. Long-range control of gene expression: Emerging mechanisms and disruption in disease. Am J Hum Genet 76: 8–32 [DOI] [PMC free article] [PubMed] [Google Scholar]
- Kwan T, Benovoy D, Dias C, Gurd S, Provencher C, Beaulieu P, Hudson TJ, Sladek R, Majewski J 2008. Genome-wide analysis of transcript isoform variation in humans. Nat Genet 40: 225–231 [DOI] [PubMed] [Google Scholar]
- Lachmann A, Xu H, Krishnan J, Berger SI, Mazloom AR, Ma'ayan A 2010. ChEA: Transcription factor regulation inferred from integrating genome-wide ChIP-X experiments. Bioinformatics 26: 2438–2444 [DOI] [PMC free article] [PubMed] [Google Scholar]
- Lee SI, Dudley AM, Drubin D, Silver PA, Krogan NJ, Pe'er D, Koller D 2009. Learning a prior on regulatory potential from eQTL data. PLoS Genet 5: e1000358. [DOI] [PMC free article] [PubMed] [Google Scholar]
- Lercher MJ, Urrutia AO, Hurst LD 2002. Clustering of housekeeping genes provides a unified model of gene order in the human genome. Nat Genet 31: 180–183 [DOI] [PubMed] [Google Scholar]
- Liang L, Morar N, Dixon AL, Lathrop GM, Abecasis GR, Moffatt MF, Cookson WO 2013. A cross-platform analysis of 14,177 expression quantitative trait loci derived from lymphoblastoid cell lines. Genome Res 23: 716–726 [DOI] [PMC free article] [PubMed] [Google Scholar]
- Lieberman-Aiden E, van Berkum NL, Williams L, Imakaev M, Ragoczy T, Telling A, Amit I, Lajoie BR, Sabo PJ, Dorschner MO, et al. 2009. Comprehensive mapping of long-range interactions reveals folding principles of the human genome. Science 326: 289–293 [DOI] [PMC free article] [PubMed] [Google Scholar]
- Martens JH, Brinkman AB, Simmer F, Francoijs KJ, Nebbioso A, Ferrara F, Altucci L, Stunnenberg HG 2010. PML-RARα/RXR alters the epigenetic landscape in acute promyelocytic leukemia. Cancer Cell 17: 173–185 [DOI] [PubMed] [Google Scholar]
- McLaren W, Pritchard B, Rios D, Chen Y, Flicek P, Cunningham F 2010. Deriving the consequences of genomic variants with the Ensembl API and SNP Effect Predictor. Bioinformatics 26: 2069–2070 [DOI] [PMC free article] [PubMed] [Google Scholar]
- Montgomery SB, Sammeth M, Gutierrez-Arcelus M, Lach RP, Ingle C, Nisbett J, Guigo R, Dermitzakis ET 2010. Transcriptome genetics using second generation sequencing in a Caucasian population. Nature 464: 773–777 [DOI] [PMC free article] [PubMed] [Google Scholar]
- Mortazavi A, Williams BA, McCue K, Schaeffer L, Wold B 2008. Mapping and quantifying mammalian transcriptomes by RNA-Seq. Nat Methods 5: 621–628 [DOI] [PubMed] [Google Scholar]
- Mostafavi S, Battle A, Zhu X, Urban AE, Levinson D, Montgomery SB, Koller D 2013. Normalizing RNA-sequencing data by modeling hidden covariates with prior knowledge. PLoS ONE 8: e68141. [DOI] [PMC free article] [PubMed] [Google Scholar]
- Mullighan CG, Su X, Zhang J, Radtke I, Phillips LA, Miller CB, Ma J, Liu W, Cheng C, Schulman BA, et al. 2009. Deletion of IKZF1 and prognosis in acute lymphoblastic leukemia. N Engl J Med 360: 470–480 [DOI] [PMC free article] [PubMed] [Google Scholar]
- Naj AC, Jun G, Beecham GW, Wang LS, Vardarajan BN, Buros J, Gallins PJ, Buxbaum JD, Jarvik GP, Crane PK, et al. 2011. Common variants at MS4A4/MS4A6E, CD2AP, CD33 and EPHA1 are associated with late-onset Alzheimer's disease. Nat Genet 43: 436–441 [DOI] [PMC free article] [PubMed] [Google Scholar]
- Nica AC, Montgomery SB, Dimas AS, Stranger BE, Beazley C, Barroso I, Dermitzakis ET 2010. Candidate causal regulatory effects by integration of expression QTLs with complex trait genetic associations. PLoS Genet 6: e1000895. [DOI] [PMC free article] [PubMed] [Google Scholar]
- Nobrega MA, Ovcharenko I, Afzal V, Rubin EM 2003. Scanning human gene deserts for long-range enhancers. Science 302: 413. [DOI] [PubMed] [Google Scholar]
- Ober C, Tan Z, Sun Y, Possick JD, Pan L, Nicolae R, Radford S, Parry RR, Heinzmann A, Deichmann KA, et al. 2008. Effect of variation in CHI3L1 on serum YKL-40 level, risk of asthma, and lung function. N Engl J Med 358: 1682–1691 [DOI] [PMC free article] [PubMed] [Google Scholar]
- Oliver B, Misteli T 2005. A non-random walk through the genome. Genome Biol 6: 214. [DOI] [PMC free article] [PubMed] [Google Scholar]
- Pastinen T, Hudson TJ 2004. Cis-acting regulatory variation in the human genome. Science 306: 647–650 [DOI] [PubMed] [Google Scholar]
- Pickrell JK, Marioni JC, Pai AA, Degner JF, Engelhardt BE, Nkadori E, Veyrieras JB, Stephens M, Gilad Y, Pritchard JK 2010. Understanding mechanisms underlying human gene expression variation with RNA sequencing. Nature 464: 768–772 [DOI] [PMC free article] [PubMed] [Google Scholar]
- Quinlan AR, Hall IM 2010. BEDTools: A flexible suite of utilities for comparing genomic features. Bioinformatics 26: 841–842 [DOI] [PMC free article] [PubMed] [Google Scholar]
- Roberts A, Trapnell C, Donaghey J, Rinn JL, Pachter L 2011. Improving RNA-Seq expression estimates by correcting for fragment bias. Genome Biol 12: R22. [DOI] [PMC free article] [PubMed] [Google Scholar]
- Schadt EE, Lamb J, Yang X, Zhu J, Edwards S, Guhathakurta D, Sieberts SK, Monks S, Reitman M, Zhang C, et al. 2005. An integrative genomics approach to infer causal associations between gene expression and disease. Nat Genet 37: 710–717 [DOI] [PMC free article] [PubMed] [Google Scholar]
- Schaub MA, Boyle AP, Kundaje A, Batzoglou S, Snyder M 2012. Linking disease associations with regulatory information in the human genome. Genome Res 22: 1748–1759 [DOI] [PMC free article] [PubMed] [Google Scholar]
- Serre D, Gurd S, Ge B, Sladek R, Sinnett D, Harmsen E, Bibikova M, Chudin E, Barker DL, Dickinson T, et al. 2008. Differential allelic expression in the human genome: A robust approach to identify genetic and epigenetic cis-acting mechanisms regulating gene expression. PLoS Genet 4: e1000006. [DOI] [PMC free article] [PubMed] [Google Scholar]
- Spilianakis CG, Flavell RA 2004. Long-range intrachromosomal interactions in the T helper type 2 cytokine locus. Nat Immunol 5: 1017–1027 [DOI] [PubMed] [Google Scholar]
- Stranger BE, Forrest MS, Dunning M, Ingle CE, Beazley C, Thorne N, Redon R, Bird CP, de Grassi A, Lee C, et al. 2007. Relative impact of nucleotide and copy number variation on gene expression phenotypes. Science 315: 848–853 [DOI] [PMC free article] [PubMed] [Google Scholar]
- Stranger BE, Montgomery SB, Dimas AS, Parts L, Stegle O, Ingle CE, Sekowska M, Smith GD, Evans D, Gutierrez-Arcelus M, et al. 2012. Patterns of cis regulatory variation in diverse human populations. PLoS Genet 8: e1002639. [DOI] [PMC free article] [PubMed] [Google Scholar]
- Trapnell C, Pachter L, Salzberg SL 2009. TopHat: Discovering splice junctions with RNA-Seq. Bioinformatics 25: 1105–1111 [DOI] [PMC free article] [PubMed] [Google Scholar]
- Trapnell C, Williams BA, Pertea G, Mortazavi A, Kwan G, van Baren MJ, Salzberg SL, Wold BJ, Pachter L 2010. Transcript assembly and quantification by RNA-Seq reveals unannotated transcripts and isoform switching during cell differentiation. Nat Biotechnol 28: 511–515 [DOI] [PMC free article] [PubMed] [Google Scholar]
- Verlaan DJ, Ge B, Grundberg E, Hoberman R, Lam KC, Koka V, Dias J, Gurd S, Martin NW, Mallmin H, et al. 2009. Targeted screening of cis-regulatory variation in human haplotypes. Genome Res 19: 118–127 [DOI] [PMC free article] [PubMed] [Google Scholar]
- Veyrieras JB, Gaffney DJ, Pickrell JK, Gilad Y, Stephens M, Pritchard JK 2012. Exon-specific QTLs skew the inferred distribution of expression QTLs detected using gene expression array data. PLoS ONE 7: e30629. [DOI] [PMC free article] [PubMed] [Google Scholar]
- Vilella AJ, Severin J, Ureta-Vidal A, Heng L, Durbin R, Birney E 2009. EnsemblCompara GeneTrees: Complete, duplication-aware phylogenetic trees in vertebrates. Genome Res 19: 327–335 [DOI] [PMC free article] [PubMed] [Google Scholar]
- Wang ET, Sandberg R, Luo S, Khrebtukova I, Zhang L, Mayr C, Kingsmore SF, Schroth GP, Burge CB 2008. Alternative isoform regulation in human tissue transcriptomes. Nature 456: 470–476 [DOI] [PMC free article] [PubMed] [Google Scholar]
- Warde-Farley D, Donaldson SL, Comes O, Zuberi K, Badrawi R, Chao P, Franz M, Grouios C, Kazi F, Lopes CT et al. 2010. The GeneMANIA prediction server: Biological network integration for gene prioritization and predicting gene function. Nucleic Acids Res 38: W214–W220 [DOI] [PMC free article] [PubMed] [Google Scholar]
- Yan H, Yuan W, Velculescu VE, Vogelstein B, Kinzler KW 2002. Allelic variation in human gene expression. Science 297: 1143. [DOI] [PubMed] [Google Scholar]
- Zhang K, Li JB, Gao Y, Egli D, Xie B, Deng J, Li Z, Lee JH, Aach J, Leproust EM, et al. 2009. Digital RNA allelotyping reveals tissue-specific and allele-specific gene expression in human. Nat Methods 6: 613–618 [DOI] [PMC free article] [PubMed] [Google Scholar]
- Zhu Q, Ge D, Maia JM, Zhu M, Petrovski S, Dickson SP, Heinzen EL, Shianna KV, Goldstein DB 2011. A genome-wide comparison of the functional properties of rare and common genetic variants in humans. Am J Hum Genet 88: 458–468 [DOI] [PMC free article] [PubMed] [Google Scholar]