

Abstract
Trans-splicing is a post-transcriptional event that joins exons from separate pre-mRNAs. Detection of trans-splicing is usually severely hampered by experimental artifacts and genetic rearrangements. Here, we develop a new computational pipeline, TSscan, which integrates different types of high-throughput long-/short-read transcriptome sequencing of different human embryonic stem cell (hESC) lines to effectively minimize false positives while detecting trans-splicing. Combining TSscan screening with multiple experimental validation steps revealed that most chimeric RNA products were platform-dependent experimental artifacts of RNA sequencing. We successfully identified and confirmed four trans-spliced RNAs, including the first reported trans-spliced large intergenic noncoding RNA (“tsRMST”). We showed that these trans-spliced RNAs were all highly expressed in human pluripotent stem cells and differentially expressed during hESC differentiation. Our results further indicated that tsRMST can contribute to pluripotency maintenance of hESCs by suppressing lineage-specific gene expression through the recruitment of NANOG and the PRC2 complex factor, SUZ12. Taken together, our findings provide important insights into the role of trans-splicing in pluripotency maintenance of hESCs and help to facilitate future studies into trans-splicing, opening up this important but understudied class of post-transcriptional events for comprehensive characterization.
Alternative splicing, which arises from post-transcriptional events, can lead to the generation of multiple transcript isoforms from a single gene, thus providing an essential source of diversity for the transcriptome and proteome (Graveley 2001; Maniatis and Tasic 2002; Black and Grabowski 2003; Bracco and Kearsey 2003; Blencowe 2006; Chen et al. 2006; Ben-Dov et al. 2008; Huang et al. 2008; Jin et al. 2008; Mudge et al. 2011). Splicing can occur either in cis or in trans (Horiuchi and Aigaki 2006; Gingeras 2009). Cis-splicing joins exons within a single precursor mRNA (pre-mRNA), whereas trans-splicing joins exons from two or more separate pre-mRNAs originating from the same gene (intragenic trans-splicing) or two or more different genes (intergenic trans-splicing). The best-characterized form of trans-splicing is spliced-leader (SL) trans-splicing, which provides mRNAs with a new 5′ cap and leader sequence, and commonly occurs in unicellular organisms, nematodes, and trypanosomes (Sutton and Boothroyd 1986; Krause and Hirsh 1987; Nilsen 2001; Hastings 2005). However, the mechanisms underlying non-SL trans-splicing remain largely unknown (Lasda and Blumenthal 2011). To date, only a few non-SL trans-splicing events have been well-documented. In higher eukaryotes, the best-known trans-splicing examples are two Drosophila genes, mod(mdg4) and lola, which are involved in apoptosis and axon guidance decisions, respectively (Dorn and Krauss 2003; Goeke et al. 2003). The most prominent examples of human genes that undergo trans-splicing reported so far are JAZF1-SUZ12 (also known as JJAZ1) and SLC45A3-ELK4; the former is translated into a chimeric protein with anti-apoptotic function and is believed to be a prerequisite for chromosomal exchange (Li et al. 2008; Gingeras 2009; Schoenfelder et al. 2010), and the latter is related to prostate cancer (Gingeras 2009; Rickman et al. 2009). Although trans-splicing remains an understudied class of post-transcriptional events in higher eukaryotes, accumulating evidence suggests it is of biological significance (Gingeras 2009).
Generally, trans-splicing is detected by comparing the reference genomes with ESTs/mRNAs (Shao et al. 2006; Li et al. 2009; Herai and Yamagishi 2010; Kim et al. 2010) or by next-generation sequencing (NGS) of mRNAs (RNA-seq) (McManus et al. 2010; Zhang et al. 2010; Al-Balool et al. 2011; Fang et al. 2012). Trans-splicing events detected by such means may, however, include a considerable number of false positives that arise from experimental artifacts, such as template switching (McManus et al. 2010; Ozsolak and Milos 2011). Template switching is generated during RT-PCR and frequently emerges in cDNA products (Cocquet et al. 2006; Houseley and Tollervey 2010). A prominent study using hybrid mRNAs (i.e., Drosophila melanogaster females vs. Drosophila sechellia males) demonstrated that experimental artifacts are the predominant source of apparent trans-spliced RNA products observed in mRNA (McManus et al. 2010). It would, however, be impossible to apply such a system to humans. Furthermore, genetic rearrangements can form noncolinear (or chimeric) RNAs (Shao et al. 2006; Gingeras 2009; Frenkel-Morgenstern et al. 2012), which are not easily distinguished from trans-spliced RNAs, presenting another challenge to the accurate detection of trans-splicing. To our knowledge, there is currently no available method of systematically analyzing trans-splicing that can simultaneously account for experimental artifacts and genetic rearrangements in humans.
To address these issues, we developed TSscan, which utilizes transcriptome sequencing data from different NGS platforms and different undifferentiated human embryonic stem cell (hESC) lines. It is important to note that hESCs have been reported to have a very high level of transcriptome complexity, and high transcript diversity has been suggested to contribute to hESC pluripotency (Wu et al. 2010). As such, it is worth investigating whether trans-splicing exists and is biologically significant in hESCs. By performing TSscan screening combined with multiple experimental validation steps, we successfully confirmed that four trans-splicing events occur in hESCs. We found that these trans-spliced RNAs were all highly expressed in human pluripotent stem cells and differentially expressed during hESC differentiation. We also identified the first trans-spliced large intergenic noncoding RNA, showed that it tends to be specifically transcribed in human pluripotent stem cells, and significantly affects pluripotency maintenance of hESCs. Therefore, this study not only describes a new approach to systematically detect trans-splicing, but also provides further insight into the potential roles of trans-splicing in hESC pluripotency and early human embryonic development.
Results
Identification of trans-spliced RNAs in hESCs using TSscan
To search for trans-splicing events in hESCs, we generated 0.83 million long reads (averaging 353.7 bp) and 230.63 million short reads (50 bp) from H9 hESCs by performing Roche 454 and SOLiD whole-transcriptome sequencing, respectively, and directly downloaded the 454/Illumina RNA-seq data of H1 hESCs from a publicly available database (Table 1; Wu et al. 2010). Since trans-splicing may also join colinear exons such as mod(mdg4) and lola (Dorn and Krauss 2003; Goeke et al. 2003), in this study we only consider trans-spliced noncolinear (or chimeric) RNA candidates for simplicity. TSscan involved four main screening steps (Fig. 1A). First, we searched for all possible chimeric RNA candidates by aligning the long 454 reads of hESC H1/H9 against the human reference genome (see Methods) and extracted 8822 candidates (Fig. 1B). The junction sites between two topologically distinct genomic loci were designated as “chimeric junction sites.” Of note, since both 454 RNA-seq libraries were prepared by oligo-dT selection, the retrieved chimeric RNA candidates are unlikely to be noncolinearly encoded RNAs that were cis-spliced to form circular RNAs (i.e., RNAs in which the exon order is a circular permutation of that encoded by the corresponding genomic sequence [Hsu and Coca-Prados 1979; Nigro et al. 1991]). Second, to minimize the possibility of false positives resulting from lack of depth in long reads or NGS platform specificity, we aligned the short reads (i.e., SOLiD/Illumina reads) against the 8822 long-read-nominated candidates and discarded the candidates that were not supported by short reads. The remaining candidates were then categorized into four subsets according to the types of supporting RNA-seq data (i.e., S1–S4; see Fig. 1B). Third, to further eliminate potential experimental artifacts, candidates that satisfied any of the following in silico filters were eliminated: (1) chimeric junction sites containing short homologous sequences (SHSs) or gaps (as these tend to arise from template switching) (McManus et al. 2010); (2) sense–antisense fusion candidates containing noncanonical splicing signals at the chimeric junction sites (Houseley and Tollervey 2010); and (3) candidates containing sequences from the mitochondrial genome (McManus et al. 2010). Finally, to eliminate potential genetic rearrangements, only the nine candidates that were supported by RNA-seq data from both H1 and H9 hESCs were retained (Fig. 1B; Table 2). Upon completion of the TSscan screening process, ∼99.9% of the 454-nominated candidates had been discarded. We reason that the presence of experimental artifacts is the most likely explanation for the TSscan-excluded cases (see Discussion).
Table 1.
NGS data sets used in this study
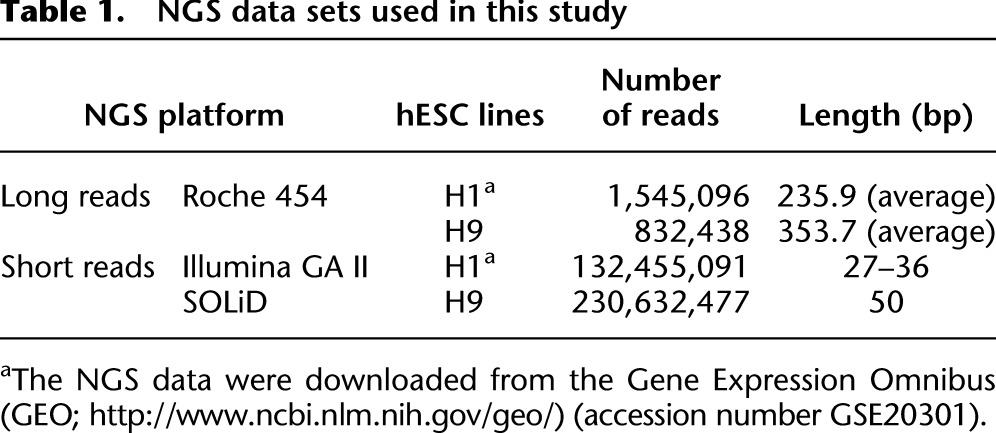
Figure 1.

Identification and experimental validation of trans-splicing events in the transcriptome of hESCs. (A) TSscan identification and subsequent experimental validation. TSscan identification involved four steps. The first three steps identified trans-spliced RNA candidates and removed potential in vitro artifacts, and the last step removed potential genetic rearrangements. (SHS) Short homologous sequences. (B) The number of candidates remaining after each TSscan filter step. Note that one candidate may simultaneously belong to different data sets. For example, in Step 2, one candidate belongs to both S1 and S2, and one candidate belongs to both S3 and S4. (C) MMLV-RTase-based and (D) AMV-RTase-based RT-PCR products of tsCSNK1G3, tsARHGAP5, tsFAT1, tsRMST, and tsSOBP in three types of hESC line (H1, H9, and NTU1). (±RT) RT-PCR without/with RTase. (E) qRT-PCR analysis of tsCSNK1G3, tsARHGAP5, tsFAT1, and tsRMST in multiple hESC lines (H1, H9, and NTU1). (F) Schematic representations (top) and sequence chromatograms (bottom) for tsCSNK1G3, tsARHGAP5, tsFAT1, and tsRMST. The long/short RNA-seq reads that support the chimeric junction sites (indicated by arrows) of the corresponding trans-spliced RNAs are shown.
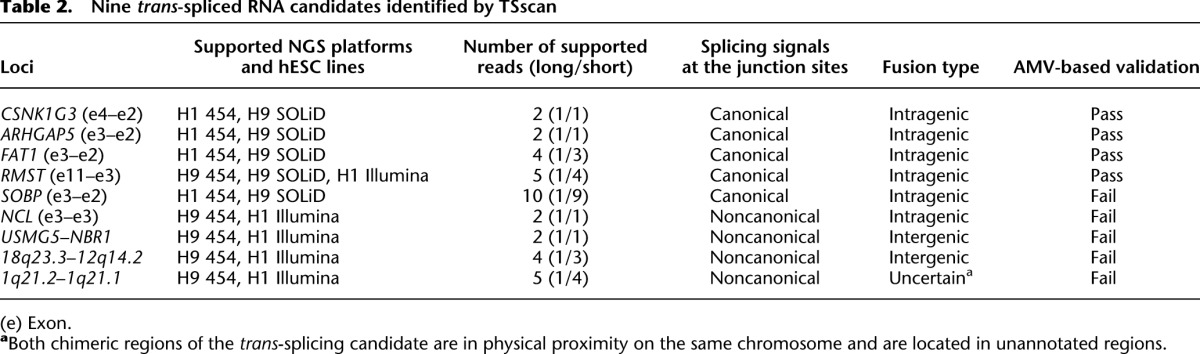
Table 2.
Nine trans-spliced RNA candidates identified by TSscan
Experimental validation of trans-splicing events identified by TSscan
To confirm that the nine candidates identified by TSscan were indeed examples of trans-splicing, we designed a series of experimental validations (Fig. 1A). We first performed RT-PCR with Moloney Murine Leukemia Virus (MMLV)-derived reverse transcriptase (RTase) (the NGS cDNA library was generated using the same RTase), and found that the transcripts of five trans-splicing candidates were readily detected in multiple hESC lines (H1, H9, and NTU1) (Fig. 1C). These transcripts were not detected in the RT-free control, establishing that they did not arise from genomic contamination (Fig. 1C). As the chimeric junction sites of these five cases are all intragenic (originating from CSNK1G3, ARHGAP5, FAT1, RMST, and SOBP), they are designated as tsCSNK1G3, tsARHGAP5, tsFAT1, tsRMST, and tsSOBP, respectively. False positive splicing events that arise from template switching tend to be RTase-dependent and can therefore be detected by comparing the PCR products that arise from the products of different RTases (Houseley and Tollervey 2010). As such, we further validated the five cases by RT-PCR using Avian Myeloblastosis Virus (AMV)-derived RTase. This revealed that tsSOBP is MMLV-RTase-dependent, and thus an artifact (Fig. 1D). Increasing the primer annealing temperature of MMLV-based RTase experiments has been previously shown to suppress the occurrence of template switching (Ouhammouch and Brody 1992; Cocquet et al. 2006); however, we found that increasing the temperature did not eliminate the tsSOBP artifact (Supplemental Fig. 1). We further examined these five cases by performing RNase protection assay (RPA; Supplemental Material), a non-RTase-based validation of RNA (Djebali et al. 2012), on total RNA of hESC H9, and found that only the probes for the RTase dependent-case tsSOBP were degraded (Supplemental Fig. 2). These results indicated that tsSOBP was indeed an experimental artifact. We thus emphasize the necessity of comparing the products of different RTases in confirming trans-splicing. Finally, we used qRT-PCR to show that trans-splicing was not a rare event in hESCs (Fig. 1E), and sequenced the RT-PCR amplicons to validate the identity of the chimeric junction sites (Fig. 1F). Collectively, the preceding results provide multiple lines of evidence in support of the four candidates being genuine trans-spliced transcripts.
Although tsARHGAP5 was previously detected in tumors (Al-Balool et al. 2011), these four RNAs have not been reported to be expressed in hESCs. For tsCSNK1G3, tsARHGAP5, and tsFAT1, trans-splicing was found to occur in the 5′ UTR upstream of the start codon (Fig. 1F). Of special significance is the identity of RMST as a large intergenic noncoding RNA (lincRNA) (Chan et al. 2002). As examined by the coding potential calculator (score < 53) (Kong et al. 2007), tsRMST is the first trans-spliced lincRNA to be identified through multiple experimental validations.
Trans-spliced RNAs are differentially expressed during hESC differentiation
We proceeded to examine whether the four transcripts identified in hESCs are also expressed in human induced pluripotent stem cells (iPSCs) reprogrammed from various somatic cell types, including skin fibroblast, dermal papilla cells, and granulose cells (Huang et al. 2010). As shown in Figure 2A, all four trans-spliced RNAs were expressed in each tested human iPSC clone, suggesting that these events tend to occur in human pluripotent stem cells. We then examined whether expression of these trans-spliced transcripts is associated with differentiation status by comparing their expression levels between undifferentiated and differentiated hESCs. We observed that tsCSNK1G3, tsARHGAP5, and tsFAT1 exhibited elevated expression levels upon in vitro differentiation, whereas the expression level of tsRMST was significantly decreased after in vitro differentiation (Fig. 2B). These results revealed that these trans-spliced transcripts were differentially expressed during hESC in vitro differentiation, indicating that they may play significant roles in pluripotency-related regulation or pathways regulating early lineage differentiation.
Figure 2.

Expression profiles of tsCSNK1G3, tsARHGAP5, tsFAT1, and tsRMST in human pluripotent stem cells and normal tissues. (A) RT-PCR and qRT-PCR analysis of tsCSNK1G3, tsARHGAP5, tsFAT1, and tsRMST in iPSCs derived from human foreskin fibroblasts (iCFB50) (Huang et al. 2010), granulosa cells (iGRA2), and dermal papilla cells (iCD3) with their respective parental cell lines. (HF) Human foreskin fibroblasts; (Gra) granulosa cells; (DPC) dermal papilla cells. (B) qRT-PCR analysis of tsCSNK1G3, tsARHGAP5, tsFAT1, and tsRMST at various stages of hESC in vitro differentiation (i.e., day 14 and day 21). (C) RT-PCR products of the four trans-spliced transcripts (tsCSNK1G3, tsARHGAP5, tsFAT1, and tsRMST) and their corresponding colinear isoforms in ten human normal tissues. All P-values were estimated by the two-sample, two-tailed t-test. Significance: (*) P < 0.05; (**) P < 0.01; and (***) P < 0.001.
Furthermore, we compared the expression of each trans-spliced isoform with that of its corresponding colinear isoform in pluripotent stem cells. We first performed qRT-PCR analysis to examine the expression levels of each type of isoform in multiple hESC lines (H1, H9, and NTU1) and iPSCs (iGra2, iCFB50, and iCD3). In pluripotent stem cells, the expression level of tsRMST was remarkably higher than RMST, whereas similar or lower expression levels were observed between the other three trans-spliced transcripts and their respective colinear counterparts (Supplemental Fig. 3). We then examined the expression profiles of these two types of isoforms by RT-PCR (Fig. 2C) and qRT-PCR (Supplemental Fig. 4) in ten human normal tissues. We found that although tsCSNK1G3, tsARHGAP5, and tsFAT1 were also expressed in somatic cells, they were expressed in fewer somatic cell types than their corresponding colinear isoforms among the ten tissues examined. These results suggest that the expression patterns of trans-spliced isoforms do not correlate exactly with those of their corresponding colinear isoforms, despite the latter being a source for the former. Intriguingly, although RMST was found to be broadly expressed in the ten tissues examined, expression of tsRMST was not detected in these tissues (Fig. 2C; Supplemental Fig. 4). As tsRMST is highly expressed in both hESCs and iPSCs and exhibits a step-down in expression after in vitro hESC differentiation, we hypothesize that tsRMST may be specifically expressed in pluripotent stem cells and may thus play a role in pluripotency maintenance.
Disruption of tsRMST expression impairs pluripotency maintenance
To explore the functional role of tsRMST in pluripotency maintenance of hESCs, we disrupted tsRMST expression using a small hairpin RNA (shRNA), shTS2, designed to target the chimeric junction site of tsRMST into hESCs (Supplemental Fig. 5). We first showed that alkaline phosphatase staining (Supplemental Material) was reduced in these hESCs as compared to hESCs transfected with control virus (shLuc) (Fig. 3A). Microarray-based global gene expression profiling further revealed that the expression levels of pluripotent genes, such as NANOG, POU5F1, SOX2, and TCF7L1, were significantly decreased in tsRMST knockdown hESCs, whereas key lineage-specific transcription factors, such as GATA6 (endoderm) and PAX6 (neuroectoderm), were increased (Fig. 3B). We reexamined mRNAs of hESCs at various time points after shTS2 transduction by qRT-PCR; this revealed that tsRMST knockdown did indeed result in a significant decrease in pluripotent gene expression (NANOG, POU5F1, SOX2, and TCF7L1) but an increase in the expression of mesodermal genes (T, MIXL1, and GSC), endodermal genes (GATA4, GATA6, SOX7 and SOX17), and neuroectoderm genes (PAX6 and SOX1) (Fig. 3C). To further validate the effect of tsRMST knockdown on pluripotency maintenance, we performed fluorescence activated cell sorting (FACS) and immunocytochemical (ICC) analyses (Supplemental Material), which revealed that the expression of the pluripotent markers NANOG and POU5F1 was significantly decreased by transfection of hESCs with shTS2 (Fig. 3D,E). By contrast, the numbers of T+ (mesoderm) and SOX17+ (endoderm) cells were increased by day 4 after transfection, and the number of PAX6+ (neuroectoderm) cells were increased by day 7 (Fig. 3E). To control for possible off-target effects, we proceeded to rescue shTS2 knockdown by expressing the tsRMST transcript in shTS2 virus-infected hESCs (shTS2-rescue) (Supplemental Fig. 5). We showed that the numbers of NANOG+ and POU5F1+ cells were significantly greater in shTS2-rescued hESCS than in knockdown cells, as revealed by FACS (Fig. 3F) and ICC analysis (Fig. 3G). Furthermore, expression of NANOG, POU5F1, TCF7L1, and SOX2 was remarkably increased in the shTS2-rescued hESCs, as shown by qRT-PCR (Fig. 3H). The shTS2-rescued hESCs also possessed the typical morphological traits of hESCs and stained strongly for alkaline phosphatase (Fig. 3I). These results thus demonstrate that tsRMST indeed plays a functional role in pluripotency maintenance in hESCs.
Figure 3.

Effect of tsRMST knockdown on pluripotency maintenance of hESCs. (A) Alkaline phosphatase staining and quantification of hESCs transfected with control (shLuc) or shTS2 virus at 4 and 7 d post-viral transduction. (Scale bar) 200 μm. (B) Heat map clustering analysis of genes related to pluripotency, neuroectoderm, mesoderm, and endoderm in shLuc- and shTS2-transduced hESCs. Relative fold changes are listed. Green and red values represent fold change for down- and up-regulation, respectively. (C) qRT-PCR analysis of RNA isolated from hESCs transfected with control or shTS2 virus at 4 and 7 d post-viral transduction, to detect pluripotency-related genes (NANOG, POU5F1, SOX2, TCF7L1), and lineage-specific genes, including mesodermal markers (T, GSC, MIXL1), endodermal markers (SOX17, GATA4, GATA6, SOX7), and neuroectodermal markers (PAX6, SOX1). (D) Fluorescence-activated cell sorting (FACS) analysis of NANOG+ and POU5F1+ cell populations in hESCs transfected with shLuc or shTS2 virus at 4 and 7 d post-viral transduction. Three independent transfections were performed to determine the mean. (E) Immunocytochemistry analysis and quantification of the expression of NANOG, POU5F1 (pluripotency markers), T (mesodermal marker), SOX17 (endodermal marker), and PAX6 (ectodermal marker) in shTS2-transduced hESCs at 4 and 7 d post-viral transduction. (Scale bar) 20 μm. (F) FACS analysis of NANOG+ and POU5F1+ cell populations in shTS2 virus-transfected hESCs and shTS2-rescue hESCs. Three independent transfections were performed to determine the mean. (G) Immunocytochemistry analysis and quantification of the expression of NANOG and POU5F1 (pluripotency markers) in shTS2 virus-transfected hESCs and shTS2-rescue hESCs. (Scale bar) 20 μm. (H) qRT-PCR analysis of pluripotency-related genes (POU5F1, NAONG, SOX2, TCF7L1) in RNA isolated from shTS2 virus-transfected and shTS2-rescue hESCs. (I) Alkaline phosphatase staining and quantification of shTS2 virus-transfected hESCs with or without tsRMST coexpression (shTS2-rescue). (Scale bar) 200 μm. All indicated P-values were estimated by the two-tailed two-sample t-test. Significance: (*) P < 0.05; (**) P < 0.01; and (***) P < 0.001.
The tsRMST transcript interacts with the pluripotency transcription factor NANOG and the PRC2 complex factor SUZ12
We further investigated the mechanism by which tsRMST regulates pluripotency maintenance. Relative tsRMST expression in the cytoplasm and nucleus of hESCs were examined by qRT-PCR. We found that tsRMST transcripts were highly enriched in the nuclei of hESCs (Fig. 4A), similar to lncRNA-ES1, another lincRNA previously reported in hESCs (Ng et al. 2012). As nuclear lincRNAs may act in cis to activate gene expression or in trans to suppress transcription (Guttman and Rinn 2012), the effects of tsRMST on expression of its neighboring genes were investigated (Fig. 4B). Knockdown of tsRMST did not affect expression of the genes and microRNAs located within a 1-MB range of tsRMST (which include NEDD1, MIR1251, and MIR135A2), suggesting that tsRMST does not act in cis to regulate expression of its neighbors (Fig. 4C). Next, we examined whether tsRMST controls pluripotency by acting in trans. As pluripotency-associated lincRNAs have been shown to bind pluripotency-related transcription factors and recruit the chromatin modifier (i.e., the PRC2 complex) to suppress target gene expression in hESCs (Ng et al. 2012), we investigated whether tsRMST controls hESC pluripotency and/or lineage differentiation through a similar mechanism. We performed RNA immunoprecipitation (RIP) assays (Supplemental Material), in which cross-linked RNA-protein complexes were immunoprecipitated with antibodies against SUZ12 (a component of the PRC2 complex) and three pluripotency-related transcription factors (POU5F1, NANOG, and SOX2). RIP enrichment (as measured by qRT-PCR) indicated that tsRMST interacts with SUZ12 and NANOG (Fig. 4D). By examining the ENCODE ChIP-seq data (The ENCODE Project Consortium 2012), we found that the number of genes occupied by both SUZ12 and NANOG in hESCs was significantly larger than expected (O/E ratio [observed-to-expected ratio] = 1.19, P-value < 10−15 by the χ2 test) (Fig. 5A). Ingenuity Pathway Analysis further revealed that the genes occupied by both NANOG and SUZ12 were significantly enriched in the two pathways: transcriptional regulatory network in ESCs and role of POU5F1 in mammalian ESC pluripotency (both P-values < 0.001) (Fig. 5B; Supplemental Table 1). These results thus suggest that tsRMST may control pluripotency via mediating the recruitment of the PRC2 complex (which mediates the H3K27me3 modification) to silence a specific set of NANOG-targeted genes in hESCs. Intriguingly, we found that the tsRMST repressed lineage-specific genes, GATA4, GATA6, and PAX6, (Fig. 3B,C), were also bound by both NANOG and SUZ12 (Supplemental Table 1). Thus, we proceeded to use ChIP-qPCR to confirm that tsRMST knockdown in hESCs reduced NANOG and SUZ12 occupancy and the H3K27me3 modification on the GATA4, GATA6, and PAX6 promoters (Fig. 5C–E). Together, these results indicate that tsRMST may contribute to pluripotency maintenance of hESCs by suppressing lineage-specific gene expression via the recruitment of NANOG and the PRC2 complex.
Figure 4.

Investigation of the mechanism by which tsRMST regulates pluripotency maintenance and early lineage differentiation. (A) The nuclear to cytoplasmic expression ratio of RMST, tsRMST, lncRNA-ES1, and GAPDH in hESCs. Error bars represent the mean values ± one standard deviation. (B) Neighboring genes (NEDD1) and miRNAs (MIR1251 and MIR135A2) of tsRMST within a 1-MB window on chromosome 12q based on the UCSC annotation. Arrowheads indicate the transcriptional orientations of genes or miRNAs. (C) qRT-PCR analysis of NEDD1, MIR1251, and MIR135A2 on hESCs transfected with control shLuc and shTS2 lentivirus. (D) RIP assays of tsRMST, RMST, and lncRNA-ES1 using antibodies against POU5F1, SOX2, NANOG, and the PRC2 component factor SUZ12 in hESCs. The RIP enrichments of tsRMST, RMST, and lncRNA-ES1 were measured by qRT-PCR, and each value was normalized to the level of background RIP detected for an isotype IgG. P-values were estimated by the two-tailed two-sample t-test. Significance: (*) P < 0.05; (**) P < 0.01; and (***) P < 0.001. (N.S.) Not significant.
Figure 5.

Knockdown of tsRMST in hESCs decreased the H3K27me modification on the promoters of NANOG and SUZ12 occupied genes. (A) Venn diagram and the observed-to-expected (O/E) ratio of genes bound by both NANOG and SUZ12. The total number of analyzed genes was 23,671. P-value was estimated by the χ2 test. The ChIP-seq data of NANOG and SUZ12 were generated by the ENCODE project (The ENCODE Project Consortium 2012) and downloaded from the UCSC Genome Browser at http://genome.ucsc.edu/. A NANOG-/SUZ12-occupied gene was defined by the binding of NANOG/SUZ12 to its promoter region, centered within 2000 bp of the transcription start site. (B) Top five canonical pathways for the genes bound by both NANOG and SUZ12, as determined by Ingenuity Pathway Analysis (IPA) (Supplemental Table 1). The ratios represent the number of genes bound by both NANOG and SUZ12 divided by the total number of genes within the corresponding pathway. (C–E) ChIP-qPCR analysis of the H3K27me3 modification and the occupancy of NANOG and SUZ12 on the promoters of three lineage-specific genes repressed by tsRMST. (C) GATA4 (chr8:11565365−11617509); (D) GATA6 (chr18:19749416−19782227); and (E) PAX6 (chr11:31806340−31832879). ENCODE ChIP-seq data of NANOG and SUZ12 occupancy and the H3K27me3 modification were aligned to the promoter regions of the lineage-specific genes, as indicated. The promoter regions were defined as −2 kb to +2 kb of the transcription start sites. For each figure, the y-axis of the upper panel represents the intensity of ChIP-seq reads. The highest NANOG binding peaks on the promoter regions of GATA4, GATA6, and PAX6 were highlighted with red bars (chr8:11567094–11567723 for GATA4, chr18:19747482–19747800 for GATA6, and chr11:31832538–31832842 for PAX6). ChIP fragments containing the selected NANOG binding peak (labeled as 0) or its four flanking regions (labeled as −1, −2, 1, and 2, which were located within −1 kb to +1 kb of the selected NANOG binding peak [highlighted with yellow bars]) in shLuc and shTS2 transduced hESCs were quantified by qPCR, and respectively normalized with the input genome used in ChIP. The same process was applied to SUZ12 and H3K27me3. The primers are listed in Supplemental Table 6.
Discussion
To the best of our knowledge, this is the first study to investigate trans-splicing in hESCs. The integrative transcriptome sequencing approach used was found to be a powerful approach for minimizing potential false positives while detecting trans-splicing. With the application of TSscan screening, we observed that only a small number of trans-splicing candidates were simultaneously supported by different NGS data sets; thus the events ultimately identified by TSscan only represent ∼0.1% (9/8,822) of the 454-nominated candidates generated (Fig. 1A). Three possible scenarios may account for this result: (1) There is considerable sequence diversity (or individual polymorphism) between H1 and H9 hESC lines; (2) trans-spliced RNAs tend to be expressed at a very low level in hESCs and are therefore not easily detected between multiple NGS data sets; or (3) most of the TSscan-excluded cases represent experimental artifacts. The first scenario is unlikely because if we consider the candidates inferred from the NGS of the same hESC line, <0.1% of the 454-nominated candidates were also supported by Illumina reads (20/2511 in S1) or SOLiD reads (4/6312 in S4) (see Fig. 1B). On the other hand, we found that a considerable number of candidates (681/8822) were supported by at least two 454-reads (31 were even supported by five or more reads), which were not detected by any Illumina/SOLiD reads. Of note, the Illumina/SOLiD platforms normally generate RNA-seq reads in much greater quantities than the 454 platform (Metzker 2010; see also Table 1). Thus, the second scenario is also unlikely because a considerable number of candidates were repeatedly detected by the 454 platform but not the Illumina/SOLiD platforms. The presence of experimental artifacts (i.e., the third scenario) is, therefore, the most likely explanation for these platform-dependent cases, consonant with earlier suggestions that experimental artifacts are the most critical issue in trans-splicing detection (McManus et al. 2010; Ozsolak and Milos 2011). This result also highlights the power of TSscan for removing experimental artifacts.
We also observed a considerable number of 454-nominated trans-splicing candidates involving sense–antisense (4034 cases; 47.1%) or mitochondrial-nuclear gene (2935 cases; 33.2%) fusions. Regarding the former, it has been shown that mRNA and cDNA can become “template partners” and form an artificial sense–antisense in vitro RNA fusion during RT-PCR (Houseley and Tollervey 2010). To examine this possibility, we took a closer look at the 454-nominated candidates with sense–antisense fusions (187 cases) (Supplemental Table 2), in which both the sense and antisense parts came from well-annotated transcripts, and included at least two exons with at least one well-annotated exon–intron boundary. We examined the exon–intron boundaries of these 187 fusion events and the corresponding splicing sites in the genomic sequences. Only three events were found to fulfill the criteria of canonical splicing signals (an example is illustrated in Supplemental Fig. 6A), whereas 143 events (76%) were found to represent apparent experimental artifacts of template switching, in which a spurious RNA contained the canonical splicing site, “GT-AG,” in one part of the fusion and a noncanonical splicing site such as “CA-TC” in the other part with the opposite strand (as illustrated in Supplemental Fig. 6B). However, the authenticity of even the sense–antisense RNA fusions (which fulfill the criteria of canonical splicing signals) remains questionable. The three extracted canonical sense–antisense fusions may still be false positives, because they are not supported by any short Illumina/SOLiD reads examined, and are 454-platform-dependent. These results reveal that most of the sense–antisense fusion candidates nominated by the NGS data are likely to be the result of in vitro artifacts.
It was also shown that mitochondrial-nuclear gene fusions may arise from spontaneous de novo transfer of mtDNAs into the nucleus; the resulting fusion sequences may then be transcribed as part of the transcriptome (Martin 2003). However, mitochondrial-nuclear fusion events that result from genetic arrangements would not occur post-transcriptionally (i.e., they are not trans-splicing events). When the 2935 mitochondrial-nuclear fusion events were further examined, only eight were found to be supported by both long and short NGS reads (i.e., four in S1 and four in S3) (see Supplemental Table 3). These results suggest that most of the 454-supported mitochondrial-nuclear events are experiment-dependent and likely to be experimental artifacts. Moreover, even the four mitochondrial-nuclear candidates supported by both long and short reads from H1 and H9 ESCs (belonging to S3) failed AMV-based RT-PCR validation (Supplemental Fig. 7). Therefore, we conclude that the observed mitochondrial-nuclear fusions are likely to be in vitro artifacts and thereby excluded by TSscan (Step 3) (Fig. 1A). These results are reminiscent of those of previous NGS-based studies, which regarded mitochondrial-nuclear fusions as false positives and directly excluded them when detecting gene fusions (Maher et al. 2009b; McManus et al. 2010).
Similar to an earlier report (McManus et al. 2010), we did not obtain credible evidence for the existence of intergenic trans-splicing events, although most of the 454-nominated candidates were intergenic (8003/8822) (see Supplemental Table 4). We compared the intergenic with the intragenic candidates (731 cases) (Supplemental Table 4) by the three in silico filters stated above (i.e., SHS-containing, sense-antisense fusion, and mtDNA-containing) (Fig. 1A). Of note, the candidates that were formed in an intra-chromosomal fashion and involved nongenic loci (88 cases) were not considered in the comparison. We found that intergenic candidates consist of a significantly higher percentage of SHS-containing candidates, sense–antisense fusion candidates, and mtDNA-containing candidates than the intragenic candidates (all P-values < 10−15 by the two-tailed Fisher's exact test) (Supplemental Table 4). In addition, chimeric RNA products with canonical splice sites and matching annotated exon boundaries are regarded as being less likely to be generated in vitro (Kim et al. 2010; Al-Balool et al. 2011). We found that the intragenic cases have a significantly higher percentage of candidates with canonical splice sites and matching annotated exon boundaries than the intergenic ones (P-value < 10−13) (Supplemental Table 4). These observations further suggest that most intergenic candidates arise from experimental artifacts rather than trans-splicing.
Several methods/pipelines have been developed to identify chimeric RNAs formed from cancer-related mutations, and these use RNA-seq data derived from a single NGS platform, e.g., TopHat-Fusion (Kim and Salzberg 2011), FusionSeq (Sboner et al. 2010), FusionHunter (Li et al. 2011), ChimeraScan (Iyer et al. 2011), FusionFinder (Francis et al. 2012), Bellerophontes (Abate et al. 2012), and SOAPfuse (Jia et al. 2013). These methods may also be used to detect trans-splicing candidates. However, although the use of a single NGS platform is more economical and practical, it was reported that sequencing with various platforms results in a very low level of overlap for chimeric RNAs (Maher et al. 2009a) and that almost no overlap was observed among different single-platform-based tools (Nacu et al. 2011; Abate et al. 2012; Carrara et al. 2013a,b), with the outcome that the majority of predicted chimeric RNAs are likely to be false positives. Integrating long- and short-read sequence data can overcome the limitations inherent in both systems (namely, the potential for false positives arising from lack of depth in long reads and the possibility of mapping errors in short reads) (Maher et al. 2009a); as such, we used such an integrative approach to investigate novel trans-splicing events. In addition, currently available methods for detecting chimeric RNAs are generally unable to distinguish trans-splicing events from genetic rearrangements. We thus emphasize the unique advantage of our pipeline, in that it simultaneously accounts for possible experimental artifacts and genetic rearrangements.
To confirm the trans-splicing candidates identified by TSscan, we performed multiple-step validations to rule out potential RTase-based artifacts (using comparisons of two different RTase products and a non-RTase-based validation [RPA]) in multiple hESC lines. There are four observations of note. First, RT-PCR assays using the same RTase for two independent cDNA preparations are not sufficient to exclude template switching events. Second, the number of supported RNA-seq reads cannot indicate whether a chimeric RNA product is an artifact, because certain chimeric RNA products that were unsupported by experimental validation had a greater number of supported RNA-seq reads than validated ones (Table 2). This is also consistent with the earlier observation that experimental artifacts can emerge repeatedly during reverse transcription (Houseley and Tollervey 2010; McManus et al. 2010). Third, the presence of canonical splicing signals does not guarantee that a trans-splicing candidate is genuine. For example, tsSOBP contains canonical splicing signals at its chimeric junction sites, but was not validated experimentally (Fig. 1D; Supplemental Fig. 2). The conclusions of earlier reports that did not detect template switching in trans-spliced RNA with canonical splicing signals at their chimeric junction sites (Cocquet et al. 2006; Al-Balool et al. 2011) thus need to be reevaluated. Finally, trans-splicing candidates nominated by different types of NGS data appear to include different proportions of in vitro artifacts. For example, SOLiD-supported candidates appear to be less likely to be experimental artifacts than Illumina-supported candidates (Table 1). A possible reason for this discrepancy is that these two NGS platforms use different approaches to prepare the transcriptome libraries (Supplemental Discussion), further suggesting that an integrative transcriptome sequencing approach is advantageous in detecting trans-splicing events. In addition, we found that the validated event supported by both types of NGS data (i.e., tsRMST) had similar read coverage levels using both the Illumina and SOLiD system (see Supplemental Table 5), also supporting the preceding hypothesis that read coverage level is not a reliable indicator of experimental artifact rates.
In this study, four trans-splicing events (tsCSNK1G3, tsARHGAP5, tsFAT1, and tsRMST) were identified and experimentally confirmed in hESCs. These events have not been previously identified in ESCs, and tsRMST is the first reported trans-spliced lincRNA. We have shown that these events are all highly expressed in human pluripotent stem cells (hESCs/iPSCs) (Figs. 1C–E, 2A) and differentially expressed during the pluripotent-to-differentiation transition (Fig. 2B), suggesting their potential biological significance in pluripotency and/or early lineage differentiation. By performing tsRMST knockdown and a series of careful experimental validations (including alkaline phosphatase staining, microarray analysis, qRT-PCR, FACS, ICC, and cDNA rescue) (Fig. 3), we further confirmed that tsRMST was significantly associated with the pluripotency maintenance of hESCs. We have provided evidence that tsRMST does not act in cis to regulate expression of its neighbors (Fig. 4C), but can interact with a key pluripotency transcription factor, NANOG, as well as the PRC2 component, SUZ12, to control pluripotency in trans through silencing NANOG target and/or lineage-specific genes in hESCs by recruiting the suppressive PRC2 complex (Fig. 4D). Indeed, analysis of ENCODE ChIP-seq data revealed that SUZ12 was enriched in the promoter region of NANOG-binding genes (Fig. 5A). ChIP-qPCR experiments on the promoters of the tsRMST repressed lineage-specific genes (GATA4, GATA6, and PAX6) further showed the loss of NANOG and SUZ12 occupancy and H3K27me3 modification in tsRMST knockdown hESCs (Fig. 5C–E). Accordingly, we propose a putative model in which tsRMST suppresses lineage differentiation in hESCs via the recruitment of NANOG and the PRC2 complex (Fig. 6). Our findings accord with a recent report that lincRNAs are important regulators of pluripotency (Ng et al. 2012), and as such, tsRMST may be a novel pluripotency-related lincRNA.
Figure 6.

A putative model for regulation of gene expression by tsRMST in pluripotent stem cells.
Recent reports have indicated that circular RNAs may be abundant for some human genes (Salzman et al. 2012; Jeck et al. 2013), and it was therefore possible that the identified trans-splicing events shared chimeric junction sites with circular RNAs. Our search of the literature suggests that these events have not been previously identified as circular RNAs. To experimentally examine if some or all of these events represented circular RNAs, we treated total RNA with RNase R, which degrades linear RNA alone (Supplemental Material). The qRT-PCR analysis showed that, for all four chimeric RNAs, the overwhelming majority of the transcripts were degraded by RNase R in multiple hESC lines (H1, H9, and NTU1) (Supplemental Fig. 8). We have thus demonstrated that the chimeric events identified by this study are indeed trans-spliced RNAs.
In conclusion, our results highlight the potential of integrative analysis of high-throughput transcriptome sequencing data derived from multiple platforms and cell lines to minimize potential false positives (particularly experimental artifacts) while identifying trans-spliced transcripts. Our findings also provide important insights into the role of trans-splicing in the pluripotency maintenance of hESCs and lineage differentiation. This study thus establishes a potentially valuable pipeline for comprehensive and rigorous characterization of trans-splicing, expanding the discovery of this important but understudied class of post-transcriptional events.
Methods
The TSscan pipeline
The TSscan pipeline is made up of four main steps (Fig. 1A). First, all 454-reads were aligned against the human reference genome (GRCh37) using BLAT with default parameters (Kent 2002). Each extracted chimeric alignment is composed of two topologically distinct mapped parts (or two tandem duplications), which may include an overlap (i.e., SHSs) or gap between the two parts. Both of the nonoverlapping regions of the mapped parts had to be > 50 bp with ≥ 95% sequence identity to the reference genome. A chimeric RNA candidate had to satisfy two criteria: In the BLAT result, the two mapped parts of a chimeric alignment had to cover the longest alignable length of the 454-read; and the sum of the alignable length of these two parts had to be ≥ 20 bases longer than any of possible colinear alignments. Subsequently, 8822 chimeric RNA candidates were extracted (Step 1) (Fig. 1A). In the second step, short RNA-seq reads (derived from the Illumina and SOLiD platforms) were aligned against each of the 8822 454-nominated candidates using BFAST with default parameters (Homer et al. 2009). The BFAST indices used were suggested by the original BFAST study (Homer et al. 2009) and downloaded from the BFAST page at http://sourceforge.net/projects/bfast/files/. Only the short reads that spanned the fusion boundary by >10 nucleotides with ≥95% sequence identity on each side of the nonoverlapping region were retained. Moreover, a matched short read was discarded if it satisfied any one of the following criteria: (1) It contained more than one mismatch; (2) it contained insertion(s)/deletion(s); or (3) it also mapped to the human genome or well-annotated transcripts (including the UCSC- and Ensembl-annotated transcripts). In the third step, trans-splicing candidates that met any one of the following in silico criteria were removed: (1) candidates with SHSs (or gaps) > 5 nucleotides spanning the fusion boundaries; (2) sense–antisense fusion candidates containing noncanonical splicing sites; and (3) candidates containing sequences from the mitochondrial genome. Finally, only the S2 and S3 candidates supported by both H9 and H1 hESC cell cultures were retained.
Data retrieval and availability
The human genomic sequences, hg19 (or GRCh37), were downloaded from the UCSC Genome Browser (http://genome.ucsc.edu/). The human annotated transcripts were downloaded from the UCSC Genome Browser (RefSeq) and the Ensembl Genome Browser (all cDNAs; release 59) (http://www.ensembl.org/). The H1 hESC transcriptome sequencing data, including long 454-reads and short Illumina reads, were downloaded from the Gene Expression Omnibus (GEO; http://www.ncbi.nlm.nih.gov/geo/) database (accession number GSE20301). The RNA-seq reads (including 454-, Illumina-, and SOLiD-reads) that supported the 8822 chimeric candidates identified are illustrated in Supplemental Table 5. The RT-PCR/qRT-PCR primers used in this study are listed in Supplemental Table 6.
Cell culture
Mouse embryonic fibroblasts (MEFs) were cultured in DMEM supplemented with 10% fetal bovine serum (FBS), 1× nonessential amino acids (NEAA, Invitrogen), 2 mM L-glutamine (Invitrogen), and 1× penicillin/streptomycin (Invitrogen). Human ESCs (H1/H9 [WiCell Bank] and NTU1) (Chen et al. 2007) and iPSCs were grown on MEF feeders (2 × 10⁴ cells/cm2) in DMEM/F12 media plus 20% Knockout Serum Replacement (Invitrogen) and 4 ng/mL bFGF (Sigma-Aldrich). Human fibroblasts and granulose and dermal papilla cells were cultured in media similar to the MEF media described above. For in vitro differentiation, ESC colonies were dispersed into small clumps using dispase (Sigma-Aldrich; 1 mg/mL for 30 min) and transferred onto ultra-low attachment plates (Corning) for embryoid body (EB) formation. The media was changed daily for 4 d using the same media as for routine hESC cultures. EBs were then transferred onto 0.1% gelatin-coated culture dishes with FBS-containing media for further differentiation. Media was changed every 2 d.
Transcriptome library preparation and 454 sequencing
Total RNA (10 μg) was extracted from hESC H9 using TRI Reagent (Ambion), and mRNA was purified using a Poly(A) Purist MAG kit (Ambion). One microgram of mRNA was used to synthesize first-strand cDNA using oligo-dT primers provided by the Creator SMART cDNA library Construction Kit (Clonetech). Double-stranded cDNA was then generated from a single-strand cDNA solution by PCR, using primers provided by the manufacturer. Double-stranded cDNA (5 μg) was fragmented by nebulization and used as templates for sequencing. DNA sequencing and data processing were performed by Mission Biotech using a Genome Sequencer GS FLX Titanium System (Roche).
Transcriptome library preparation and SOLiD sequencing
Total RNA (10 μg) was harvested from H9 hESCs using TRI reagent (Ambion) for cDNA library preparation. Enrichment of mRNA by depletion of ribosomal RNA was performed using a RiboMinus transcriptome isolation kit (Invitrogen). RiboMinus RNA (1 μg) was then fragmented using RNase III for 10 min and cleaned up using a RiboMinus concentration module (Invitrogen). Fragmented RNA was ligated with SOLiD adaptor A and reverse transcribed using ArrayScript RT. Products were purified using a MinElute PCR purification kit (Qiagen) and size-selected on a 6% TBE-urea gel. A cDNA library of an appropriate size was amplified using a SOLiD PCR kit. To prepare the sequencing template, the size selected cDNA library was coupled with SOLiD P1 DNA beads, and mixed with an emulsion PCR mixture using a ULTRA-TURRAX tube drive (IKA). Emulsion PCR was performed using a GeneAmp PCR system 9700 according to the manufacturer's program. Templates on SOLiD P1 DNA beads amplified by emulsion PCR were washed, denatured, and enriched using SOLiD P2 bead incubation steps. The enriched templates were then modified at the 3′ end with bead linkers by a terminal transferase reaction and washed and deposited onto SOLiD slides. Sequencing of templates was performed using a SOLiD 3 system and processed with the SOLiD analysis tool pipeline.
RNA isolation, RT-PCR, and qRT-PCR
Total RNA isolated using TRI Reagent (Applied Biosystems) was treated with DNase I (NEB) to remove genomic DNA contamination and then reverse transcribed using an AMV-derived transcriptase (if not otherwise specified) to generate a cDNA library. All RT-PCR products were amplified under 35 cycles using GoTag MasterMix (Promega), and qRT-PCR assays were performed using the KAPA SYBR fast kit (KAPA Biosystems). All primers used are listed in Supplemental Table 6. All qRT-PCR reactions were performed in triplicate.
Microarray analysis
Total RNA (10 μg) purified by TRI reagent (Applied Biosystems) was used to generate biotin-labeled cRNA probes, which were then hybridized to an Affymetrix Human Genome Plus 2.0 Array (Affymetrix). Probe signal intensities were detected using an Affymetrix GeneChip Scanner 7G and analyzed using GeneSpring XI software (Agilent). Pearson centered complete clustering was applied to genes with a fold-change > 2±1.5 and a P-value < 0.05.
Lentivirus-mediated gene expression and short hairpin RNA knockdown
The tsRMST transcript was cloned from the hESC H9 cDNA library and subcloned into lentiviral plasmid FUW with restriction enzymes EcoRI and XbaI. The lentiviral plasmid pLKO_1 (U6p-shRNA) was obtained from the National RNAi Core Facility (Taipei, Taiwan) and construction of a tsRMST-targeted shRNA was performed according to a protocol provided by the same facility. Targeting sequences are listed in Supplemental Table 6.
Data access
The H9 hESC transcriptome sequencing data (including long 454-reads and short SOLiD reads) and microarray data generated in the present study have been submitted to the NCBI Gene Expression Omnibus (GEO; http://www.ncbi.nlm.nih.gov/geo/) under accession numbers GSE30557 and GSE32503, respectively. The related in-house programs and document are publicly accessible from our website (http://idv.sinica.edu.tw/trees/TSscan/TSscan.html) or github (https://github.com/TreesLab/TSscan).
Acknowledgments
This work was supported by the Genomics Research Center and Institute of Cellular and Organismic Biology, Academia Sinica, Taiwan, and the National Science Council, Taiwan, under contracts NSC99-2628-B-001-008-MY3 (to T.J.C.) and NSC99-3111-B-001-001 (to H.C.K.). The financial support from the Academia Sinica Research Award for Junior Research Investigators and the Wu Ta-Yuo Memorial Award is also gratefully acknowledged. We thank Li-Yuan Hung and Yen-Zho Chen for programming assistance, Ping-Hung Hsieh and Yung-Chieh Chan for experimental assistance, and Drs. Chung-Hsuan Chen, King-Song Jeng, and Tien-Hsien Chang for helpful comments.
Footnotes
[Supplemental material is available for this article.]
Article published online before print. Article, supplemental material, and publication date are at http://www.genome.org/cgi/doi/10.1101/gr.159483.113.
Freely available online through the Genome Research Open Access option.
References
- Abate F, Acquaviva A, Paciello G, Foti C, Ficarra E, Ferrarini A, Delledonne M, Iacobucci I, Soverini S, Martinelli G, et al. 2012. Bellerophontes: An RNA-Seq data analysis framework for chimeric transcripts discovery based on accurate fusion model. Bioinformatics 28: 2114–2121 [DOI] [PubMed] [Google Scholar]
- Al-Balool HH, Weber D, Liu Y, Wade M, Guleria K, Nam PL, Clayton J, Rowe W, Coxhead J, Irving J, et al. 2011. Post-transcriptional exon shuffling events in humans can be evolutionarily conserved and abundant. Genome Res 21: 1788–1799 [DOI] [PMC free article] [PubMed] [Google Scholar]
- Ben-Dov C, Hartmann B, Lundgren J, Valcarcel J 2008. Genome-wide analysis of alternative pre-mRNA splicing. J Biol Chem 283: 1229–1233 [DOI] [PubMed] [Google Scholar]
- Black DL, Grabowski PJ 2003. Alternative pre-mRNA splicing and neuronal function. Prog Mol Subcell Biol 31: 187–216 [DOI] [PubMed] [Google Scholar]
- Blencowe BJ 2006. Alternative splicing: New insights from global analyses. Cell 126: 37–47 [DOI] [PubMed] [Google Scholar]
- Bracco L, Kearsey J 2003. The relevance of alternative RNA splicing to pharmacogenomics. Trends Biotechnol 21: 346–353 [DOI] [PubMed] [Google Scholar]
- Carrara M, Beccuti M, Cavallo F, Donatelli S, Lazzarato F, Cordero F, Calogero RA 2013a. State of art fusion-finder algorithms are suitable to detect transcription-induced chimeras in normal tissues? BMC Bioinformatics 14: S2. [DOI] [PMC free article] [PubMed] [Google Scholar]
- Carrara M, Beccuti M, Lazzarato F, Cavallo F, Cordero F, Donatelli S, Calogero RA 2013b. State-of-the-art fusion-finder algorithms sensitivity and specificity. BioMed Res Int 2013: 340620. [DOI] [PMC free article] [PubMed] [Google Scholar]
- Chan AS, Thorner PS, Squire JA, Zielenska M 2002. Identification of a novel gene NCRMS on chromosome 12q21 with differential expression between Rhabdomyosarcoma subtypes. Oncogene 21: 3029–3037 [DOI] [PubMed] [Google Scholar]
- Chen FC, Chen CJ, Ho JY, Chuang TJ 2006. Identification and evolutionary analysis of novel exons and alternative splicing events using cross-species EST-to-genome comparisons in human, mouse and rat. BMC Bioinformatics 7: 136. [DOI] [PMC free article] [PubMed] [Google Scholar]
- Chen HF, Kuo HC, Chien CL, Shun CT, Yao YL, Ip PL, Chuang CY, Wang CC, Yang YS, Ho HN 2007. Derivation, characterization and differentiation of human embryonic stem cells: Comparing serum-containing versus serum-free media and evidence of germ cell differentiation. Hum Reprod 22: 567–577 [DOI] [PubMed] [Google Scholar]
- Cocquet J, Chong A, Zhang G, Veitia RA 2006. Reverse transcriptase template switching and false alternative transcripts. Genomics 88: 127–131 [DOI] [PubMed] [Google Scholar]
- Djebali S, Lagarde J, Kapranov P, Lacroix V, Borel C, Mudge JM, Howald C, Foissac S, Ucla C, Chrast J, et al. 2012. Evidence for transcript networks composed of chimeric RNAs in human cells. PLoS ONE 7: e28213. [DOI] [PMC free article] [PubMed] [Google Scholar]
- Dorn R, Krauss V 2003. The modifier of mdg4 locus in Drosophila: Functional complexity is resolved by trans splicing. Genetica 117: 165–177 [DOI] [PubMed] [Google Scholar]
- The ENCODE Project Consortium 2012. An integrated encyclopedia of DNA elements in the human genome. Nature 489: 57–74 [DOI] [PMC free article] [PubMed] [Google Scholar]
- Fang W, Wei Y, Kang Y, Landweber LF 2012. Detection of a common chimeric transcript between human chromosomes 7 and 16. Biol Direct 7: 49. [DOI] [PMC free article] [PubMed] [Google Scholar]
- Francis RW, Thompson-Wicking K, Carter KW, Anderson D, Kees UR, Beesley AH 2012. FusionFinder: A software tool to identify expressed gene fusion candidates from RNA-Seq data. PLoS ONE 7: e39987. [DOI] [PMC free article] [PubMed] [Google Scholar]
- Frenkel-Morgenstern M, Gorohovski A, Lacroix V, Rogers M, Ibanez K, Boullosa C, Andres Leon E, Ben-Hur A, Valencia A 2012. ChiTaRS: A database of human, mouse and fruit fly chimeric transcripts and RNA-sequencing data. Nucleic Acids Res 41: D142–D151 [DOI] [PMC free article] [PubMed] [Google Scholar]
- Gingeras TR 2009. Implications of chimaeric non-co-linear transcripts. Nature 461: 206–211 [DOI] [PMC free article] [PubMed] [Google Scholar]
- Goeke S, Greene EA, Grant PK, Gates MA, Crowner D, Aigaki T, Giniger E 2003. Alternative splicing of lola generates 19 transcription factors controlling axon guidance in Drosophila. Nat Neurosci 6: 917–924 [DOI] [PubMed] [Google Scholar]
- Graveley BR 2001. Alternative splicing: Increasing diversity in the proteomic world. Trends Genet 17: 100–107 [DOI] [PubMed] [Google Scholar]
- Guttman M, Rinn JL 2012. Modular regulatory principles of large non-coding RNAs. Nature 482: 339–346 [DOI] [PMC free article] [PubMed] [Google Scholar]
- Hastings KE 2005. SL trans-splicing: Easy come or easy go? Trends Genet 21: 240–247 [DOI] [PubMed] [Google Scholar]
- Herai RH, Yamagishi ME 2010. Detection of human interchromosomal trans-splicing in sequence databanks. Brief Bioinform 11: 198–209 [DOI] [PubMed] [Google Scholar]
- Homer N, Merriman B, Nelson SF 2009. BFAST: An alignment tool for large scale genome resequencing. PLoS ONE 4: e7767. [DOI] [PMC free article] [PubMed] [Google Scholar]
- Horiuchi T, Aigaki T 2006. Alternative trans-splicing: A novel mode of pre-mRNA processing. Biol Cell 98: 135–140 [DOI] [PubMed] [Google Scholar]
- Houseley J, Tollervey D 2010. Apparent non-canonical trans-splicing is generated by reverse transcriptase in vitro. PLoS ONE 5: e12271. [DOI] [PMC free article] [PubMed] [Google Scholar]
- Hsu MT, Coca-Prados M 1979. Electron microscopic evidence for the circular form of RNA in the cytoplasm of eukaryotic cells. Nature 280: 339–340 [DOI] [PubMed] [Google Scholar]
- Huang YT, Chen FC, Chen CJ, Chen HL, Chuang TJ 2008. Identification and analysis of ancestral hominoid transcriptome inferred from cross-species transcript and processed pseudogene comparisons. Genome Res 18: 1163–1170 [DOI] [PMC free article] [PubMed] [Google Scholar]
- Huang HP, Yu CY, Chen HF, Chen PH, Chuang CY, Lin SJ, Huang ST, Chan WH, Ueng TH, Ho HN, et al. 2010. Factors from human embryonic stem cell-derived fibroblast-like cells promote topology-dependent hepatic differentiation in primate embryonic and induced pluripotent stem cells. J Biol Chem 285: 33510–33519 [DOI] [PMC free article] [PubMed] [Google Scholar]
- Iyer MK, Chinnaiyan AM, Maher CA 2011. ChimeraScan: A tool for identifying chimeric transcription in sequencing data. Bioinformatics 27: 2903–2904 [DOI] [PMC free article] [PubMed] [Google Scholar]
- Jeck WR, Sorrentino JA, Wang K, Slevin MK, Burd CE, Liu J, Marzluff WF, Sharpless NE 2013. Circular RNAs are abundant, conserved, and associated with ALU repeats. RNA 19: 141–157 [DOI] [PMC free article] [PubMed] [Google Scholar]
- Jia W, Qiu K, He M, Song P, Zhou Q, Zhou F, Yu Y, Zhu D, Nickerson ML, Wan S, et al. 2013. SOAPfuse: An algorithm for identifying fusion transcripts from paired-end RNA-Seq data. Genome Biol 14: R12. [DOI] [PMC free article] [PubMed] [Google Scholar]
- Jin L, Kryukov K, Clemente JC, Komiyama T, Suzuki Y, Imanishi T, Ikeo K, Gojobori T 2008. The evolutionary relationship between gene duplication and alternative splicing. Gene 427: 19–31 [DOI] [PubMed] [Google Scholar]
- Kent WJ 2002. BLAT—the BLAST-like alignment tool. Genome Res 12: 656–664 [DOI] [PMC free article] [PubMed] [Google Scholar]
- Kim D, Salzberg SL 2011. TopHat-Fusion: An algorithm for discovery of novel fusion transcripts. Genome Biol 12: R72. [DOI] [PMC free article] [PubMed] [Google Scholar]
- Kim P, Yoon S, Kim N, Lee S, Ko M, Lee H, Kang H, Kim J 2010. ChimerDB 2.0–a knowledgebase for fusion genes updated. Nucleic Acids Res 38: D81–D85 [DOI] [PMC free article] [PubMed] [Google Scholar]
- Kong L, Zhang Y, Ye ZQ, Liu XQ, Zhao SQ, Wei L, Gao G 2007. CPC: Assess the protein-coding potential of transcripts using sequence features and support vector machine. Nucleic Acids Res 35: W345–W349 [DOI] [PMC free article] [PubMed] [Google Scholar]
- Krause M, Hirsh D 1987. A trans-spliced leader sequence on actin mRNA in C. elegans. Cell 49: 753–761 [DOI] [PMC free article] [PubMed] [Google Scholar]
- Lasda EL, Blumenthal T 2011. Trans-splicing. Wiley Interdiscip Rev RNA 2: 417–434 [DOI] [PubMed] [Google Scholar]
- Li H, Wang J, Mor G, Sklar J 2008. A neoplastic gene fusion mimics trans-splicing of RNAs in normal human cells. Science 321: 5. [DOI] [PubMed] [Google Scholar]
- Li X, Zhao L, Jiang H, Wang W 2009. Short homologous sequences are strongly associated with the generation of chimeric RNAs in eukaryotes. J Mol Evol 68: 56–65 [DOI] [PubMed] [Google Scholar]
- Li Y, Chien J, Smith DI, Ma J 2011. FusionHunter: Identifying fusion transcripts in cancer using paired-end RNA-seq. Bioinformatics 27: 1708–1710 [DOI] [PubMed] [Google Scholar]
- Maher CA, Kumar-Sinha C, Cao X, Kalyana-Sundaram S, Han B, Jing X, Sam L, Barrette T, Palanisamy N, Chinnaiyan AM 2009a. Transcriptome sequencing to detect gene fusions in cancer. Nature 458: 97–101 [DOI] [PMC free article] [PubMed] [Google Scholar]
- Maher CA, Palanisamy N, Brenner JC, Cao X, Kalyana-Sundaram S, Luo S, Khrebtukova I, Barrette TR, Grasso C, Yu J, et al. 2009b. Chimeric transcript discovery by paired-end transcriptome sequencing. Proc Natl Acad Sci 106: 12353–12358 [DOI] [PMC free article] [PubMed] [Google Scholar]
- Maniatis T, Tasic B 2002. Alternative pre-mRNA splicing and proteome expansion in metazoans. Nature 418: 236–243 [DOI] [PubMed] [Google Scholar]
- Martin W 2003. Gene transfer from organelles to the nucleus: Frequent and in big chunks. Proc Natl Acad Sci 100: 8612–8614 [DOI] [PMC free article] [PubMed] [Google Scholar]
- McManus CJ, Duff MO, Eipper-Mains J, Graveley BR 2010. Global analysis of trans-splicing in Drosophila. Proc Natl Acad Sci 107: 12975–12979 [DOI] [PMC free article] [PubMed] [Google Scholar]
- Metzker ML 2010. Sequencing technologies – the next generation. Nat Rev Genet 11: 31–46 [DOI] [PubMed] [Google Scholar]
- Mudge JM, Frankish A, Fernandez-Banet J, Alioto T, Derrien T, Howald C, Reymond A, Guigó R, Hubbard T, Harrow J 2011. The origins, evolution and functional potential of alternative splicing in vertebrates. Mol Biol Evol 28: 2949–2959 [DOI] [PMC free article] [PubMed] [Google Scholar]
- Nacu S, Yuan W, Kan Z, Bhatt D, Rivers CS, Stinson J, Peters BA, Modrusan Z, Jung K, Seshagiri S, et al. 2011. Deep RNA sequencing analysis of readthrough gene fusions in human prostate adenocarcinoma and reference samples. BMC Med Genomics 4: 11. [DOI] [PMC free article] [PubMed] [Google Scholar]
- Ng SY, Johnson R, Stanton LW 2012. Human long non-coding RNAs promote pluripotency and neuronal differentiation by association with chromatin modifiers and transcription factors. EMBO J 31: 522–533 [DOI] [PMC free article] [PubMed] [Google Scholar]
- Nigro JM, Cho KR, Fearon ER, Kern SE, Ruppert JM, Oliner JD, Kinzler KW, Vogelstein B 1991. Scrambled exons. Cell 64: 607–613 [DOI] [PubMed] [Google Scholar]
- Nilsen TW 2001. Evolutionary origin of SL-addition trans-splicing: Still an enigma. Trends Genet 17: 678–680 [DOI] [PubMed] [Google Scholar]
- Ouhammouch M, Brody EN 1992. Temperature-dependent template switching during in vitro cDNA synthesis by the AMV-reverse transcriptase. Nucleic Acids Res 20: 5443–5450 [DOI] [PMC free article] [PubMed] [Google Scholar]
- Ozsolak F, Milos PM 2011. RNA sequencing: Advances, challenges and opportunities. Nat Rev Genet 12: 87–98 [DOI] [PMC free article] [PubMed] [Google Scholar]
- Rickman DS, Pflueger D, Moss B, VanDoren VE, Chen CX, de la Taille A, Kuefer R, Tewari AK, Setlur SR, Demichelis F, et al. 2009. SLC45A3-ELK4 is a novel and frequent erythroblast transformation-specific fusion transcript in prostate cancer. Cancer Res 69: 2734–2738 [DOI] [PMC free article] [PubMed] [Google Scholar]
- Salzman J, Gawad C, Wang PL, Lacayo N, Brown PO 2012. Circular RNAs are the predominant transcript isoform from hundreds of human genes in diverse cell types. PLoS ONE 7: e30733. [DOI] [PMC free article] [PubMed] [Google Scholar]
- Sboner A, Habegger L, Pflueger D, Terry S, Chen DZ, Rozowsky JS, Tewari AK, Kitabayashi N, Moss BJ, Chee MS, et al. 2010. FusionSeq: A modular framework for finding gene fusions by analyzing paired-end RNA-sequencing data. Genome Biol 11: R104. [DOI] [PMC free article] [PubMed] [Google Scholar]
- Schoenfelder S, Clay I, Fraser P 2010. The transcriptional interactome: Gene expression in 3D. Curr Opin Genet Dev 20: 127–133 [DOI] [PubMed] [Google Scholar]
- Shao X, Shepelev V, Fedorov A 2006. Bioinformatic analysis of exon repetition, exon scrambling and trans-splicing in humans. Bioinformatics 22: 692–698 [DOI] [PubMed] [Google Scholar]
- Sutton RE, Boothroyd JC 1986. Evidence for trans splicing in trypanosomes. Cell 47: 527–535 [DOI] [PMC free article] [PubMed] [Google Scholar]
- Wu JQ, Habegger L, Noisa P, Szekely A, Qiu C, Hutchison S, Raha D, Egholm M, Lin H, Weissman S, et al. 2010. Dynamic transcriptomes during neural differentiation of human embryonic stem cells revealed by short, long, and paired-end sequencing. Proc Natl Acad Sci 107: 5254–5259 [DOI] [PMC free article] [PubMed] [Google Scholar]
- Zhang G, Guo G, Hu X, Zhang Y, Li Q, Li R, Zhuang R, Lu Z, He Z, Fang X, et al. 2010. Deep RNA sequencing at single base-pair resolution reveals high complexity of the rice transcriptome. Genome Res 20: 646–654 [DOI] [PMC free article] [PubMed] [Google Scholar]