

Abstract
Background
Screening cardiovascular disease (CVD) risk is an important part of CVD prevention. The success of screening is dependent on the rigour with which treatments are subsequently prescribed.
Aim
To establish the extent to which treatment conforms to guidelines.
Design and setting
Cross-sectional study of anonymised patient records from 19 general practices in the UK.
Method
Data relating to patient characteristics, including CVD risk factors, risk score and prescribed medication were extracted. CVD risk (thus eligibility for cholesterol and blood pressure-lowering treatment) was calculated using the Framingham equation. Guideline adherence was defined with descriptive statistics and comparisons by age, sex and disease were made using χ2 tests.
Results
Of the 34 975 patients (aged 40–74 years) included in this study, 2550 (7%) patients had existing CVD and 12 349 (35%) had a calculable CVD risk or were on treatment. CVD risk was formally assessed in 8390 (24%) patients. Approximately 7929 (64%) patients eligible for primary prevention therapy were being treated appropriately for their CVD risk. Guideline adherence was higher in younger patients (6284 [69%] aged 40–64 years versus 1645 [50%] aged 65–74 years, P<0.001) and in females (4334 [69%] females versus 3595 [59%] males, P<0.001). There was no difference in guideline adherence between patients where CVD risk had been recorded and those where CVD was calculable. Guideline adherence in patients with existing CVD was highest in patients with ischaemic heart disease (866 [ischaemic heart disease], 52%, versus 288 [stroke], 46%, versus 276 [other CVD], 39%; P<0.001).
Conclusion
There is scope for improvement in assessment and treatment for prevention of CVD in clinical practice. Increasing the uptake of evidence-based treatments would improve the cost-effectiveness of CVD risk screening programmes.
Keywords: antihypertensive agents, primary health care, primary prevention, risk, secondary prevention, statins
INTRODUCTION
Cardiovascular disease (CVD) is a leading cause of mortality and accounts for more than one-fifth of all deaths worldwide.1 Blood pressure, smoking status, and serum cholesterol concentration are the most important modifiable risk factors for CVD, and more deaths are attributable to these than any other major disease risk factors.2 Accordingly, national and international guidelines on the management of CVD now include significant promotion of CVD prevention through pharmacological control of blood pressure and lipid levels plus encouragement of behavioural change and lifestyle modification.3–9
Despite these guidelines, previous studies have identified under-treatment of patients for CVD prevention in specific at-risk groups. 10–15 In the UK, an attempt has been made to address missed opportunities in CVD prevention by introducing a programme of ‘vascular health checks’ for all patients aged 40–74 years with no previous history of CVD.16,17 A recent Cochrane review of general health checks suggested that there is no existing evidence to support their implementation or indicate that such a programme might be effective at reducing cardiovascular morbidity or total mortality.18,19 However, the applicability of these findings to current practice in general is limited because no contemporary studies examining health checks in combination with present-day CVD prevention interventions were available and, indeed, the vascular check programme was instigated following a modelling exercise that suggested benefit with screening and treatment.20 This limitation highlights how the impact of health check and/or screening programmes is dependent on the rigour with which preventive treatments are used in patients identified as being at risk. The study therefore examined a contemporary primary care dataset to explore the extent to which current pharmacotherapy practice conforms to national clinical guidelines for primary and secondary prevention in the UK. Although the study acknowledges the importance of lifestyle modification in prevention of CVD, it examined drug treatment as a measure of guideline adherence.
METHOD
Data collection
A cross-sectional retrospective study of primary care medical records was conducted. Anonymised data were obtained from the electronic health records of all patients aged between 40 and 74 years registered at 19 general practices across the West Midlands area of the UK. The practices were purposefully selected from a sample of 973 within the West Midlands Strategic Health Authority and represented the local variation in practice sizes and levels of socioeconomic deprivation (estimated using the Indices of Multiple Deprivation score for each practice area). Relevant data were extracted using MIQUEST software developed by NHS Connecting for Health, Crown Copyright, London, UK.
How this fits in
Pharmacotherapy for blood pressure and cholesterol lowering is highly effective at reducing cardiovascular risk, and evidence-based guidelines recommend use of these drugs in people at high risk of cardiovascular events. Underuse of cardiovascular disease prevention medication is common in healthcare systems across Europe and North America. This study demonstrates that in the UK, 36–53% of patients with known or calculable cardiovascular disease risk are not being treated according to national guidelines. The cost-effectiveness of vascular health checks would be improved if uptake of evidence-based treatments was increased.
All data queries were run between 17 October 2008 and 6 October 2009. Extracted data included demographic information, cardiovascular risk factor details, records of formal cardiovascular risk assessment, and prescribed medication (blood pressure or cholesterol-lowering therapy). The presence of cardiovascular risk factor details were defined as the most recent value for blood pressure/cholesterol in the 5 years prior to the query date recorded in a value field alongside a read code for blood pressure or cholesterol. Both total and high-density lipoprotein serum cholesterol concentrations were extracted. All cholesterol and blood pressure-lowering medication prescribed within the 90 days prior to the query date were extracted.
Definition of cardiovascular risk status
All patients with existing CVD (myocardial infarction, peripheral vascular disease, heart failure, ischaemic heart disease [IHD], stroke, and transient ischaemic attack [TIA]) were identified and considered to be at high risk of a secondary cardiovascular event.
Where patients had recorded risk factor information, CVD risk was estimated using the Framingham equation, which uses age, sex, blood pressure, total/high-density lipoprotein cholesterol ratio, smoking status, and existence of diabetes and/or left ventricular hypertrophy to estimate a patient’s 10-year risk of developing a future cardiovascular event.21 This risk calculator was recommended by the National Institute for Health and Care Excellence (NICE) at the time of data collection,22 although it is now recognised that other risk calculators such as QRISK223 may be more appropriate for use in UK populations.4 In accordance with NICE guidelines of the time, CVD risk scores were adjusted by a factor of 1.4 or 1.5, respectively, for patients of South Asian origin or with a family history of premature cardiovascular events.22
The present analysis focused on patients on treatment or with sufficient information in their medical records to calculate a CVD risk score using the Framingham equation.21 This enabled identification of all possible missed opportunities in CVD prevention, rather than just those where the GP had assessed risk by performing a formal CVD risk assessment. To establish if there were any differences between patients with a recorded risk score and those with a calculable risk score, a sensitivity analysis was conducted to compare guideline adherence in both populations.
Where cardiovascular risk could not be calculated from existing risk factor information, individuals were classified as having unknown CVD risk, unless they were already receiving some form of prevention therapy, in which case they were assumed to have been identified as being at high risk previously. No attempt was made to impute missing data.
Definition of eligibility for and receipt of appropriate treatment
Patients on treatment or with a calculable CVD risk but without existing CVD were considered eligible for primary prevention therapy. Optimal treatment was defined in accordance with NICE guidelines and is summarised in Table 1. All patients with existing CVD were considered to be eligible for secondary preventive treatment. NICE guidelines3–4 recommend that these patients receive statin therapy and have blood pressure controlled to a target of 140/90mmHg (Table 1). It is acknowledged that some patients may have declined treatment, been contraindicated for therapy or have stopped taking medication having been prescribed it in the past. It is also possible that in some cases, the GP may have chosen to recommend lifestyle modification rather than pharmacotherapy. While these scenarios do not equate to ‘non-guideline adherence’, it was not possible to separate these in the analysis from those for whom risk had been identified but not appropriately addressed.
Table 1.
Summary of possible treatment strategies and how they relate to current NICE guidelines
| Population | Treatment | Blood pressure control mmHg | 10-year CVD riska | Treated in accordance with guidelines? | Why? |
|---|---|---|---|---|---|
| Primary prevention | On statin | >140/90 | >20% risk | No | Should be on an antihypertensive |
| <20% risk | No | Should be on an antihypertensive | |||
| Risk not recorded | No | Should be on an antihypertensive | |||
|
| |||||
| <140/90 | >20% risk | Yes | BP below threshold for treatment and on a statin for high risk | ||
| <20% risk | Yes | BP below threshold for treatment and on a statin (assumed have been at high risk previously) | |||
| Risk not recorded | Yes | BP below threshold for treatment and on a statin (assumed have been at high risk previously) | |||
|
| |||||
| On antihypertensive | >140/90 | >20% risk | No | Should be on a statin and an additional antihypertensive | |
| <20% risk | No | Should be on an additional antihypertensive | |||
| Risk not recorded | No | Should be on an additional antihypertensive and assessed for risk | |||
|
| |||||
| <140/90 | >20% risk | No | Should be on a statin | ||
| <20% risk | Not clear | Low risk could be due to the use of treated BP in risk calculation | |||
| Risk not recorded | Not clear | Should have risk assessed | |||
|
| |||||
| On both statin and antihypertensive | >140/90 | >20% risk | No | Should be on an additional antihypertensive | |
| <20% risk | No | Should be on an additional antihypertensive | |||
| Risk not recorded | No | Should be on an additional antihypertensive | |||
|
| |||||
| <140/90 | >20% risk | Yes | BP controlled and on a statin for high risk | ||
| <20% risk | Yes | BP controlled and on a statin (must have been at high risk previously) | |||
| Risk not recorded | Yes | BP controlled and on a statin (must have been at high risk previously) | |||
|
| |||||
| Neither statin nor antihypertensive | >140/90 | >20% risk | No | Should be on a statin and an antihypertensive | |
| >160/100 | <20% risk | No | Should be on an antihypertensive | ||
| <140/90 | >20% risk | No | Should be on a statin | ||
| <160/100 | <20% risk | Yes | BP below threshold for treatment and low risk so statin not indicated | ||
|
| |||||
| Secondary prevention | On statin | >140/90 | >20% risk | No | Should be on an antihypertensive |
|
| |||||
| <140/90 | >20% risk | Yes | BP controlled and on a statin for high risk | ||
|
| |||||
| On antihypertensive | >140/90 | >20% risk | No | Should be on a statin and additional antihypertensive | |
|
| |||||
| <140/90 | >20% risk | No | Should be on a statin | ||
|
| |||||
| On both statin and antihypertensive | >140/90 | >20% risk | No | Should be on an additional antihypertensive | |
|
| |||||
| <140/90 | >20% risk | Yes | BP controlled and on a statin for high risk | ||
|
| |||||
| Neither statin nor antihypertensive | >140/90 | >20% risk | No | Should be on a statin and an antihypertensive | |
|
| |||||
| <140/90 | >20% risk | No | Should be on a statin | ||
BP = blood pressure.
Risk defined as a 10-year Framingham risk score (high risk >20%),21 as calculated by the authors from available risk factor information in patient medical records.
Analysis
Descriptive statistics were used to define the proportion of patients within each risk group who were being treated in accordance with NICE guidelines. χ2 tests were used to compare adherence to guidelines by age, sex, disease, and in patients with recorded or calculable risk scores. All data are presented as means ± standard deviation and proportions of the total, primary or secondary prevention populations (unless otherwise stated). All analyses were carried out using SPSS software (version 21).
RESULTS
Population characteristics
Of the 90 516 patients registered at participating practices, 34 975 patients were aged 40–74 years and were included in this analysis. CVD risk was known or calculable in 43% (14 899 patients): 12 349 (35%) patients had a calculable risk or were on treatment (primary prevention population), 2550 (7%) patients had existing CVD (secondary prevention population), and 20 076 (57%) patients had an unknown risk of CVD and therefore would be eligible for vascular screening (Figure 1). Cardiovascular risk factor and disease status in the total, primary, and secondary prevention populations are shown in Table 2. A formal cardiovascular risk assessment had been conducted and recorded in the medical notes of 8390 (24%) patients within the preceding 5 years.
Figure 1.
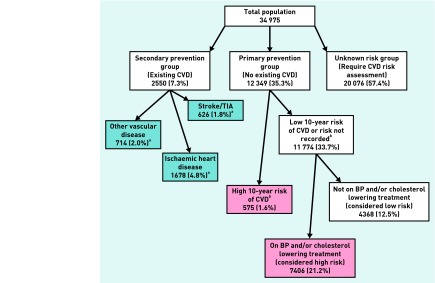
Treatment and risk stratification for primary and secondary prevention of cardiovascular disease (CVD) in a typical primary care population aged 40–74 years. TIA = transient ischaemic attack. aDisease groups within the secondary prevention cohort are not mutually exclusive. bHigh CVD risk defined as a 10-year Framingham risk score of >20%,21 as calculated by the authors from available risk factor information in patient medical records. All percentages represent proportions of the total population.
Table 2.
Cardiovascular risk factor and disease status in total, primary and secondary prevention populations
| Characteristic | Total population, n (%) | Primary prevention population,an (%) | Secondary prevention population,bn (%) |
|---|---|---|---|
| Total patients | 34975 | 12 349 | 2550 |
| Sex (% female) | 16 990 (49) | 6295 (51) | 894 (35) |
| Age (mean ± standard deviation) | 54 ± 10 | 57 ± 9 | 63 ± 8 |
| South Asian ethnicityc | 1899 (12) | 974 (14) | 195 (10) |
| Family history of cardiovascular disease | 4213 (12) | 1888 (15) | 473 (19) |
| Diabetes | 2598 (7) | 1827 (15) | 599 (24) |
| Left ventricular hypertrophy | 77 (0) | 44 (0) | 26 (1) |
| Chronic kidney disease | 1302 (4) | 742 (6) | 402 (16) |
| Blood pressure measured | 30 151 (86) | 12 312 (100) | 2527 (99) |
| Cholesterol measured | 10 339 (30) | 9022 (73) | 1176 (46) |
| Formal cardiovascular risk assessment recorded in medical records | 8390 (24) | 5558 (45) | 911 (36) |
| Myocardial infarction | 733 (2) | n/a | 733 (29) |
| Peripheral vascular disease | 487 (1) | n/a | 487 (19) |
| Heart failure | 253 (1) | n/a | 253 (10) |
| Ischaemic heart disease | 1678 (5) | n/a | 1678 (66) |
| Stroke | 331 (1) | n/a | 331 (13) |
| Transient ischaemic attack | 295 (1) | n/a | 295 (12) |
n/a = not applicable.
Primary prevention population defined as patients with available risk factor information in medical records or a prescription for primary prevention medication.
Secondary prevention population defined as patients with existing cardiovascular disease (myocardial infarction, peripheral vascular disease, heart failure, ischaemic heart disease, stroke or transient ischaemic attack). Percentage of total patients in each group.
Percentage of patients in whom ethnicity was recorded.
Adherence to guidelines for primary prevention
Approximately 7929 (64%) patients in the primary prevention group were receiving appropriate treatment for their CVD risk in accordance with NICE guidelines (Figure 2). Adherence to treatment guidelines was higher in younger patients (6284 [69%] aged 40–64 years versus 1645 [50%] aged 65–74 years, P<0.001) and in females (4334 [69%] females versus 3595 [59%] males, P<0.001).
Figure 2.

Adherence to pharmacological guidelines for primary and secondary prevention of cardiovascular disease in patients on medication or with known risk, by age and sex (n = 14 899)
A total of 4699 patients were eligible for statin therapy, of whom 3777 (80%) were prescribed medication. Statin prescription was more common in younger patients (2399 [83% of those eligible] aged 40–64 years versus 1378 [76% of those eligible] aged 65–74 years, P<0.001) and in females (1782 females [92% of those eligible] versus 1995 males [72% of those eligible], P<0.001).
Of those eligible for antihypertensive medication (7234), 6213 (86%) patients received treatment. However, only 8191 (66%) patients in total had controlled blood pressure. As with statin prescription, blood pressure control was better in younger individuals (6424 [71%] aged 40–64 years versus 1767 [54%] aged 65–74 years, P<0.001) and in females (4373 [69%] females versus 3818 [63%] males, P<0.001).
There was no difference in guideline adherence between patients where a cardiovascular risk score was recorded in the medical notes (and/or medication was already prescribed) (n = 11 530) and in patients where it was calculable from risk factor information recorded in the medical notes (and/or medication was already prescribed) (n = 12 349) (guideline adherence in 7422 with recorded risk [64%] versus 7929 with calculable risk [64%], P = 0.792). Similarly, age and sex differences in guideline adherence were not affected by the use of recorded risk scores instead of calculated risk scores to define the eligible population (data available from authors).
Adherence to guidelines for secondary prevention
Adherence to guidelines for secondary prevention was observed in 1185 (47%) patients eligible for treatment (Figure 2). Guideline adherence was higher in patients with IHD than in those with stroke/TIA or other CVD (866 patients with IHD [52%] versus 288 patients with stroke/TIA [46%] versus 276 patients with other CVD [39%], P<0.001). There were no observed age or sex differences in adherence to guidelines in patients with IHD or stroke/TIA. However, in those with other CVD (heart failure or peripheral vascular disease), older patients (106 [34%] aged 40–64 years versus 170 [42%] aged 65–74 years, P = 0.043) and males (78 [32%] females versus 198 [42%] males, P = 0.014) were more likely to be treated in accordance with secondary prevention guidelines.
A total of 1882 patients (74%) were prescribed statin therapy for secondary prevention. Statin prescription was higher in patients with IHD (1354 patients with IHD [81%] versus 458 patients with stroke/TIA [73%] versus 453 patients with other CVD [63%], P<0.001). Almost all patients with IHD eligible for antihypertensive therapy were receiving treatment (1473 [95%]). Antihypertensive prescription in eligible patients with stroke/TIA or other CVD was also high, but significantly lower than those with IHD (433 patients with stroke/TIA [89%] versus 539 patients with other CVD [89%], versus 1473 patients with IHD [95%], P<0.001).
Despite a high proportion of patients receiving antihypertensive prescription, only 1577 patients (62%) had controlled blood pressure and this was consistent across disease groups (1044 patients with IHD [62%] versus 398 patients with stroke/TIA [64%] versus 433 patients with other CVD [61%], P = 0.539).
DISCUSSION
Summary
This study examined adherence to national guidelines for pharmacological primary and secondary prevention of CVD in patients aged 40–74 years attending general practice in the UK. Ten-year cardiovascular risk was known (or calculable) in nearly half of all patients (14 899 [43%]) and approximately two-thirds of these were receiving optimal treatment in accordance with national guidelines.3,22 Blood pressure was uncontrolled in over one-third of patients and this was the primary cause of guideline ‘non-adherence’, although it is possible that some patients were not prescribed further medication because of contraindications to therapy, refusal of treatment or because they were already receiving the maximal number of recommended drugs for hypertension. The study’s data suggest that existing prescribing practice is sufficient to ensure that the original projections of cost-effectiveness for the new vascular screening programme are realised.20 However, missed opportunities in cardiovascular disease prevention remain. These findings suggest that the full potential for vascular screening programmes will not be realised unless better use is made of existing risk factor information and greater adherence to the national guidelines for treatment is achieved.
Strengths and limitations
This study used routine data from the West Midlands, UK, and included all registered patients aged between 40 and 74 years in a large cohort of practices which were representative of the local area.24 The quality of these data is likely to be high since the introduction of the Quality and Outcomes Framework (QOF) has significantly improved the accuracy of recording of risk factor and chronic disease diagnoses in UK primary care.25 Blood pressure control was assessed on the basis of the most recent recorded clinic readings; it is not possible to know whether these readings represented isolated clinic readings or an average of multiple measurements.
Risk factor information extracted in the present study was not collected via the recently introduced vascular screening programme.16,17 Thus, it is possible that those included in the primary prevention population may have been sicker than those in the general population because risk factors are usually only measured where there is a clinical suspicion of risk. Despite this, the included population was considered comparable with the national population aged between 35 and 74 years, in terms of mean age (55 years [present study] versus 55 years [national]),26 sex (females, 49%) [present study] versus 49% [national]),26 prevalence of stroke and IHD (6% [present study] versus 6% [national]),27 diabetes (7% [present study] versus 7% [national]),27 untreated hypertension (16% [present study] versus 16% [national])27 and mortality (1.7 to 20.4 per 1000 population [West Midlands] versus 1.5 to 20.5 per 1000 population [national]).28 These data are advantageous over those from the Health Survey for England27 because the entire population from the study area was sampled, therefore removing any bias from differential response rates.
In the comparison of patient treatment with guideline recommendations, it was not possible to account for comorbidities and co-prescription, GP judgement of individual cases (including where patients were already receiving multiple medications or could not tolerate any further prescriptions), or individual patient choice which may have affected prescribing.29 The apparent better performance of younger patients in the analysis may be because younger people are more likely to be low risk and therefore not need treatment. Furthermore, while the study acknowledges the importance of behavioural change, this study focused only on drug treatment as a measure of guideline adherence.
The study did not take into account diabetes as an independent risk factor for CVD (although the Framingham equation does include adjustment for patients with diabetes).21 Thus a minority of low-risk patients may have been classified as high risk in general practice because of a risk score calculated by the UK Prospective Diabetes Study (UKPDS) risk engine,30 which was not used in the present investigation.
The Framingham equations are claimed to overestimate risk, resulting in misclassification of individuals.31 However, such comparisons have been undertaken using databases which themselves fail to capture approximately the same proportion of cardiac events as Framingham is said to overestimate by.32 Furthermore, this tool was recommended for use in clinical practice by NICE at the time of data collection,22 and therefore was deemed appropriate for use in this study. The present study used data preceding the introduction of the vascular screening programme in the UK and so it is only reflective of prescribing practice in the absence of routine cardiovascular risk assessments. It is possible that since the introduction of vascular screening, prescribing practice may have changed, and this is worthy of further study.
Comparison with existing literature
The under-treatment of patients at high risk of CVD observed in the present study is consistent with the findings of other studies conducted in Canada,15 Belgium,10 Italy,11,12 Switzerland,13 and across Europe14 (Table 3). The present study is the first conducted in the UK and the first to examine adherence to guidelines for both primary and secondary prevention of CVD in a complete primary care population. The study observed comparable rates of prescription for lipid-lowering therapy (74% [present study] versus 56–80% [existing literature])10,11,13,14 and antihypertensive medication (91% [present study] versus 67–94% [existing literature]),10–15 and generally better blood pressure control than previously reported (62% [present study] versus 13–62% [existing literature]).10,11,13–15
Table 3.
Adherence to treatment guidelines and blood pressure control in previous studies compared with the present study
| Country | Year | Study population | Population sampling | Number of patients | Guideline lipid-lowering therapy prescription,a % | Guideline antihypertensive prescription,a % | Controlled blood pressure |
|---|---|---|---|---|---|---|---|
| Belgium10 | 2010 | High riskb | Selected sample from multiple centres | 11 069 | 80 | 68 | 13 |
| Italy11 | 2006 | High riskb | Random sample from multiple centres | 3120 | 56 | 70 | 28 |
| Italy12 | 2010 | High riskb | Random sample from multiple centres | 5731 | – | 67 | – |
| Switzerland13 | 2010 | High riskb | Entire population from study area | 23 892 | 71 | 77 | 62 |
| cEurope14 | 2010 | Primary prevention | Patients attending study clinic | 4366 | 50 | 86 | 29 |
| Canada15 | 2012 | High riskb | Entire population from study area | 4931 | – | 94 | 50 |
| UK: present study | 2014 | Primary prevention | Entire population from study area | 12 349 | 80 | 88 | 56 |
| UK: present study | 2014 | Secondary prevention | Entire population from study area | 2550 | 74 | 91 | 62 |
Medication prescriptions in those eligible for treatment (according to relevant guidelines).
Existing cardiovascular disease or high risk because of existence of diabetes, chronic kidney disease or >20% cardiovascular risk score.
Belgium (n = 106), Bulgaria (n = 327), Croatia (n = 398), Finland (n = 518), Germany (n = 206), Italy (n = 548), Latvia (n = 321), Poland (n = 394), Romania (n = 485), Slovenia (n = 163), Spain (n = 519), UK (n = 381).
However, the study demonstrates that there is still scope for significant intensification of treatment in patients with known or calculable 10-year CVD risk. Why such treatment intensification does not occur in clinical practice is difficult to establish from the present data alone. It is not clear whether the lack of treatment observed here results from the GP’s failure to examine CVD risk using available risk factor information or whether risk is known but concerns about the accuracy of risk calculators,33 overtreatment,34 misunderstanding of CVD risk34,35 or that patients would not understand what risk means36 act as barriers to guideline adherence. Patients themselves may choose to avoid medication, resulting in ‘under-use’ of CVD prevention therapy.29 While some such decisions may be informed, others may be made by default or in the absence of adequate explanation of the concept of CVD risk.37
The data support the findings of previous studies that examined the association between age and sex, and prescription of medication for the primary prevention of CVD.38 In primary prevention, the study showed that younger patients and females are more likely to be prescribed therapy, despite all eligible patients being at high risk of developing CVD by definition. This is interesting and does not suggest that GP prescribing practice is solely based on calculated 10-year CVD risk. Contrary to previous reports,39–42 however, the study found little difference in secondary prevention associated with age or sex, except in patients with heart failure and peripheral vascular disease, where a higher number of older patients and males were receiving therapy. This may reflect the 74-year age cut-off in this study.
There do not appear to be any other studies that demonstrate the disparity in guideline adherence for secondary prevention of CVD between specific disease types. It is possible that these differences result from the array of different guidelines available for specific disease management4,7–9 and subsequent confusion regarding the latest guidance.
Implications for clinical practice
Optimisation of treatment in people with known or calculable 10-year CVD risk is as important as identifying new people at risk. The study suggests that there is room for improvement in this area of CVD prevention. One way of ensuring this happens is to promote regular treatment reviews in all patients with a history of CVD or who are known to be at high risk. In the UK, regular review is encouraged by national guidelines3,4 and QOF,43 which offers financial rewards to GPs achieving certain performance-related goals. However, the present study suggests that in the past, this recommendation has not precipitated action in CVD prevention. The latest iteration of the QOF, introduced in April 2013,43 recommends stricter blood pressure control (targets of 140/90mmHg)3 and the prescription of lipid-lowering therapy to those at high risk of CVD.4 The study suggests that there is scope for these indicators to facilitate improvements in CVD prevention in routine clinical practice.
This study found that just over half of patients had an unknown 10-year risk of CVD. They could benefit from the national vascular screening programme currently being implemented in the UK,16,17 but only if treatment is initiated appropriately after screening. Although the study showed adherence to guidelines for prevention of CVD to be suboptimal, the data do suggest that the benefits of vascular screening modelled in the original cost-effectiveness analysis20 are likely to be realised if current treatment trends can be marginally improved. This modelling assumed that 80% of the total eligible population screened in the vascular health checks would be prescribed an antihypertensive medication and 85% would receive statin therapy. These assumptions were based on ‘expert opinion’ but the study’s data seem to support them; it was found that for primary prevention, 86% of patients are prescribed antihypertensive medication and 80% are given statins.
Provided that existing prescribing trends in UK clinical practice continue, the vascular health check programme is likely to achieve the predicted benefits modelled by the Department of Health.20 However, there is still room for improvement in CVD prevention, particularly in patients with existing CVD, known or calculable risk. The inclusion of new CVD indicators in the QOF could lead to optimisation of treatment in these at-risk patients but only if such treatment is accepted by patients and their GPs.
Acknowledgments
We thank all the general practices which participated in this study for their cooperation and assistance with this project.
Funding
This work is independent research funded by the National Institute for Health Research (NIHR) under its Programme Grants for Applied Research scheme (Stroke Prevention Programme: RP-PG-0606-1153). James P Sheppard is funded by the NIHR Birmingham and Black Country Collaboration for Leadership in Applied Health Research and Care. Richard J McManus holds an NIHR Professorship. The views and opinions expressed are those of the authors and do not necessarily reflect those of the NHS, NIHR, or the Department of Health.
Ethical approval
Data collection was approved by the Birmingham East North and Solihull Research Ethics Committee in June 2008 (Ref number 08/H1206/91).
Provenance
Freely submitted; externally peer reviewed.
Open access
This is an Open Access article distributed in accordance with the CC BY-NC 3.0 license http://creativecommons.org/licenses/.
Competing interests
The authors have declared no competing interests.
Discuss this article
Contribute and read comments about this article: www.bjgp.org/letters
REFERENCES
- 1.Lopez AD, Mathers CD, Ezzati M, et al. Global and regional burden of disease and risk factors, 2001: systematic analysis of population health data. Lancet. 2006;367(9524):1747–1757. doi: 10.1016/S0140-6736(06)68770-9. [DOI] [PubMed] [Google Scholar]
- 2.Ezzati M, Lopez AD, Rodgers A, et al. Selected major risk factors and global and regional burden of disease. Lancet. 2002;360(9343):1347–1360. doi: 10.1016/S0140-6736(02)11403-6. [DOI] [PubMed] [Google Scholar]
- 3.National Institute for Health and Care Excellence . Hypertension: clinical management of primary hypertension in adults. London: NICE; 2011. NICE clinical guideline 127. [Google Scholar]
- 4.National Institute for Health and Care Excellence . Lipid modification: cardiovascular risk assessment and the modification of blood lipids for the primary and secondary prevention of cardiovascular disease. London: NICE; 2010. (Update). NICE clinical guideline 67. [PubMed] [Google Scholar]
- 5.World Health Organization . Prevention of cardiovascular disease: guidelines for assessment and management of cardiovascular risk. Geneva: WHO Press; 2007. [Google Scholar]
- 6.Mancia G, De Backer G, Dominiczak A, et al. 2007 ESH-ESC Practice Guidelines for the Management of Arterial Hypertension: ESH-ESC Task Force on the Management of Arterial Hypertension. J Hypertens. 2007;25(9):1751–1762. doi: 10.1097/HJH.0b013e3282f0580f. [DOI] [PubMed] [Google Scholar]
- 7.Rosendorff C, Black HR, Cannon CP, et al. Treatment of hypertension in the prevention and management of ischemic heart disease: a scientific statement from the American Heart Association Council for High Blood Pressure Research and the Councils on Clinical Cardiology and Epidemiology and Prevention. Circulation. 2007;115(21):2761–2788. doi: 10.1161/CIRCULATIONAHA.107.183885. [DOI] [PubMed] [Google Scholar]
- 8.Perk J, De Backer G, Gohlke H, et al. European Guidelines on cardiovascular disease prevention in clinical practice (version 2012). The Fifth Joint Task Force of the European Society of Cardiology and Other Societies on Cardiovascular Disease Prevention in Clinical Practice (constituted by representatives of nine societies and by invited experts) Eur Heart J. 2012;33(13):1635–1701. doi: 10.1093/eurheartj/ehs092. [DOI] [PubMed] [Google Scholar]
- 9.Goldstein LB, Adams R, Alberts MJ, et al. Primary prevention of ischemic stroke: a guideline from the American Heart Association/American Stroke Association Stroke Council: cosponsored by the Atherosclerotic Peripheral Vascular Disease Interdisciplinary Working Group; Cardiovascular Nursing Council; Clinical Cardiology Council; Nutrition, Physical Activity, and Metabolism Council; and the Quality of Care and Outcomes Research Interdisciplinary Working Group: the American Academy of Neurology affirms the value of this guideline. Stroke. 2006;37(6):1583–1633. doi: 10.1161/01.STR.0000223048.70103.F1. [DOI] [PubMed] [Google Scholar]
- 10.Missault L, Witters N, Imschoot J. High cardiovascular risk and poor adherence to guidelines in 11,069 patients of middle age and older in primary care centres. Eur J Cardiovasc Prev Rehabil. 2010;17(5):593–598. doi: 10.1097/HJR.0b013e328339cc86. [DOI] [PubMed] [Google Scholar]
- 11.Roccatagliata D, Avanzini F, Monesi L, et al. Is global cardiovascular risk considered in current practice? Treatment and control of hypertension, hyperlipidemia, and diabetes according to patients’ risk level. Vasc Health Risk Manag. 2006;2(4):507–514. doi: 10.2147/vhrm.2006.2.4.507. [DOI] [PMC free article] [PubMed] [Google Scholar]
- 12.Filippi A, Casula M, Tragni E, et al. Blood pressure and antihypertensive therapy according to the global cardiovascular risk level in Italy: the CHECK Study. Eur J Cardiovasc Prev Rehabil. 2010;17(5):562–568. doi: 10.1097/HJR.0b013e328338a4c6. [DOI] [PubMed] [Google Scholar]
- 13.Jaussi A, Noll G, Meier B, Darioli R. Current cardiovascular risk management patterns with special focus on lipid lowering in daily practice in Switzerland. Eur J Cardiovasc Prev Rehabil. 2010;17(3):363–372. doi: 10.1097/HJR.0b013e328333c1d9. [DOI] [PubMed] [Google Scholar]
- 14.Kotseva K, Wood D, De Backer G, et al. EUROASPIRE III. Management of cardiovascular risk factors in asymptomatic high-risk patients in general practice: cross-sectional survey in 12 European countries. Eur J Cardiovasc Prev Rehabil. 2010;17(5):530–540. doi: 10.1097/HJR.0b013e3283383f30. [DOI] [PubMed] [Google Scholar]
- 15.Liddy C, Singh J, Hogg W, et al. Quality of cardiovascular disease care in Ontario, Canada: missed opportunities for prevention - a cross sectional study. BMC Cardiovasc Disord. 2012;12:74. doi: 10.1186/1471-2261-12-74. [DOI] [PMC free article] [PubMed] [Google Scholar]
- 16.Department of Health . Putting prevention first Vascular checks: risk assessment and management Impact assessment. London: Central Office of Information; 2008. [Google Scholar]
- 17.Davies M, Khunti K, Webb D, et al. UPDATED: The handbook for vascular risk assessment, risk reduction and risk management. Leicester: University of Leicester and UK National Screening Committee; 2012. [Google Scholar]
- 18.Krogsbøll LT, Jørgensen KJ, Grønhøj LC, Gøtzsche PC. General health checks in adults for reducing morbidity and mortality from disease: Cochrane systematic review and meta-analysis. BMJ. 2012;345:e7191. doi: 10.1136/bmj.e7191. [DOI] [PMC free article] [PubMed] [Google Scholar]
- 19.Krogsbøll LT, Jørgensen KJ, Grønhøj LC, Gøtzsche PC. General health checks in adults for reducing morbidity and mortality from disease. In: Cochrane Collaboration, editor. The Cochrane Library. Oxford: Update Software; 2012. Issue 10. [DOI] [PubMed] [Google Scholar]
- 20.Department of Health . Economic modelling for vascular checks: a technical consultation on the work undertaken to establish the clinical and cost effectiveness evidence base for the Department of Health’s policy of vascular checks. London: The Stationery Office; 2008. [Google Scholar]
- 21.Anderson KM, Odell PM, Wilson PW, Kannel WB. Cardiovascular disease risk profiles. Am Heart J. 1991;121(1 Pt 2):293–298. doi: 10.1016/0002-8703(91)90861-b. [DOI] [PubMed] [Google Scholar]
- 22.National Institute for Health and Clinical Excellence . Lipid modification: cardiovascular risk assessment and the modification of blood lipids for the primary and secondary prevention of cardiovascular disease. London: NICE; 2008. Clinical guideline 67. [PubMed] [Google Scholar]
- 23.Hippisley-Cox J, Coupland C, Vinogradova Y, et al. Predicting cardiovascular risk in England and Wales: prospective derivation and validation of QRISK2. BMJ. 2008;336(7659):1475–1482. doi: 10.1136/bmj.39609.449676.25. [DOI] [PMC free article] [PubMed] [Google Scholar]
- 24.McManus RJ, Ryan R, Jones M, et al. How representative of primary care are research active practices? Cross-sectional survey. Fam Pract. 2008;25(1):56–62. doi: 10.1093/fampra/cmm065. [DOI] [PubMed] [Google Scholar]
- 25.Taggar JS, Coleman T, Lewis S, Szatkowski L. The impact of the Quality and Outcomes Framework (QOF) on the recording of smoking targets in primary care medical records: cross-sectional analyses from The Health Improvement Network (THIN) database. BMC Public Health. 2012;12:329. doi: 10.1186/1471-2458-12-329. [DOI] [PMC free article] [PubMed] [Google Scholar]
- 26.Office for National Statistics Annual mid-year population estimate. 2011. http://www.ons.gov.uk http://www.ons.gov.uk/ons/rel/pop-estimate/population-estimates-for-england-and-wales/mid-2011--2011-census-based-/stb---mid-2011-census-based-population-estimates-for-england-and-wales.html (accessed 29 Oct 2013).
- 27.Boniface S, Bridges S, Craig R, et al. Health Survey for England 2011. Volume 1: Health, social care and lifestyles. http://www.hscic.gov.uk. https://catalogue.ic.nhs.uk/publications/public-health/surveys/heal-surv-eng-2011/HSE2011-All-Chapters.pdf (accessed 19 Nov 2013).
- 28.Office for National Statistics Mortality statistics: deaths registered in England & Wales (Series DR), 2010. http://www.ons.gov.uk/ons/publications/re-reference-tables.html?edition=tcm%3A77-230730 (accessed 25 Oct 2013).
- 29.Aarabi M, Skinner J, Price CE, Jackson PR. Patients’ acceptance of antihypertensive therapy to prevent cardiovascular disease: a comparison between South Asians and Caucasians in the United Kingdom. Eur J Cardiovasc Prev Rehabil. 2008;15(1):59–66. doi: 10.1097/HJR.0b013e3282f07973. [DOI] [PubMed] [Google Scholar]
- 30.Stevens RJ, Kothari V, Adler AI, Stratton IM. The UKPDS risk engine: a model for the risk of coronary heart disease in Type II diabetes (UKPDS 56) Clin Sci (Lond) 2001;101(6):671–679. [PubMed] [Google Scholar]
- 31.Neuhauser HK, Ellert U, Kurth BM. A comparison of Framingham and SCORE-based cardiovascular risk estimates in participants of the German National Health Interview and Examination Survey 1998. Eur J Cardiovasc Prev Rehabil. 2005;12(5):442–450. doi: 10.1097/01.hjr.0000183909.52118.9f. [DOI] [PubMed] [Google Scholar]
- 32.Herrett E, Shah AD, Boggon R, et al. Completeness and diagnostic validity of recording acute myocardial infarction events in primary care, hospital care, disease registry, and national mortality records: cohort study. BMJ. 2013;346:f2350. doi: 10.1136/bmj.f2350. [DOI] [PMC free article] [PubMed] [Google Scholar]
- 33.van Steenkiste B, van der Weijden T, Stoffers HE, Grol R. Barriers to implementing cardiovascular risk tables in routine general practice. Scand J Prim Health Care. 2004;22(1):32–37. doi: 10.1080/02813430310004489. [DOI] [PubMed] [Google Scholar]
- 34.Eichler K, Zoller M, Tschudi P, Steurer J. Barriers to apply cardiovascular prediction rules in primary care: a postal survey. BMC Fam Pract. 2007;8:1. doi: 10.1186/1471-2296-8-1. [DOI] [PMC free article] [PubMed] [Google Scholar]
- 35.De Muylder R, Lorant V, Paulus D, et al. Obstacles to cardiovascular prevention in general practice. Acta Cardiol. 2004;59(2):119–125. doi: 10.2143/AC.59.2.2005165. [DOI] [PubMed] [Google Scholar]
- 36.Torley D, Zwar N, Comino EJ, Harris M. GPs’ views of absolute cardiovascular risk and its role in primary prevention. Aust Fam Physician. 2005;34(6):503–504. 507. [PubMed] [Google Scholar]
- 37.van Steenkiste B, van der Weijden T, Timmermans D, et al. Patients’ ideas, fears and expectations of their coronary risk: barriers for primary prevention. Patient Educ Couns. 2004;55(2):301–307. doi: 10.1016/j.pec.2003.11.005. [DOI] [PubMed] [Google Scholar]
- 38.Sheppard JP, Singh S, Fletcher K, et al. Impact of age and sex on primary preventive treatment for cardiovascular disease in the West Midlands, UK: cross sectional study. BMJ. 2012;345:e4535. doi: 10.1136/bmj.e4535. [DOI] [PMC free article] [PubMed] [Google Scholar]
- 39.Lemaitre RN, Furberg CD, Newman AB, et al. Time trends in the use of cholesterol-lowering agents in older adults: the Cardiovascular Health Study. Arch Intern Med. 1998;158(16):1761–1768. doi: 10.1001/archinte.158.16.1761. [DOI] [PubMed] [Google Scholar]
- 40.Whincup PH, Emberson JR, Lennon L, et al. Low prevalence of lipid lowering drug use in older men with established coronary heart disease. Heart. 2002;88(1):25–29. doi: 10.1136/heart.88.1.25. [DOI] [PMC free article] [PubMed] [Google Scholar]
- 41.Gnavi R, Migliardi A, Demaria M, et al. Statins prescribing for the secondary prevention of ischaemic heart disease in Torino, Italy. A case of ageism and social inequalities. Eur J Public Health. 2007;17(5):492–496. doi: 10.1093/eurpub/ckm005. [DOI] [PubMed] [Google Scholar]
- 42.Ko DT, Mamdani M, Alter DA. Lipid-lowering therapy with statins in high-risk elderly patients: the treatment-risk paradox. JAMA. 2004;291(15):1864–1870. doi: 10.1001/jama.291.15.1864. [DOI] [PubMed] [Google Scholar]
- 43.NHS Employers . 2013/14 General medical services (GMS) contract quality and outcomes framework (QOF): guidance for GMS contract 2013/14. London: NHS Employers; 2013. [Google Scholar]