Abstract
Background
A plantar temperature distribution can be obtained by thermography; however, the advantage has not been effectively utilized in the past. We previously proposed a classification method based on the angiosome concept, but the method was insufficient because it was too subjective and complicated for clinicians. In this study, we propose a new classification system of plantar forepart thermographic patterns using an image segmentation technique.
Methods
A cross-sectional observational study was conducted including 32 healthy volunteers and 129 patients with diabetes mellitus (DM). Individual thermographic variations and trends were evaluated. A comparison was conducted between the patterns obtained by our previous angiosome-based research and the patterns found by the new classification system.
Results
The system objectively found wider variations of the plantar forepart thermographic patterns in the patients with DM compared with those in the control subjects. In patients with DM, the system showed that the whole-high pattern was most frequent (46%), followed by the butterfly pattern (12%). In the control group, the butterfly pattern was most frequent (44%), followed by the whole-high pattern (19%). Both ankle and toe brachial indices were higher in feet with high temperature area in the inner side of the plantar.
Conclusions
Thermographic patterns found by the new computer-based system were similar to those obtained in our previous subjective work. The classification system found forefoot-low pattern and tiptoe-low pattern objectively. The system based on infrared thermography will be a screening tool to assess circulatory status in daily foot care of patients with DM.
Keywords: angiosome, diabetic foot, image processing, plantar skin temperature, thermography
Introduction
Diabetic foot leads to infection, ulceration, and/or destruction of deep tissues in the lower limb of patients with diabetes mellitus (DM).1 Foot disorders are said to be the most serious and costly complications of DM.2 Patients typically have neurological abnormalities and/or various degrees of peripheral vascular disease. The prevalence of foot ulcers is 4% to 10% in patients with DM.3 Diabetic foot affects a patient’s physical condition, long-term prognosis,4 and health-related quality of life.5 Therefore, as the number of patients with DM is increasing,6 early detection and effective preventive methods for diabetic foot is essential.
Thermometry of the diabetic foot is an effective way to assess risks of ulceration.7 It has been shown that monitoring foot skin temperature provides clinical information before other clinical signs of injury can be identifed.8 Lavery and coauthors9 and Armstrong and coauthors10 have shown that monitoring foot skin temperature at home could reduce the risk of diabetic foot ulceration. It is known that chronic temperature elevation may be observed in the neuropathic diabetic foot, mainly by increased arteriovenous shunt flow.11–13 Impaired thermoregulation causes unstable skin temperature in the neuropathic diabetic foot.14
Thermography has an advantage to visualize morphological patterns of temperature distribution7, 1 5 compared with conventional devices such as contact infrared (IR) skin thermometer.9,10,16 Thermography is noninvasive and easy to use by clinicians of various backgrounds. We reported temperature elevation in an inflammatory callus in the diabetic foot using IR thermography for screening latent infammation.17 The IR thermography was also used in diabetic foot thermometry studies.13,18 A whole image of the plantar temperature distribution can be obtained by IR thermography; however, previous studies have not fully explored the potential to analyze the whole filed image data comprehensively for better clinical decisions.19
There are only a few articles that describe thermographic morphological patterns of plantar temperature. Chan and coauthors12 used liquid crystal thermography to designate temperature distribution in nondiabetic subjects as a “symmetric bilateral butterfly pattern” in which the medial arch showed the highest temperature. Stess and coauthors20 reported that such a typical symmetrical pattern was observed in only 9 out of 16 nondiabetic subjects.
There are three major reasons why it may be difficult to interpret thermographic patterns. (1) There is lack of sufficient information of thermographic patterns even in nondiabetic subjects. (2) There is lack of an appropriate classification method for the plantar thermographic patterns, particularly focusing on the vascular anatomy and circulatory status of the foot. (3) There is no objective way to assign a thermographic image to certain categories. To overcome the difficulties of 1 and 2, we proposed a classification method for plantar thermographic patterns according to the concept of angiosome.21 After the concept was introduced in the field of plastic surgery,22 it has widely been applied to most of the surface areas of the body. Attinger and coauthors23 proposed two angiosomes in the distal forepart of the plantar area: the medial plantar artery angiosome and the lateral plantar artery angiosome. They also proposed two angiosomes in the heel part of the plantar area: the medial calcaneal artery angiosome and the lateral calcaneal artery angiosome. We believe it is reasonable to consider that the abnormal “mottling” patterns in patients with DM are caused by vessel stenosis or arteriovenous shunts and correspond to the districts of the plantar angiosomes. Based on the angiosome concept, we previously proposed a classification method with 20 different plantar thermographic pattern categories. We distinguished five different patterns in the distal area (Figure 1) and four patterns in the heel area and obtained the conceptual 20 different categories. Our previous classification method proved insufficient because it is too subjective and complicated for clinicians to distinguish 20 categories in daily situations, although the observation of the thermographic pattern according to the angiosome-based method may give us an important clue regarding diabetic foot.
Figure 1.

Variations of the thermographic patterns of the distal part of the plantar found in Nagase and coauthors.20 Red color indicates higher temperature, and blue color indicates lower temperature.
In this study, we propose a new classification system of plantar thermographic patterns using an image segmentation technique. One of the most effective strategies to prevent diabetic foot ulcers is prevention of callus formation in patients with DM. Callus is said to be a pathway preceding to foot ulcers and involves hyperkeratosis caused by excessive mechanical loading.1 Calluses are more frequent under a bony prominence, such as the metatarsal head,24 and it is shown that the relative risk for ulceration in a callused area is 11.0 times higher than that of an area without callus.25 Thus, we concentrate on constructing a system that classifies thermographic patterns of the distal forepart area in this study. Based on the progress of computer vision algorithms on nonparametric clustering, we developed an image segmentation method of plantar thermography and utilized it to classify plantar thermography patterns. The segmentation algorithm is based on the idea of associating each thermography image pixel to a mode of underlying probability density function.26,27 We utilized an extension of noniterative medoid shift algorithm to segment each thermography image into visually coherent parts.28,29 The form of the parts can be regarded as morphological pattern. Thermographic images from both the nondiabetic control subjects and the patients with DM were allocated to some categories by the classification system. We evaluated the individual thermographic variations as well as trends between nondiabetic control subjects and patients with DM by the system. We also compared the patterns obtained by our previous angiosome-based research and by the new classification system.
Methods
A cross-sectional observational study was conducted including 32 healthy volunteers as the control group and 129 patients with DM as the DM group. The DM group participants were recruited from the patients at the Diabetic Foot Outpatient Clinic at the University of Tokyo Hospital between November 2008 and October 2009. Patients <20 years old or patients with active foot ulcers were excluded.
Age and sex were recorded for each subject of the control and the DM group. The ankle brachial index (ABI) and toe brachial index (TBI) were measured using form pulse-wave velocity /ABI BP-203RPEII (Omron Colin Co. Ltd., Tokyo, Japan) for the control and the DM groups. The type and duration of DM and the National Glycohemoglobin Standardization Program glycosylated hemoglobin value averaged over 1 year were collected only in the DM group from the patients’ charts. Motor neuropathy was evaluated using the Achilles tendon reflex. If the reflex was diminished or absent bilaterally, the patients were diagnosed as having motor neuropathy. Sensory neuropathy was evaluated using the Semmes–Weinstein monofilament test and vibratory sensation test.2 Angiopathy was evaluated using the ABI and TBI. If ABI was no more than 0.9 or TBI was less than 0.7, the patients were diagnosed as having angiopathy.30
Thermographic images of the bilateral feet were taken from all participants. The subjects were instructed to lie in supine position without shoes and socks for 15 min in a room controlled at 26.5 ± 0.5 °C before measurement. Images were taken using IR thermography Thermotracer TH5108ME (NEC Avio Infrared Technology Co. Ltd., Tokyo, Japan). Research nurses specialized in diabetic foot care took thermographic images in a consistent manner. The research nurses tried to photograph each foot while keeping both the vertical and horizontal centers of each foot aligned with the respective vertical and horizontal centers of the thermographic image. The forefoot parts were placed in the upper part of the image, and the heels were placed at the bottom part of the image.
In the angiosome-based method,21 each plantar thermographic image was divided into the distal forepart and the heel part by a plastic surgeon with experience in diabetic foot care. Then the distal forepart of each image was allocated to the five categories (Figure 1). To avoid observation bias, the two trained research nurses further confirmed the allocation. When the categorization differed among the investigators, the images were reviewed again by all three investigators to make the final decision. If the images did not correspond to any of the five categories, they were designated as “atypical.”
To objectively allocate the plantar thermographic image into several types, we developed a new image classification system. Usually, a plantar thermography image is associated with a temperature color bar (Figure 2), but here, the same color in different thermography images sometimes corresponds to a different temperature. For example, orange corresponds to 33.0 °C in some images, but to 34.0 °C in other images. Our image processing system adjusts the original thermography into the corrected image by utilizing the color bar (Figure 3). In the system, the adjusted thermography image is converted into corresponding gray scale temperature image (Figure 4). The higher temperature is assigned brighter white luminance, and the lower temperature is assigned darker luminance. We developed an image-partitioning algorithm to segment each plantar thermography image into several visually coherent image parts. The segmentation algorithm is implemented based on a mode-seeking method that can be used to partition an image into a set of visually close pixels.29 The tradeoff parameter between color importance and spatial importance was set to 0.75. The larger value means more importance to color, that is, the clustering is more dependent on color resemblance than spatial nearness. The size of the kernel used to estimate the density was set to 2.0. The kernel size is the standard deviation of the Gaussian Parzen window. And the maximum distance between points in the feature space that may be linked was set to 50. If the maximum distance value increases, the area clusters become larger because less similar points can be linked. These were determined based on several pretests using sample plantar thermography images. The intermediate segmentation subgroup is calculated during the segmentation process in the system (Figure 5). After the segmentation process, the system outputs the segmented thermography image (Figures 6 and 7). Typically, approximately 50 to 65 regions were extracted for each whole rectangle thermographic image containing both feet. Then the distal part of the plantar thermography images were clustered and categorized into several groups using spacial relationships among the visually coherent image parts of the plantar forepart. The central area of each plantar forepart was determined by the system based on the assumption of the place and the size of each foot in the thermographic photo images. The overall image processing takes about 30 s for each thermographic image. The image processing code was written in MATLAB R2012a script (The Math Works Inc., MA).
Figure 2.
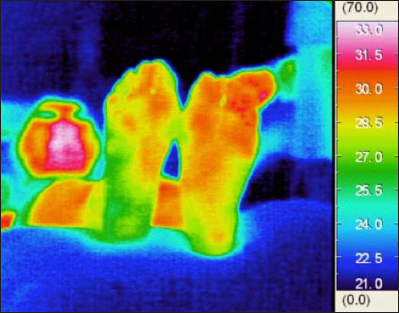
A thermographic image of a patient with DM.
Figure 3.
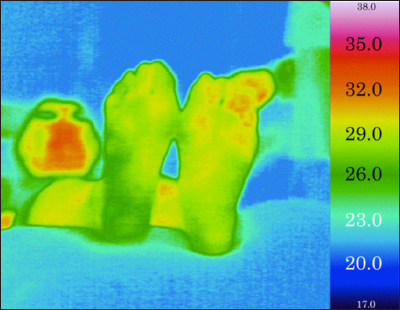
An adjusted thermography image of a patient with DM.
Figure 4.
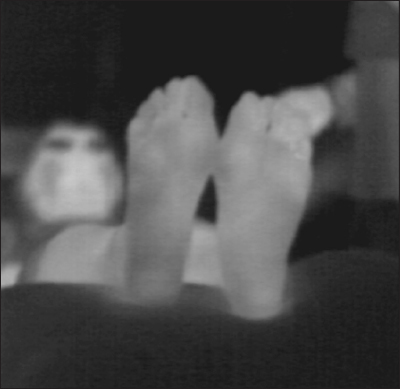
A gray scale temperature image of a patient with DM.
Figure 5.
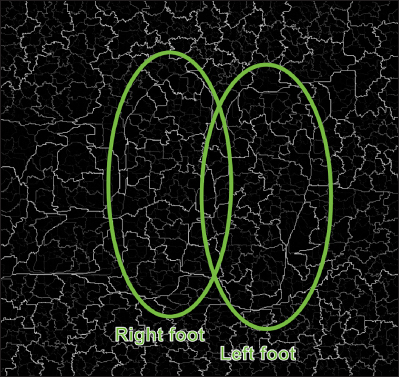
An intermediate segmentation subgroups image of a patient with DM (circles and texts added).
Figure 6.
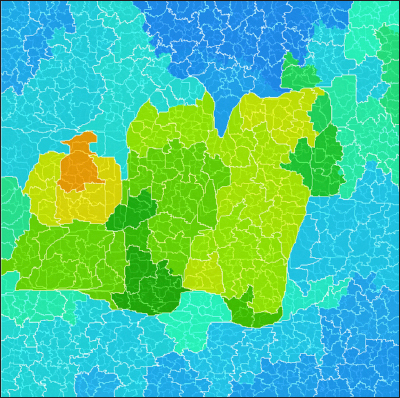
A segmented thermography image with subgroup boundaries of a patient with DM.
Figure 7.
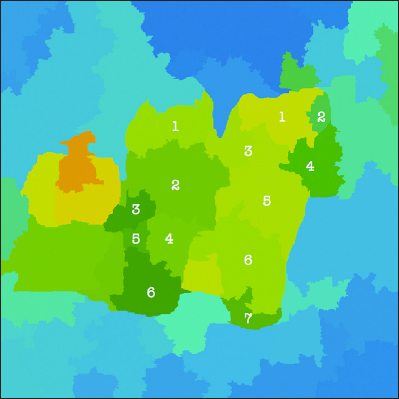
A segmented thermography image of a patient with DM (segment numbers added).
Statistical differences of the parameters between the control group and the DM group were analyzed using the t-test or chi-square test. Statistical analysis was performed using MATLAB R2012a.
This research was approved by the ethics committee at the Graduate School of Medicine and Faculty of Medicine, the University of Tokyo (#2308-(1)). Written informed consent was obtained from all subjects of the control and the DM group.
Results
Thirty-two healthy nondiabetic volunteers (36.8 ± 11.8 years old) and 129 patients with DM (67.2 ± 10.5 years old) were recruited. The age of the DM group was significantly higher than in the control group. The ratio of male/female of was significantly higher in the DM group than in the control group. The ABI was significantly higher, and the TBI was significantly lower in the DM group compared with the control group (Table 1).
Table 1.
Characteristics of Subjectsa
| Control group (n = 32) | DM group (n = 129) | p-value | |||
| Age (years) | 36.8 ± 11.8 | 67.2 ± 10.5 | <0.001b | ||
| Sex | |||||
| Male | 8 (25.0%) | 81 (62.8%) | <0.001c | ||
| Female | 24 (75.0%) | 48 (37.2%) | |||
| ABI (left and right) | n = 58 | 1.08 ± 0.08 | n = 252 | 1.11 ± 0.19 | 0.016b |
| TBI (left and right) | n = 58 | 0.76 ± 0.11 | n = 250 | 0.71 ± 0.18 | <0.01b |
| DM type | |||||
| Type 1 | 6 (4.7%) | ||||
| Type 2 | 119 (92.3%) | ||||
| Others | 4 (3.1%) | ||||
| DM duration (years) | n = 128 | 15.1 ± 9.6 | |||
| Hemoglobin A1c (National Glycohemoglobin Standardization Program) (%) | n = 116 | 7.5 ± 1.5 | |||
| Motor neuropathy | n = 125 | 88 (70.4%) | |||
| Sensory neuropathy | n = 128 | 88 (68.8%) | |||
| Angiopathy | n = 127 | 70 (55.1%) | |||
| International Working Group on the Diabetic Foot risk classification | |||||
| Group 0 (without risk factors) | 11 (8.5%) | ||||
| Group 1 (with neuropathy) | 84 (77.5%) | ||||
| Group 2 (with neuropathy and | 26 (20.2%) | ||||
| Group 3 (with a history of ulcer or amputation) | 8 (6.2%) | ||||
Mean ± standard deviation or n (%).
Student’s t-test.
Chi-square test.
From a total of 64 feet from the 32 nondiabetic control volunteers, the system found four categories (types 1, 2, 4, and 6) for 47 feet, and the remaining 17 feet were assigned as anomalous (Figure 8). The most frequent category contained similar patterns in type 1 (28 feet, 44%) of our previous research.21 Among the 28 feet, the butterfly pattern was shown in 27 feet. The next frequent category can be regarded as type 2 (12 feet, 19%). The system also found 2 feet as having similar category of type 4 pattern of our previous research. The system automatically found a new pattern, type 6 (Figure 9). In the type 6 pattern, the forefoot has relatively lower temperature than other area. There were 17 atypical feet in the nondiabetic control group.
Figure 8.

Variations of the thermographic patterns of the distal forepart of the plantar in the nondiabetic control group.
Figure 9.
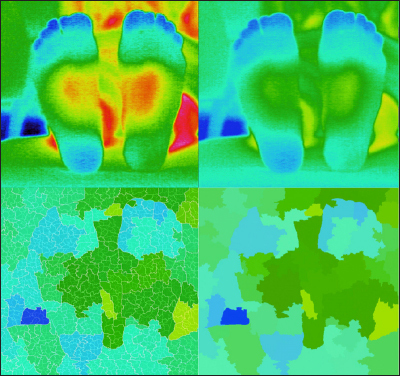
An example of type 6 pattern (both feet, the forefoot has lower temperature). Upper left, thermography; upper right, adjusted thermography; lower left, segmented thermography with sub-boundaries; and lower right, segmented thermography.
Thermographic patterns of the plantar forepart in the DM group showed wider variations than in the control group (Figure 10). The patterns were classified into six categories, which means that another new, different pattern, type 7, was found automatically (Figure 11). Although the two most frequent categories were the same, types 1 and 2, the frequency was reversed from the control group to the DM group. This reversal was also seen in our previous subjective research. The most frequent category was type 2 (118 feet, 46%), and the next was type 1 (31 feet, 12%). Many DM feet were allocated to type 4 (18 feet, 7%). Other large pattern types were type 5 (17 feet, 7%) and type 6 (11 feet, 4%). The atypical thermographic patterns were observed in a considerable 60 feet in the DM group. Of 60 atypical DM feet, 23 feet seemed to have inflammation symptoms (Figure 12), and over half (37 feet) of atypical patterns in the DM group seem similar to type 6 or type 7 subjectively (Figure 13). Table 2 shows the overall result of the classification. It should be noted that the categorization by our previous research21 is subjective and not the gold standard.
Figure 10.

Variations of the thermographic patterns of the distal forepart of the plantar in the DM group.
Figure 11.
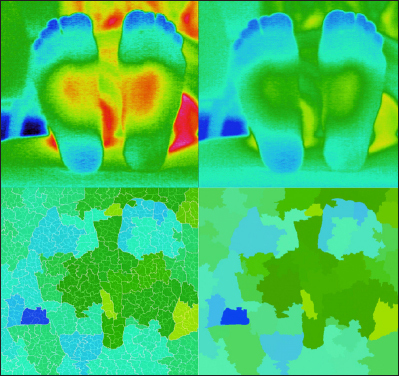
An example of type 7 pattern (left foot, the tiptoe has lower temperature). Upper left, thermography; upper right, adjusted thermography; lower left, segmented thermography with sub-boundaries; and lower right, segmented thermography.
Figure 12.
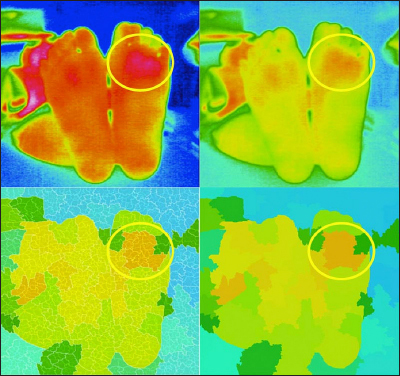
An example of atypical pattern (left foot, the latent inflammation is suspected). Upper left, thermography; upper right, adjusted thermography; lower left, segmented thermography with sub-boundaries; and lower right, segmented thermography.
Figure 13.
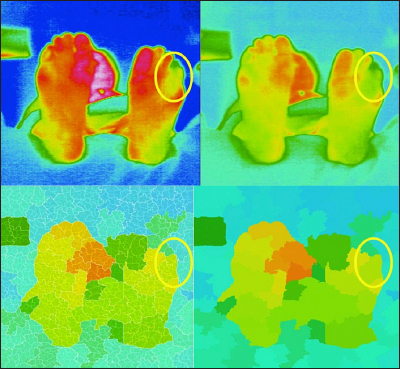
Another example of atypical pattern (left foot). Upper left, thermography; upper right, adjusted thermography; lower left, segmented thermography with sub-boundaries; and lower right, segmented thermography.
Table 2.
Variations of the Plantar Forepart Thermographic Patterns
| Control group (n = 64) | DM group (n = 258) | ||||
| Subjective21 | Proposed | Subjective21 | Proposed | ||
| Type 1 | (butterfly) | 31 | 28 | 60 | 31 |
| Type 2 | (whole high) | 15 | 12 | 120 | 118 |
| Type 3 | (inverse butterfly) | 0 | 0 | 4 | 0 |
| Type 4 | (inner high) | 2 | 2 | 27 | 18 |
| Type 5 | (whole low) | 0 | 0 | 14 | 17 |
| Type 6 | (forefoot low) | 0 | 5 | 0 | 11 |
| Type 7 | (tiptoe low) | 0 | 0 | 0 | 3 |
| Atypical | (anomaly) | 16 | 17 | 33 | 60 |
| Total | 64 | 64 | 258 | 258 | |
To inspect whether the thermographic pattern of the plantar forepart reflects circulatory status, values of ABI and TBI between the subgroups of the DM group were compared. The first subgroup is type 2+4 subgroup that consists of patterns (whole-high pattern and inner-high pattern) having relatively higher temperature in the plantar forepart. The second subgroup includes the rest patterns. The ABI was significantly higher (p < .001) in the type 2+4 subgroup (1.16 ± 0.14) than in the other groups (1.05 ± 0.23). The TBI was also significantly higher (p < .01) in the type 2+4 subgroup (0.73 ± 0.16) than in the other groups (0.67 ± 0.19). We also compared the values of ABI and TBI of the DM subgroup type 2+4 with the DM subgroup type 1+5+6+7, excluding atypical patterns. The ABI was significantly higher (p < .01) in the type 2+4 subgroup than in the type 1+5+6+7 group (1.08 ± 0.17). The TBI was also significantly higher (p = .025) in the type 2+4 subgroup than in the type 1+5+6+7 group (0.67 ± 0.17). The type 2+4 subgroup was 63.6%, 72.6%, 80.8%, and 87.5% in IWGDF (International Working Group on the Diabetic Foot) classification groups 0, 1, 2, and 3, respectively. Also, atypical patterns were found 18.2%, 29.8%, 30.8%, and 50% in IWGDF classification groups 0, 1, 2, and 3, respectively.
Discussion
The present study is the first to show objectively the wider variation of the characteristics of plantar thermographic patterns in patients with DM compared with those in the nondiabetic control subjects using a newly developed computer-based classification system. Furthermore, the system revealed that the two most frequent categories are type 1 typical “butterfly pattern” and type 2 that may represent the condition that both medial plantar artery and lateral plantar artery angiosomes are intact, and the frequency is reverse between the control group and the DM group, which may reflect chronic temperature elevation in neuropathic feet.11–13,19, 20
Thermography of the control group revealed that type 1 and type 2 categories were representative of normal feet. Among the 17 “atypical” feet in the control group, 4 feet from two subjects were characterized by having high temperature in the hallux. High temperature in most toes was observed in the other 4 feet from the two subjects. These high-temperatured 8 atypical feet are the same as those in our previous study.21 Again, we think that the high temperatures in these 8 feet are caused by arterial anatomical variation because the thermographic images were similar to type 1 “butterfly pattern.” Irregular temperature elevation of the toe was observed in 6 feet from five subjects. Four feet from four other subjects had hot spots that can be interpreted as latent inflammation as we reported.17, 21 The majority (77%) of the plantar forepart thermographic patterns of patients with DM could be allocated to six categories. This can be interpreted as irregularity of blood supply. A considerable number of the DM feet were allocated to types 4 and 5, which may suggest stenosis of lateral plantar artery. Among the 60 atypical feet in the DM group, 23 feet were probably due to latent inflammation as in our previous report.6
The gold standards for estimating blood flow are ABI for the lower leg and TBI for the toe. In this study, the TBI was significantly lower in the DM group than in the control group. This may be reflecting decreased blood supply in the distal part in the DM group. This hypothesis is supported by the finding that TBI was lower in the type 1+5+6+7 subgroup than in the type 2+4 subgroup within the DM group. The finding that both ABI and TBI were higher in the type 2+4 subgroup within the DM group suggests the possibility of angiopathy screening by plantar thermo-graphy patterns.
This study has several limitations. Some bias of variations might exist in the nondiabetic control group because the number of subjects was small. Age and sex were not matched in the control group, and this may cause some difficulty in interpreting the data. Another limitation of this study is that our novel computer-based classification concentrated on the forepart of thermography patterns. Also, association between risk of diabetic foot ulcers overall and our new classification was not analyzed precisely. As described in the previous article,21 20 categories may be too complicated for clinical use. We opined that distinction of the six subtypes of the distal area might be sufficient for providing information for screening an indication of diabetic foot. With the knowledge that the distal area is a frequent area of callus formation, even the forepart classification contributes to diabetic foot assessment and prevention. The observation of thermographic patterns and its type classification should help to appraise comprehensive vascular abnormality of the foot and to determine the frequency of check-ups based on the state of neuropathy, callus/corn formation, ulcers, and foot deformity.
Conclusions
A new objective computer-based classification system of plantar thermographic patterns is realized. The system utilizes an image segmentation method developed based on a medoid shift clustering algorithm and categorizes the distal forepart of the plantar thermographic patterns objectively. In the nondiabetic group, more than 62% of the plantar forepart thermographic patterns of feet were allocated to the two typical categories, whereas 77% of the patterns of the group of patients with DM were variously allocated to six categories. The thermographic patterns found by the new objective computer-based system were similar to those found in our previous subjective work, which found three forepart patterns in the nondiabetic controls and five in the patients with DM. Forefoot-low pattern and tiptoe-low pattern were newly found by the classification system. This is the first study to show wider variations in the patients with DM than in the nondiabetic control subjects in an objective way. The system based on IR thermography will be extended to be a screening tool to assess circulatory status in daily foot care of patients with DM.
Glossary
- (ABI)
ankle brachial index
- (DM)
diabetes mellitus
- (IR)
infrared
- (TBI)
toe brachial index
Funding
This work was partly supported by a grant-in-aid for Scientific research from MEXT (the Ministry of Education, Culture Sports, Science, and Technology) to Miho Oba and Hiromi Sanada (No. 21659507) and to Hiromi Sanada and colleagues (No. 23249088).
References
- 1.International Working Group on the Diabetic Foot. Amsterdam: International Working Group on the Diabetic Foot; 2007. The international consensus on the management and prevention of the diabetic foot. [Google Scholar]
- 2.Apelqvist J, Bakker K, van Houtum WH, Schaper NC. International Working Group on the Diabetic Foot (IWGDF) Editorial Board. Practical guidelines on the management and prevention of the diabetic foot: based upon the International Consensus on the Diabetic Foot (2007) Prepared by the International Working Group on the Diabetic Foot. Diabetes Metab Res Rev. 2008;(24 Suppl 1):S181–S187. doi: 10.1002/dmrr.848. [DOI] [PubMed] [Google Scholar]
- 3.Singh N, Armstrong DG, Lipsky BA. Preventing foot ulcers in patients with diabetes. JAMA. 2005;293(2):217–228. doi: 10.1001/jama.293.2.217. [DOI] [PubMed] [Google Scholar]
- 4.Frykberg RG, Zgonis T, Armstrong DG, Driver VR, Giurini JM, Kravitz SR, Landsman AS, Lavery LA, Moore JC, Schuberth JM, Wukich DK, Andersen C, Vanore JV. American College of Foot and Ankle Surgeons. Diabetic foot disorders. A clinical practice guideline(2006 revision) J Foot Ankle Surg. 2006;45(5 Suppl):S1–S66. doi: 10.1016/S1067-2516(07)60001-5. [DOI] [PubMed] [Google Scholar]
- 5. Nabuurs-Franssen MH, Huijberts MS, Nieuwenhuijzen Kruseman AC, Willems J, Schaper NC. Health-related quality of life of diabetic foot ulcer patients and their caregivers. Diabetologia. 2005;48(9):1906–1910. doi: 10.1007/s00125-005-1856-6. [DOI] [PubMed] [Google Scholar]
- 6.Wild S, Roglic G, Green A, Sicree R, King H. Global prevalence of diabetes: Estimates for the year2000 and projections for 2030. Diabetes Care. 2004;27(5):1047–1053. doi: 10.2337/diacare.27.5.1047. [DOI] [PubMed] [Google Scholar]
- 7.Bharara M, Cobb JE, Claremont DJ. Thermography and thermometry in the assessment of diabetic neuropathic foot: a case for furthering the role of thermal techniques. Int J Low Extrem Wounds. 2006;5(4):250–260. doi: 10.1177/1534734606293481. [DOI] [PubMed] [Google Scholar]
- 8.Armstrong DG, Lavery LA, Liswood PJ, Todd WF, Tredwell JA. Infrared dermal thermometry for the high-risk diabetic foot. Phys Ther. 1997 Feb;77(2):169–177. doi: 10.1093/ptj/77.2.169. [DOI] [PubMed] [Google Scholar]
- 9.Lavery LA, Higgins KR, Lanctot DR, Constantinides GP, Zamorano RG, Armstrong DG, Athanasiou KA, Agrawal CM. Home monitoring of foot skin temperatures to prevent ulceration. Diabetes Care. 2004;27(11):2642–2647. doi: 10.2337/diacare.27.11.2642. [DOI] [PubMed] [Google Scholar]
- 10.Armstrong DG, Holtz-Neiderer K, Wendel C, Mohler MJ, Kimbriel HR, Lavery LA. Skin temperature monitoring reduces the risk for diabetic foot ulceration in high-risk patients. Am J Med. 2007;120(12):1042–1046. doi: 10.1016/j.amjmed.2007.06.028. [DOI] [PubMed] [Google Scholar]
- 11.Brem H, Sheehan P, Rosenberg HJ, Schneider JS, Boulton AJ. Evidence-based protocol for diabetic foot ulcers. Plast Reconstr Surg. 2006;117(7 Suppl):193S–211S. doi: 10.1097/01.prs.0000225459.93750.29. [DOI] [PubMed] [Google Scholar]
- 12.Chan AW, MacFarlane IA, Bowsher DR. Contact thermography of painful diabetic neuropathic foot. Diabetes Care. 1991;14(10):918–922. doi: 10.2337/diacare.14.10.918. [DOI] [PubMed] [Google Scholar]
- 13.Sun PC, Lin HD, Jao SH, Chan RC, Kao MJ, Cheng CK. Thermoregulatory sudomotor dysfunction and diabetic neuropathy develop in parallel in at-risk feet. Diabet Med. 2008;25(4):413–418. doi: 10.1111/j.1464-5491.2008.02395.x. [DOI] [PubMed] [Google Scholar]
- 14.Kang PB, Hofman SN, Krimitsos E, Rutkove SB. Ambulatory foot temperature measurement: A new technique in polyneuropathy evaluation. Muscle Nerve. 2003;27(6):737–742. doi: 10.1002/mus.10379. [DOI] [PubMed] [Google Scholar]
- 15.Roback K, Johansson M, Starkhammar A. Feasibility of a thermographic method for early detection of foot disorders in diabetes. Diabetes Technol Ther. 2009;11(10):663–667. doi: 10.1089/dia.2009.0053. [DOI] [PubMed] [Google Scholar]
- 16.Lavery LA, Higgins KR, Lanctot DR, Constantinides GP, Zamorano RG, Athanasiou KA, Armstrong DG, Agrawal CM. Preventing diabetic foot ulcer recurrence in high-risk patients: use of temperature monitoring as a self-assessment tool. Diabetes Care. 2007;30(1):14–20. doi: 10.2337/dc06-1600. [DOI] [PubMed] [Google Scholar]
- 17.Nishide K, Nagase T, Oba M, Oe M, Ohashi Y, Iizaka S, Nakagami G, Kadowaki T, Sanada H. Ultrasonographic and thermographic screening for latent inflammation in diabetic foot callus. Diabetes Res Clin Pract. 2009;85(3):304–309. doi: 10.1016/j.diabres.2009.05.018. [DOI] [PubMed] [Google Scholar]
- 18.Bharara M, Schoess J, Nouvong A, Armstrong DG. Wound inflammatory index: a “proof of concept” study to assess wound healing trajectory. J Diabetes Sci Technol. 2010;4(4):773–779. doi: 10.1177/193229681000400402. [DOI] [PMC free article] [PubMed] [Google Scholar]
- 19.Sun PC, Lin HD, Jao SH, Ku YC, Chan RC, Cheng CK. Relationship of skin temperature to sympathetic dysfunction in diabetic at-risk feet. Diabetes Res Clin Pract. 2006;73(1):41–46. doi: 10.1016/j.diabres.2005.12.012. [DOI] [PubMed] [Google Scholar]
- 20.Stess RM, Sisney PC, Moss KM, Graf PM, Louie KS, Gooding GA, Grunfield C. Use of liquid crystal thermography in the evaluation of the diabetic foot. Diabetes Care. 1986;9(3):267–272. doi: 10.2337/diacare.9.3.267. [DOI] [PubMed] [Google Scholar]
- 21.Nagase T, Sanada H, Takehara K, Oe M, Iizaka S, Ohashi Y, Oba M, Kadowaki T, Nakagami G. Variations of plantar thermographic patterns in normal controls and non-ulcer diabetic patients: novel classification using angiosome concept. J Plast Reconstr Aesthet Surg. 2011;64(7):860–866. doi: 10.1016/j.bjps.2010.12.003. [DOI] [PubMed] [Google Scholar]
- 22.Taylor GI, Palmer JH. The vascular territories (angiosomes) of the body: Experimental study and clinical applications. Br J Plast Surg. 1987;40(2):113–141. doi: 10.1016/0007-1226(87)90185-8. [DOI] [PubMed] [Google Scholar]
- 23.Attinger CE, Evans KK, Bulan E, Blume P, Cooper P. Angiosomes of the foot and ankle and clinical implications for limb salvage: reconstruction, incisions, and revascularization. Plast Reconstr Surg. 2006;117(7 Suppl):261S–293S. doi: 10.1097/01.prs.0000222582.84385.54. [DOI] [PubMed] [Google Scholar]
- 24.Lázaro-Martínez JL, Aragón-Sánchez FJ, Beneit-Montesinos JV, González-Jurado MA, García Morales E, Martínez Hernández D. Foot bio-mechanics in patients with diabetes mellitus: doubts regarding the relationship between neuropathy, foot motion, and deformities. J Am Podiatr Med Assoc. 2011;101(3):208–214. doi: 10.7547/1010208. [DOI] [PubMed] [Google Scholar]
- 25.Murray HJ, Young MJ, Hollis S, Boulton AJ. The association between callus formation, high pressures and neuropathy in diabetic foot ulceration. Diabet Med. 1996;13(11):979–982. doi: 10.1002/(SICI)1096-9136(199611)13:11<979::AID-DIA267>3.0.CO;2-A. [DOI] [PubMed] [Google Scholar]
- 26.Comaniciu D, Meer P. Mean shift: a robust approach toward feature space analysis. IEEE Trans Pattern Analysis Machine Intelligence. 2002;24(5):603–619. [Google Scholar]
- 27.Fukunaga K, Hostetler L. The estimation of the gradient of a density function, with applications in pattern recognition. IEEE Trans Information Theory. 1975;21(1):32–40. [Google Scholar]
- 28.Sheikh Y, Khan EA, Kanade T. Mode-seeking by medoidshifts. Proceedings of IEEE 11th International Conference on Computer Vision. 2007:1–8. [Google Scholar]
- 29.Vedaldi A, Soatto S. Quick shift and kernel methods for mode seeking. Lecture Notes Computer Sci. 2008;5305:705–718. [Google Scholar]
- 30.Norgren L, Hiatt WR, Dormandy JA, Nehler MR, Harris KA, Flowkes FG. TASC II Working Group. Inter-society consensus for the management of peripheral arterial disease (TASC II) J Vasc Surg. 2007;(45 Suppl S):S5–S67. doi: 10.1016/j.jvs.2006.12.037. [DOI] [PubMed] [Google Scholar]


