

Abstract
Background
Glucose monitoring systems using subcutaneously inserted sensors are currently labeled for up to 7 days of wear. In this study, we evaluated the feasibility of a 14-day wear duration using a modified version of the sensor found in the Freestyle Navigator™ continuous glucose monitoring system.
Methods
Sixty-two subjects with diabetes were enrolled in the study. One sensor per subject was inserted on the arm for a wear time of 14 days. Two different calibration algorithms were applied retrospectively, one that uses periodic sensor recalibrations and one without recalibrations. Sensor in vivo stability was determined by least square regression analysis using capillary blood glucose. Mean absolute relative difference (MARD) and mean relative difference were calculated. Consensus error grid analysis was performed by day and over the 14-day wear period to evaluate accuracy of both systems. The sensor insertion sites were inspected after sensor removal for skin reactions.
Results
Sensor data from 55 subjects were used for the analysis. The accuracy metrics for the system with recalibration were calculated to MARD = 13.9% and 84.0% in zone A (error grid analysis). The system without recalibration performed significantly better, resulting in MARD of 12.2% and 88.0% in zone A (p < .0001). The maximum change of in vivo sensor sensitivity over the 14-day wear period was 2% per day. Two subjects reported pain during the first 5 days of sensor wear, and 1 subject reported itching at the sensor site. No further skin reactions were noticed.
Conclusions
The study shows that a 14-day sensor wear period is achievable. Moreover, sensors using “wired enzyme” technology showed excellent in vivo stability, with no significant sensitivity loss over the 14-day wear period.
Keywords: diabetes, glucose monitoring, sensor wear duration, subcutaneous
Introduction
The first commercially available subcutaneous glucose monitoring systems were labeled for up to 3 days of sensor wear.1 Next-generation sensors then extended the wear time to a maximum of 7 days.2 Extending sensor wear time can help to reduce cost as well as increase convenience by reducing the frequency of sensor insertion. There have been studies that have demonstrated successful use of a single subcutaneous glucose monitoring system beyond 7 days, such as a case study where one subject wore a sensor for 28 days.3 Another case study reported on a 10-day wear with 30 subjects with type 1 diabetes.4 However, to our knowledge, there has not been any published clinical study to date that demonstrated viability of a longer-term wear (2 weeks or more) in human subjects. It is generally believed that the presence of the sensor in the tissue may stimulate biofouling, usually associated with the loss of nominal sensor function.5,6 Various efforts are directed toward applying passive or active coatings to the sensor to mitigate this effect.7,8 However, when trying to understand sensor drift in vivo, it is difficult to separate the contributing components such as instability of sensor chemistry and immune response. Because different sensor types use different materials and geometries, data from the literature cannot be used to predict the in vivo stability of a specific sensor system. Therefore, to understand the performance of our prototype sensor for prolonged wear duration, we performed a clinical study over a 14-day wear period.
Methods
Sensor System
The sensor used in this study is a modified version of a sensor described previously.9 It has been designed to provide signal stability for 14 days of use. It consists of a three-electrode system polarized at 40 mV versus a silver-silver chloride reference electrode. Glucose oxidase together with a proprietary redox mediator is deposited on the working electrode to allow for selective glucose oxidation and electron transport to the electrode (“wired enzyme” technology). An outer membrane limits the glucose flux to the sensor and forms the interface to the tissue. The width of the sensor is 0.3 mm. All sensors were inserted by clinical personnel using a manually operated insertion device. The sensor is connected to a transmitter that transmits raw sensor data and temperature values every minute to a handheld receiver. The receiver stores the data and can be downloaded to a personal computer for data processing.
In Vitro Sensor Testing
Sensors from the sensor lot used in the clinical study were tested in vitro for glucose response and drift. Sensors were submerged in phosphate-buffered saline solution (20 mM) at 37 °C temperature, and glucose was added to achieve concentrations of 1, 2, 3, 5, 7, 10, 15, 20, 25, and 30 mM glucose. The sensor sensitivity was calculated by linear regression of sensor signal over glucose concentration. Sensors were then kept in phosphate-buffered saline solution at 33 °C temperature and 17 mM glucose to simulate typical in vivo environment for 14 days. Afterward, the sensors were again exposed to the same sequence of glucose concentrations as before the drift testing, and their postdrift sensitivity was calculated.
Clinical Study
A total of 62 subjects were enrolled and evaluated at one study center in the United States (Diablo Clinical Research, Walnut Creek, CA). The study population consisted of 50 subjects with type 1 diabetes and 12 subjects with type 2 diabetes (Table 1). Each subject wore one sensor inserted in the arm. Sensors were replaced immediately within the first hour if an unsuccessful sensor insertion was confirmed by a low sensor signal check. During home wear periods, the subjects were asked to perform at least eight blood glucose (BG) finger-stick tests each day using a FreeStyle Lite® BG meter (Abbott Diabetes Care, Alameda, CA).
Table 1.
Subject Characteristics in the Clinical Study
| Number | % | |
| Gender | ||
| Female | 27 | 44 |
| Male | 35 | 56 |
| Race | ||
| Caucasian | 55 | 89 |
| Non-Caucasian | 7 | 11 |
| Age (years) | ||
| 18–34 | 13 | 21 |
| 35–54 | 21 | 34 |
| ≥55 | 28 | 45 |
| Diabetes type | ||
| Type 1 | 50 | 81 |
| Type 2 | 12 | 19 |
| BMI | ||
| <25.0 | 24 | 39 |
| 25.0–29.9 | 17 | 27 |
| ≥30 | 21 | 34 |
In addition to the enrollment visit, there were in-clinic visits where potential adverse events could be addressed accordingly. Any symptoms associated with the sensor insertion site were documented and classified by severity as mild, moderate, or severe. Examples of potential signs and symptoms observed and evaluated at the sensor insertion site include swelling, redness, bruising, rash, skin discoloration, lump, bleeding, pain, skin irritation, or laceration.
The in-clinic visits are also used to back up the raw sensor data upload throughout the study. The sensor signals together with temperature information were transmitted to a receiver and stored at a frequency of one value per minute. No real-time glucose information was displayed to the subject during the study. If necessary, an overbandage was applied to the transmitter (IV3000, Smith & Nephew Ltd., London, UK) to keep it attached to the skin. At the end of the sensor wear time, the data were downloaded for the last time from the receiver for further processing. All subjects gave informed consent prior to the study.
Data Exclusion
Sensor data from subjects who withdrew before study completion were not included in the analysis. Sensors with less than 10 pairable sensor–reference BG points throughout the sensor wear duration were excluded.
Glucose Calculation
To evaluate the feasibility of a 14-day sensor wear, two glucose calculation cases differing in their calibration methods were compared. The first case extends the standard periodic in vivo calibration (i.e., “with recalibra-tion”), while the second case requires only one calibration factor for the entire sensor wear duration (i.e., “without recalibration”).
The case with recalibration is an extension of the realtime method used in the FreeStyle Navigator Continuous Glucose Monitoring System with TRUStart Algorithm™.10 In particular, extra calibrations at 5, 7, 9, 11, and 13 days since sensor start are added.
For the second case, a single calibration factor was determined and applied retrospectively to the raw sensor data throughout the entire wear duration, after allowing for a 1 h run-in time. This single sensor calibration factor was calculated for each sensor from the median of the individual sensitivity values (sensor signal divided by capillary BG). All paired BG reference points following the first hour post sensor insertion up to the end of the sensor wear period were used for this calculation.
Data Analysis
In vitro sensor sensitivity was derived from the least square linear regression slope of sensors tested at multiple glucose concentrations. The drift of the in vitro sensitivity was assessed by comparing sensor sensitivity before and after a 14-day in vitro test at fixed glucose concentration using paired t-test.
The stability of the in vivo sensitivity was examined by fitting a least square linear regression slope to individual sensor sensitivities values and the elapsed time since sensor start. For the individual sensor stability analysis, only sensors with data beyond 5 days were used, and reference BGs below 60 mg/dl were excluded to minimize the impact of BG measurement error. The calculated slope is reported as a percentage change over time and is a measure for the total 14-day in vivo sensor drift.
To evaluate the day-by-day changes in sensitivity over the course of the sensor wear, per-day normalized sensitivity values were calculated and analyzed (median and percentiles). Sensor sensitivities were normalized to the start of each sensor.
Clinical accuracy was examined by consensus error grid analysis. Quantitative accuracy was assessed using the mean absolute relative difference (MARD) and the mean relative difference (MRD) between the sensor output and reference BG measurements. The difference in MARD and percentage in zone A of consensus error grid of the two calibration methods was compared by paired t-test. The by-day variation in accuracy metrics was tested using analysis of variance.
Analyses were performed using SAS version 9.2 (SAS Institute, Cary, NC).
Results
A total of 62 subjects were initially enrolled in this study. Subject characteristics are summarized in Table 1. Three subjects were excluded because either they did not attend the scheduled insertion visits or because they withdrew from the study before completing the 14-day sensor wear. One subject was excluded because the receiver was out of the transmitter signal range for the first 3 days. Data from 1 subject were excluded because a low and non-glucose-correlated signal in the first 2 days of sensor wear indicated incomplete sensor insertion.
The criterion that data sets required more than 10 pairable sensor/reference points in total resulted in the removal of data from 2 subjects. Data from 55 subjects were included in this analysis. The survivability plot of the raw sensor data from these 55 subjects is shown in Figure 1. Some of the sensors did not provide data for the full 14 days. Case report form data noting the premature detachment of the sensor mount from the body as well as a sudden signal drop below a predetermined threshold provide evidence that these sensors were dislodged from the body most likely because of skin adhesive failure. Almost 80% of the sensors provided glucose measurements up to 14 days, and the total average wear duration was 12.5 days (Figure 1).
Figure 1.
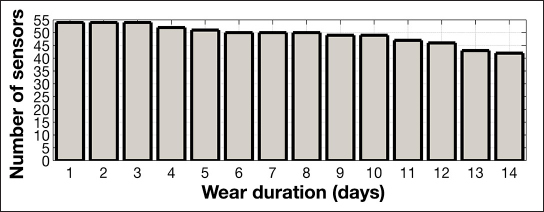
Survivability plot of sensor data beyond the 1 h warm-up time.
Sensor (n = 32) in vitro stability was assessed over a 14-day period in 17 mM glucose solution. The sensor response to different glucose concentrations was 0.78 nA/mM before drift testing and 0.76 nA/mM after drift testing, resulting in a total sensor drift of 2.6% over the 14-day period or an average drift of 0.2% per day (Figure 2).
Figure 2.
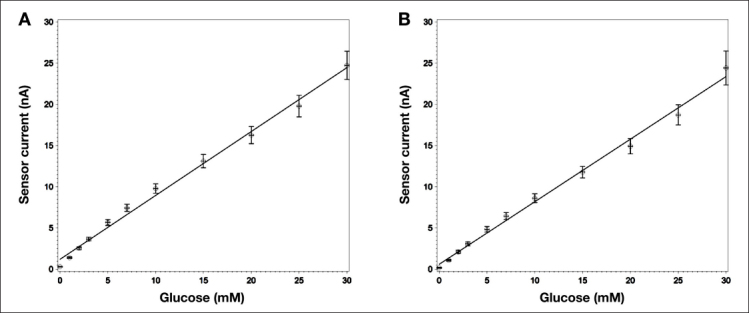
In vitro sensitivity of sensors tested under ambient conditions at 37 °C (A) before and (B) after 14-day in vitro constant glucose concentration test. Least square regression results in an average slope of 0.78 nA/mM before and 0.76 nA/mM after the 14-day test. Error bars represent the standard deviation of the measurements (n = 32).
Figure 3 shows an example of 14-day sensor data with BG reference values. Both, data with and without recalibration cases are presented. The upper chart shows the complete 14-day data, while the lower charts show the data from the first two and last two days of sensor wear, respectively.
Figure 3.
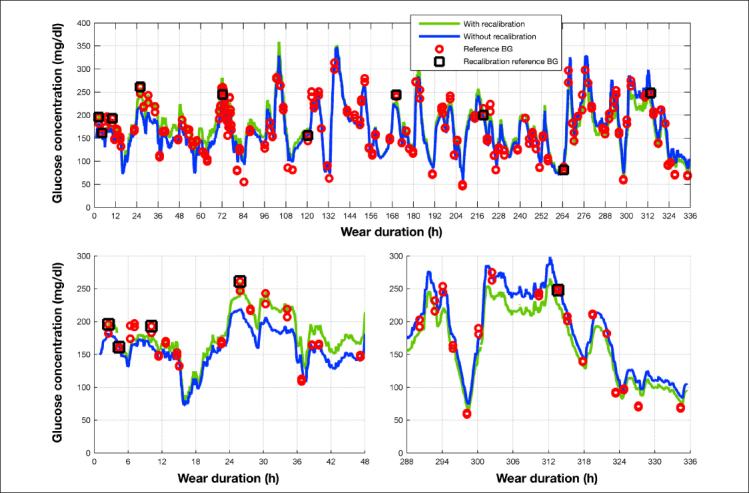
Example sensor output over the 14-day wear duration. Sensor outputs for both with and without recalibration cases are compared against reference BG values. For the with-recalibration case, reference BG values used for recalibration are shown as grey rectangles. The bottom left and right charts show the first and last two days of sensor wear.
Table 2 describes the distribution of the reference BG values for all subjects over the different glucose ranges. The ranges were chosen based on the glucose bins specified in DIN EN ISO15197:2013.11
Table 2.
Distribution of Capillary Reference Blood Glucose Values from the Study Binned According to DIN EN ISO15197:201311
| Glucose distribution | BG reference | |
| N | % | |
| 1: ≤50 mg/dl | 211 | 2.1 |
| 2: >50–80 mg/dl | 852 | 8.5 |
| 3: >80–120 mg/dl | 1997 | 20.0 |
| 4: >120–200 mg/dl | 4198 | 41.9 |
| 5: >200–300 mg/dl | 2269 | 22.7 |
| 6: >300–400 mg/dl | 389 | 3.9 |
| 7: >400 mg/dl | 92 | 0.9 |
In Figure 4, the individual paired points (sensor signal/BG measurement) are shown pooled per day and normalized to the values at the time of sensor start.
Figure 4.
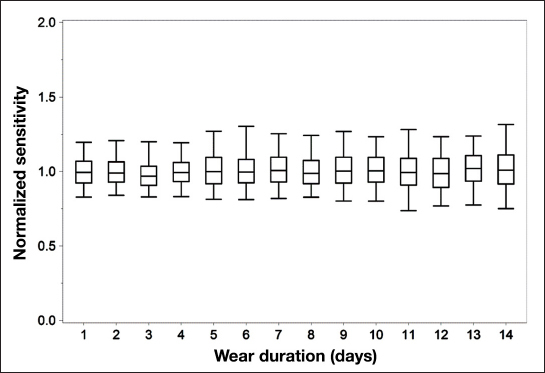
Normalized (to sensor initial sensitivity) in vivo sensitivity values of individual paired points plotted by day. Uppermost and lowermost lines correspond to the 95th and 5th percentiles, respectively. Middle bands correspond to the upper, median, and lower quartile lines, respectively.
Table 3 summarizes the results of the consensus error grid analysis shown in Figure 5 for both data with and data without recalibration.
Table 3.
Consensus Error Grid Results for the Cases with and without Recalibration
| With recalibration | Without recalibration | |
| Zone A (%, N) | 84.0, 7803 | 88.0, 8812 |
| Zone B (%, N) | 14.2, 1322 | 10.6, 1058 |
| Zone C (%, N) | 1.7, 158 | 1.4, 136 |
| Zone D (%, N) | 0.0, 3 | 0.0, 2 |
| Zone E (%, N) | 0.0, 0 | 0.0, 0 |
| Total (N) | 9286 | 10,008 |
Figure 5.
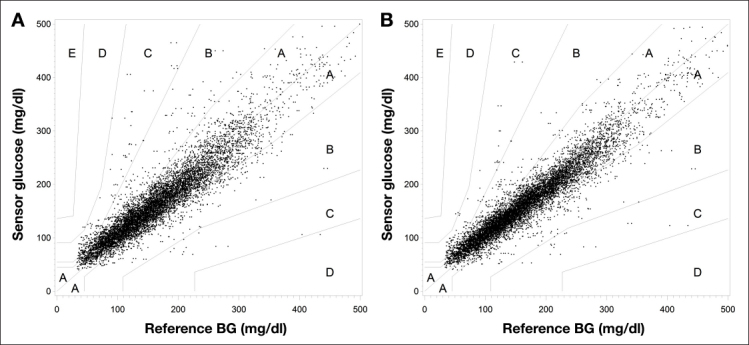
Consensus error grid analysis plots for the cases (A) with recalibration and (B) without recalibration.
With recalibration, 84.0% are in the zone A of the consensus error grid, with an overall MARD of 13.9%. The system without recalibration achieved an MARD of 12.2%, with 88.0% of the paired points in zone A of the consensus error grid. The method without recalibration performed significantly better than the one with recalibration (p < .0001 for both in zone A and MARD).
To evaluate the system accuracy throughout the wear time, the MRD, MARD, and percentage of points in zone A of the consensus error grid were calculated per day. The daily aggregate values for the systems with and without recalibration are summarized in Figure 6. No significant difference was found in MARD, MRD, and percentage in zone A results between days, except for MRD results with recalibration (p < .0001).
Figure 6.
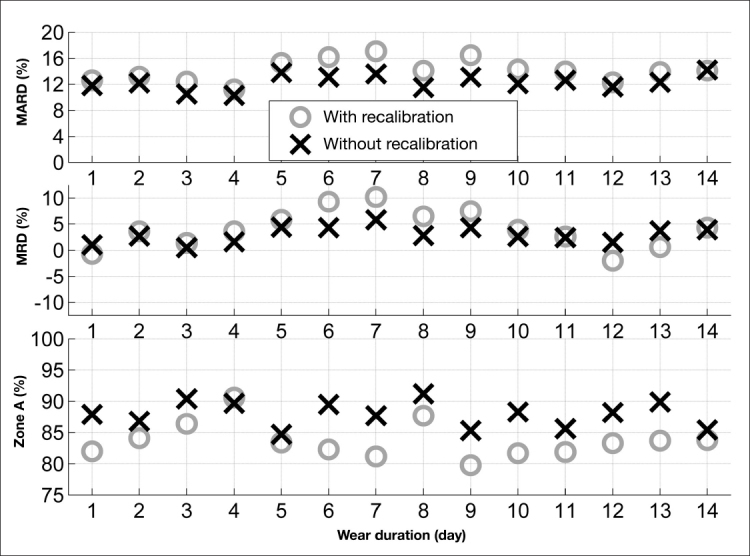
Comparison of MARD, MRD, and percentage of points in zone A of the Consensus error grid analysis by day between the cases with (o) and without (×) recalibration.
Figure 7 shows a histogram of the individual sensor sensitivity changes. All sensors are within a ±2% drift per day range, and more than 80% are within a ±1% drift per day range.
Figure 7.
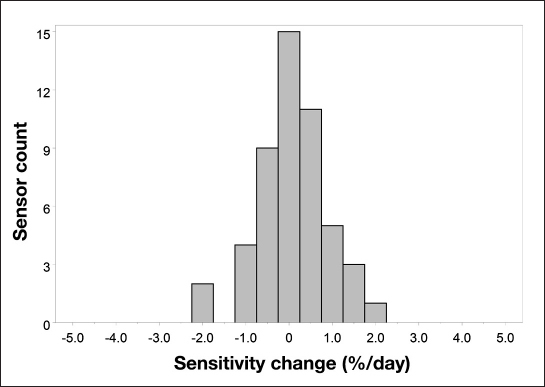
Histogram of in vivo sensor sensitivity drift.
Examination of the sensor site during the study and after sensor removal did not show any unexpected skin reaction (Table 4). Two subjects reported pain during the study, which resulted in sensor removal for one of the subjects. One subject reported itching at the sensor site but decided to continue the study.
Table 4.
Summary of Sensor Insertion Site Examinationa
| Symptoms | Number of observations |
| Pain | 2 |
| Itching | 1 |
| Erythema | 0 |
| Edema | 0 |
| Rash | 0 |
| Induration | 0 |
| Bruising | 0 |
| Bleeding | 0 |
| Other | 0 |
Bleeding caused by sensor insertion is not included.
Discussion
Commercially available continuous glucose monitors have limitations with respect to the maximum wear duration. At this time, the longest approved wear duration is for 7 days.2
There are two main factors that need to be considered when extending wear duration for subcutaneously implanted glucose sensors: first, the sensor itself needs to provide chemistry that is stable for the wear duration and, second, the interaction of the body with the sensor should not lead to a significant change in sensor response (biofouling). The sensor in vitro stability is a result of the fundamental sensor design. In this study, we demonstrated that sensors designed with “wired enzyme” technology are stable for a 14-day period when tested in vitro. No significant change in signal level and linearity to glucose response has been observed (Figure 2).
The required degree of in vivo stability depends on the calibration method. For example, if a calibration algorithm asks for a recalibration every 12 h, the signal drift cannot exceed a clinically relevant signal change within 12 h. At the extreme, if no recalibrations are required or if no in vivo calibrations are needed at all (sensor factory calibration), the sensor will have to provide a stable signal over the whole wear period. We evaluated the performance of the system for both cases: analysis with and without recalibration.
For the case with recalibration, a recalibration every 2 days is applied, based on the standard calibration schedule for the FreeStyle Navigator continuous glucose monitoring system with TRUStart Algorithm,10 a 5-day wear system with a 1 h run-in time and scheduled calibrations at 1, 2, 10, 24, and 72 h since sensor insertion. Each calibration requires a single finger-stick reference BG measurement. The applied calibration factor is a result of the past two requested finger-stick calibrations, and each calibration beyond the first day of wear remains effective for 2 days (e.g., the 24th-hour calibration applies to day 2 and 3 sensor output, and the 72nd-hour calibration applies to day 4 and day 5 sensor output). In our retrospective analysis, we extended the recalibration interval to cover 14 days (i.e., calibrations at 5, 7, 9, 11, and 13 days since sensor start). We demonstrated that our sensor system provides high accuracy12,13 when recalibrations are applied every 2 days (Figure 5A, Table 3).
Periodic readjustment of the sensor’s calibration factor using strip-based BG measurements can mitigate sensor stability issues, as was indicated in a DirecNet study using early generation subcutaneous glucose monitoring systems.14 However, errors in the BG reading and sensor signal at the time of calibration can affect the glucose output. For example, a lag time in the sensor signal that is typically of the order of 5 to 15 min10,15 may lead to significant calibration errors if not accounted for properly when pairing a calibration BG value with the sensor signal. In this context, periodic calibration is a balanced tradeoff between detecting sensor system faults and incurring systematic error from one or more BG reading/sensor signal calibration points. With a more pronounced in vivo drift, the merits of more frequent BG-based calibrations increase. Conversely, as the errors in BG reading/sensor signal pairings increase (e.g., by improper finger-stick method or the use of a BG meter with inconsistent accuracy levels16), the benefit of more frequent BG-based calibrations decreases.
This means that, for sensors with stable in vivo response, the optimal result may be achieved by not recalibrating at all. Therefore, we also retrospectively evaluated how the sensor performs under the assumption that only one calibration factor is assigned to a sensor (representing, e.g., one initial calibration at the beginning of sensor wear or factory calibration) and no recalibrations are being applied. The median of the in vivo sensitivities from sensor–BG pairings obtained throughout the entire wear period was used as the calibration factor for each sensor. This represents a best case scenario, and the resulting accuracy statistics have to be evaluated with this in mind. Obviously, a real-life implementation will depend on determining the single calibration factor using BG measurement at the beginning of sensor wear. Errors in this calibration process will get carried forward throughout sensor life. Alternatively, the calibration factor may be determined prospectively during the manufacturing process (factory calibration). The feasibility of this approach needs to be shown. Nevertheless, the methodology of applying a retrospectively determined single sensor specific calibration factor to every sensor is a good means for analyzing the consistency of sensor response throughout the wear period.
The data show that recalibration of the sensor signal did not improve the accuracy of the system. To the contrary, the accuracy achieved with the best-case one-time calibration is slightly, but with statistical significance, better than the system with recalibration. In Table 3 and Figure 5, the results for the consensus error grid analysis are summarized. The total number of paired points is larger for the case without recalibration since the calibration algorithm used in the FreeStyle Navigator continuous glucose monitoring system does, if sensor instability is detected during the first 10 h of sensor wear, exclude data from display. In the system without recalibration, this data exclusion was not performed. For both cases, no trend of deteriorating accuracy can be seen over the 14-day sensor wear period (Figure 6). The analysis of the by-day accuracy metrics shows that, only for the MRD of the system with recalibration, there is a statistically significant difference between days (p < .001). This shows again that calibration with finger sticks can actually reduce the overall system accuracy when the sensor has good intrinsic in vivo stability. Figure 7 shows a histogram of the individual sensor drift over the 14-day period. From this, it can be seen that the signal stability is reflected not only in the overall average calculations but also in the individual sensor data. All drift values are equal or less than 2% per day. These data are supported by Figure 4, where the changes in sensor sensitivities are shown when the data are normalized at time of sensor start.
The results of this study confirm that the coating material used as outer glucose limiting membrane17 is biocompatible and not prone to the often-described biofouling process.5 The data also show that, with the sensor used in this study, it is not necessary to include substances into the sensor to alter the body response (e.g., anti-inflammatories) to achieve a stable sensor response out to 14 days of wear. The in vivo signal stability is a requirement for a sensor that may not require any finger sticks to operate, often also referred to as factory calibration.9 The excellent accuracy data obtained in this study with only one calibration factor used per sensor gives a strong indication that factory calibration is possible for a 14-day sensor.
There were no adverse events related to the sensor insertion or the study in general. At the end of each sensor wear and after sensor removal, the sensor site was examined. One subject withdrew from the study after reporting pain in the site insertion within 6 days of wear. Of the 55 subjects in this analysis, a total of three symptoms were observed, but no medical intervention was required (Table 4). One subject reported itching on the sensor site after 11 days of sensor wear, but continued to wear the sensor until the scheduled removal on day 14. Two subjects reported moderate pain on the sensor site, which started within the first 5 days of sensor wear. One of them experienced pain on the insertion day but noted that pain subsided after a few days and decided to continue wearing the sensor until the scheduled removal on day 14. The other subject experienced pain 2 days after sensor insertion, and the sensor was removed. No symptoms of erythema, edema, rash, induration, bruising, or bleeding during sensor wear were observed.
In order to develop a sensor system lasting up to 14 days, the adhesive needs to be capable of keeping the sensor/ transmitter system on the skin for the wear duration. In this study, we allowed for the application of an overbandage when required, which helped the majority of subjects to extend sensor wear out to 14 days. The robustness of the adhesive and its improvement are outside the scope of this study but have to be addressed if a 14-day sensor will become commercially available. This study was conducted using only the arm as the sensor insertion site. Other potential insertion sites, such as the abdomen, will need to be investigated in the future.
Conclusions
In this study we demonstrated that it is possible to extend the wear duration of subcutaneously inserted sensors out to 14 days. Some contributing factors include “wired enzyme” chemistry that provides the necessary stability in glucose response, and the choice in sensor membrane material that minimizes the impact of the foreign body response leading to no significant changes in sensor response over 14 days of sensor wear. This is a significant step toward developing a factory-calibrated 14-day sensor that does not require any finger sticks.
Acknowledgments
We thank Shridhara Alva, Debi Green, Andrew H. Naegeli, and Junli Ou for their assistance in executing the study and Phu Le, Tahir Khan, Christopher Thomas, and Jean-Pierre Babka for the preparation of the study sensors.
Glossary
- (BG)
blood glucose
- (MARD)
mean absolute relative difference
- (MRD)
mean relative difference
Funding
This work was funded by Abbott Diabetes Care Inc., Alameda, CA.
Disclosures
Udo Hoss, Erwin S. Budiman, and Hanqing Liu are employees of Abbott Diabetes Care. Mark P. Christiansen is an employee of Diablo Clinical Research, Walnut Creek, CA.
References
- 1.Mastrototaro JJ. The MiniMed continuous glucose monitoring system. Diabetes Technol Ther. 2000;(2 Suppl 1):S13–S18. doi: 10.1089/15209150050214078. [DOI] [PubMed] [Google Scholar]
- 2.Bailey T, Zisser H, Chang A. New features and performance of a next-generation seven-day continuous glucose monitoring system with short lag time. Diabetes Technol Ther. 2009;11(12):749–755. doi: 10.1089/dia.2009.0075. [DOI] [PubMed] [Google Scholar]
- 3.Chamberlain JJ, Small D. Case study: successful use of a single subcutaneous continuous glucose monitor sensor for 28 days in a patient with type 1 diabetes. Clin Diabetes. 2008;26(3):138–139. [Google Scholar]
- 4.Garg SK, Voelmle MK, Gottlieb P. Feasibility of 10-day use of a continuous glucose-monitoring system in adults with type 1 diabetes. Diabetes Care. 2009;32(3):436–438. doi: 10.2337/dc08-1745. [DOI] [PMC free article] [PubMed] [Google Scholar]
- 5.Wisniewski N, Moussy F, Reichert WM. Characterization of implantable biosensor membrane biofouling. Fresenius J Anal Chem. 2000;366(6–7):611–621. doi: 10.1007/s002160051556. [DOI] [PubMed] [Google Scholar]
- 6.Klueh U. Analysis: on the path to overcoming glucose-sensor-induced foreign body reactions. J Diabetes Sci Technol. 2013;7(2):452–454. doi: 10.1177/193229681300700222. [DOI] [PMC free article] [PubMed] [Google Scholar]
- 7.Van den Bosch EE, de Bont NH, Qiu J, Gelling OJ. A promising solution to enhance the sensocompatibility of biosensors in continuous glucose monitoring systems. J Diabetes Sci Technol. 2013;7(2):455–464. doi: 10.1177/193229681300700223. [DOI] [PMC free article] [PubMed] [Google Scholar]
- 8.Ward WK, Wood MD, Casey HM, Quinn MJ, Federiuk IF. The effect of local subcutaneous delivery of vascular endothelial growth factor on the function of a chronically implanted amperometric glucose sensor. Diabetes Technol Ther. 2004;6(2):137–145. doi: 10.1089/152091504773731320. [DOI] [PubMed] [Google Scholar]
- 9.Hoss U, Jeddi I, Schulz M, Budiman E, Bhogal C, McGarraugh G. Continuous glucose monitoring in subcutaneous tissue using factory-calibrated sensors: a pilot study. Diabetes Technol Ther. 2010;12(8):591–597. doi: 10.1089/dia.2010.0051. [DOI] [PubMed] [Google Scholar]
- 10.Geoffrey M, Brazg R, Richard W. FreeStyle Navigator continuous glucose monitoring system with TRUstart Algorithm, a 1-hour warm-up time. J Diabetes Sci Technol. 2011;5(1):99–106. doi: 10.1177/193229681100500114. [DOI] [PMC free article] [PubMed] [Google Scholar]
- 11.International Organization for Standardization. ISO 15197:2013. In vitro diagnostic test systems — requirements for blood-glucose monitoring systems for self-testing in managing diabetes mellitus. http://www.iso.org/iso/home/store/catalogue_ics/cataloguedetail_ics.htm?csnumber=54976.
- 12.Damiano ER, El-Khatib FH, Zheng H, Nathan DM, Russell SJ. A comparative effectiveness analysis of three continuous glucose monitors. Diabetes Care. 2013;36(2):251–259. doi: 10.2337/dc12-0070. [DOI] [PMC free article] [PubMed] [Google Scholar]
- 13.Kovatchev B, Anderson S, Heinemann L, Clarke W. Comparison of the numerical and clinical accuracy of four continuous glucose monitors. Diabetes Care. 2008;31(6):1160–1164. doi: 10.2337/dc07-2401. [DOI] [PMC free article] [PubMed] [Google Scholar]
- 14.Diabetes Research In Children Network (Direcnet) Study Group. Buckingham BA, Kollman C, Beck R, Kalajian A, Fiallo-Scharer R, Tansey MJ, Fox LA, Wilson DM, Weinzimer SA, Ruedy KJ, Tamborlane WV. Evaluation of factors affecting CGMS calibration. Diabetes Technol Ther. 2006;8(3):318–325. doi: 10.1089/dia.2006.8.318. [DOI] [PMC free article] [PubMed] [Google Scholar]
- 15.Rebrin K. Sheppard NF, Jr, Steil GM. Use of subcutaneous interstitial fluid glucose to estimate blood glucose: revisiting delay and sensor offset. J Diabetes Sci Technol. 2010;4(5):1087–1098. doi: 10.1177/193229681000400507. [DOI] [PMC free article] [PubMed] [Google Scholar]
- 16.Brazg RL, Klaff LJ, Parkin CG. Performance variability of seven commonly used self-monitoring of blood glucose systems: clinical considerations for patients and providers. J Diabetes Sci Technol. 2013;7(1):144–152. doi: 10.1177/193229681300700117. [DOI] [PMC free article] [PubMed] [Google Scholar]
- 17.McGarraugh G. The chemistry of commercial continuous glucose monitors. Diabetes Technol Ther. 2009;(11 Suppl 1):S17–S24. doi: 10.1089/dia.2008.0133. [DOI] [PubMed] [Google Scholar]