

Abstract
Background
Clinical trials have shown that self-monitoring of blood glucose (SMBG) combined with patient education and medication titration can lead to improved glycated hemoglobin (HbA1c) and reduced weight in recently diagnosed non-insulin-treated type 2 diabetes mellitus (T2DM) patients. This retrospective matched cohort study assessed the association of SMBG with achieving long-term clinical outcomes in these patients in a real-world clinical setting.
Methods
Using electronic medical records (2008–2011), we selected a population of adult patients recently diagnosed with T2DM not receiving insulin who were SMBG users and a population of non-SMBG controls with similar demographic and clinical characteristics using propensity score matching. The main study outcomes compared between the two groups were time to achieve (1) HbA1c <7% for patients with baseline HbA1c ≥7% and (2) a ≥5% reduction in weight from baseline.
Results
Of the 589 patients identified in each group, 113 in each group had a baseline HbA1c ≥7% (mean, 8.2%). The SMBG users were more likely to achieve an HbA1c <7% (12 months: 58.4% versus 38.9%, p = .0037; 36 months: 84.0% versus 70.0%, p = .0013) and to do so faster (median, 6.5 versus 20.5 months; log-rank p = . 0016). Self-monitoring of blood glucose was associated with faster weight reduction (median time to achieve a ≥5% reduction, 23.5 versus 35.9 months for SMBG and non-SMBG, respectively; log-rank p = .0005).
Conclusions
In newly diagnosed T2DM insulin-naïve patients, SMBG users had an improved rate of achieving long-term glycemic control and weight loss in a real-world clinical setting.
Keywords: HbA1c, overweight, self-monitoring of blood glucose, type 2 diabetes mellitus
Introduction
Self-monitoring of blood glucose (SMBG) is widely recommended for diabetes patients using insulin to help achieve optimal glycemic control.1 In contrast, the findings of published studies that assessed the value of SMBG as a tool to help non-insulin-treated type 2 diabetes mellitus (NIT2DM) patients achieve glycemic control have been mixed. Some studies demonstrated significant glycemic benefits while others did not.2–10 Recent randomized controlled trials, however, suggest that a structured SMBG program can improve glycemic control in this population when the information collected is used by patients to initiate lifestyle modifications and by physicians to implement timely changes in therapy.6,11,12
Guidelines of the International Diabetes Federation and American Diabetes Association have recommended SMBG as a tool to facilitate the achievement of glycemic control in all diabetes patients.1,13 Despite the vast literature debating the value of SMBG use in the NIT2DM population, the effect of SMBG use in these patients on weight has not been evaluated in a real-world setting. Additionally, studies measuring changes in glycated hemoglobin (HbA1c) and weight for these patients using health insurance claims and electronic medical records (EMRs) with long follow-up (>1 year) are lacking.
In this retrospective matched cohort study, we performed an analysis of integrated health insurance claims and EMR data to assess the impact of SMBG use on changes in HbA1c and weight in recently diagnosed NIT2DM patients in a real-world, practice-based setting.
Methods
Data Source
Health insurance claims and EMRs from the Reliant Medical Group (RMG) covering the period from January 1, 2008, through December 31, 2011, were used to conduct this analysis. Reliant Medical Group is the largest private, multi-specialty medical practice group in central Massachusetts, providing comprehensive care for more than one million patient visits per year, with more than 250 physicians practicing in over 20 locations. Reliant Medical Group has been using a comprehensive EMR system for all visits and care since 2007. Reliant Medical Group also has access to external medical and prescription claims data for the 60% of its patients that are under capitated health insurance contracts. Only patients with data in both the EMR and claims databases were included. Their data were de-identified in compliance with the Health Insurance Portability and Accountability Act of 1996 to preserve patient confidentiality. Data elements used in the present analysis included information on patients’ demographics, monthly enrollment history, medical and pharmacy claims, laboratory results (e.g., HbA1c and lipid panel), and clinical measures [e.g., height, weight, and blood pressure (BP)]. The study was approved by the RMG Institutional Review Board.
Study Design
This was a retrospective matched cohort study. Adult patients with at least two outpatient visits or one inpatient stay for T2DM (ICD-9-CM: 250.x0, 250.x2) were included. Additional patients were included who had at least one pharmacy-dispensed noninsulin diabetes medication. A 6-month period of continuous enrollment prior to the diagnosis of T2DM was imposed to ascertain newly diagnosed patients. Patients diagnosed with type 1 diabetes mellitus, steroid-induced diabetes, gestational diabetes, or polycystic ovaries during this 6-month period were excluded. Pharmacy dispensing within 1 month prior to or 24 months after diagnosis were screened for SMBG use. Those who had at least two pharmacy-dispensed SMBG test strips during this 25 month period were considered to be SMBG users; non-SMBG users had either one or no records of pharmacy-dispensed test strips. The initiation of SMBG was termed as the index date for patients in the SMBG user cohort, whereas the index date for patients in the non-SMBG-user cohort was randomly assigned in a manner to replicate the average time between T2DM diagnosis and SMBG initiation in the SMBG user cohort.
A 12-month period of continuous enrollment following the index date was imposed on both cohorts. We excluded from the analysis patients using insulin during the 6-month period preceding the index date (baseline period) and during the first year of follow-up to focus results on T2DM patients not taking insulin. Patients’ follow-up periods spanned from their index date through the earliest of the following: end of continuous enrollment, end of data availability, or SMBG initiation for the non-SMBG-user cohort.
Study Outcomes
The main study outcomes were the time to achieve (1) HbA1c level <7% for patients with a baseline HbA1c of at least 7% and (2) a ≥5% weight reduction from baseline in patients with a baseline weight. Time to achieve goal HbA1c was defined as the elapsed time from the index date to the first laboratory measure with a value <7.0%. Similarly, time to achieve a ≥5% weight reduction was calculated as the time from the index date to the first medical visit documenting such a reduction. Baseline HbA1c was determined as the closest value from the index date measured, at most, 3 months prior to and 1 month after the index date. Similarly, baseline weight was determined as the closest value from the index date measured, at most, 3 months prior to and 3 months after the index date.
The time maintaining HbA1c <7% for patients with baseline HbA1c <7% and the mean HbA1c over time for patients with baseline HbA1c of at least 7% were also studied. Time maintaining goal HbA1c was defined as the time from the index date to the first laboratory measure with a value ≥7% in patients with baseline levels <7%. Mean HbA1c level over time was evaluated every 3 months up until 3 years of follow-up among patients with baseline HbA1c ≥7%. The most recent laboratory measure within 45 days prior to and following each time point (e.g., 3, 6, and 9 months) was used to determine the HbA1c level at that time point.
Statistical Analyses
To minimize the potential impact of confounding factors, SMBG users were matched 1:1 with non-SMBG users based on the nearest available Mahalanobis metric within calipers defined by the propensity score,14 baseline HbA1c level, and number of outpatient visits. The propensity score for the use of SMBG is defined as the conditional probability of initiating SMBG given a patient’s measured characteristics. Propensity scores were calculated separately for each patient using a nonparsimonious multivariate logistic regression model, incorporating the following baseline characteristics: age, gender, race, year of treatment initiation, insurance type, concomitant medications (e.g., antihyperlipidemics, antihypertensives, and beta blockers), Quan Charlson comorbidity index, comorbidities (e.g., history of cardiovascular event, nephropathy, hypertension, and anemia), clinical measures (e.g., HbA1c, weight, and BP), and health care resource utilization.14
Descriptive statistics were generated to summarize the baseline characteristics of the study population. Frequency counts and percentages were used to summarize categorical variables while means and standard deviations were used for continuous variables. Statistical differences between cohorts were assessed using the McNemar’s test (categorical variables) and the paired two-sided Student’s t-test (continuous variables). Kaplan–Meier estimates and log-rank tests were performed to compare the time to achieve/maintain goal level for each clinical measure between the two cohorts.
Subsets of the overall matched populations of SMBG and non-SMBG users were used to calculate the time to achieve HbA1c <7%, time maintaining HbA1c <7%, and time to ≥5% weight reduction. Multivariate Cox proportional hazards regression models adjusting for the observed baseline imbalances and accounting for matched pairs were also conducted.
To compare the mean level of HbA1c over time between cohorts, mean HbA1c level at each time point was calculated for all patients, and missing values were filled in using the last observed value to increase the sample size and power to detect a difference. This approach, commonly referred to as the last value carried forward has also been used in previous studies.15–17 In addition, adjustments were made to account for repeated measurements across patients.
Statistical significance was assessed with a two-sided test at α-level of 0.05 or less. All statistical analyses were conducted using SAS® 9.2 (SAS Institute Inc., Cary, NC).
Results
Baseline Characteristics of the Matched Population
A total of 700 and 2899 T2DM patients in the SMBG user and non-SMBG user cohorts, respectively, were identified. Among them, 589 patients from the SMBG user cohort (84.1%) were matched to an equal number of patients in the non-SMBG user cohort to form the study population (see Figure 1). After matching, both cohorts were similar in terms of gender, ethnicity, concomitant medications, comorbidities, clinical measures, and health care resource utilization (Table 1).
Figure 1.
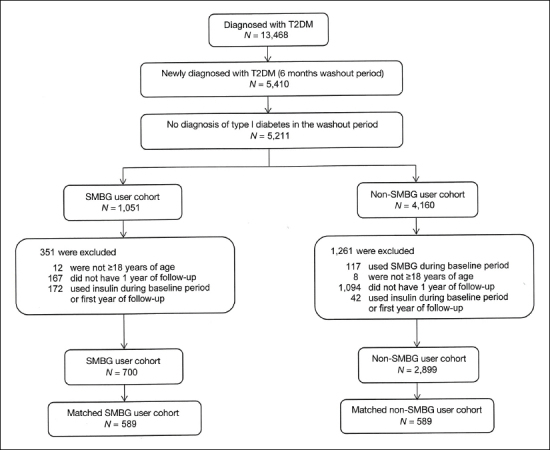
Study sample selection flowchart.
Table 1.
Baseline Characteristics of the Matched Cohortsa
| SMBG user cohort | Non-SMBG user cohort | P valueb | |
| (N = 589) | (N = 589) | ||
| Treatment patterns | |||
| Observation period, days, mean (SD) | 980 (321) | 980 (323) | 0.9911 |
| Time from diagnosis, days, mean (SD) | 138 (181) | 134 (181) | 0.6628 |
| Year of index datec, n | |||
| 2007 | 60 (10.2%) | 72 (12.2%) | 0.2438 |
| 2008 | 199 (33.8%) | 200 (34.0%) | 0.9480 |
| 2009 | 203 (34.5%) | 193 (32.8%) | 0.5040 |
| 2010 | 127 (21.6%) | 124 (21.1%) | 0.8185 |
| Demographicsc | |||
| Age, mean (SD) | 63.4 (13.1) | 64.8 (15.0) | 0.0350 |
| Gender, female, n | 311 (52.8%) | 309 (52.5%) | 0.9035 |
| Ethnicity, white, n | 434 (73.7%) | 437 (74.2%) | 0.8429 |
| Insurance,c n | |||
| Health maintenance organization | 217 (36.8%) | 202 (34.3%) | 0.3513 |
| Medicare | 279 (47.4%) | 306 (52.0%) | 0.0896 |
| Medicaid | 30 (5.1%) | 22 (3.7%) | 0.2382 |
| Multiple payors | 63 (10.7%) | 59 (10.0%) | 0.7127 |
| Baseline medication,d n | |||
| Antihyperlipidemics | 307 (52.1%) | 298 (50.6%) | 0.5804 |
| Antihypertensives | 315 (53.5%) | 311 (52.8%) | 0.8104 |
| Beta blockers | 201 (34.1%) | 205 (34.8%) | 0.7963 |
| Antidepressants | 116 (19.7%) | 121 (20.5%) | 0.7070 |
| Quan Charlson comorbidity index,d,e mean (SD) | 0.71 (1.33) | 0.82 (1.37) | 0.1362 |
| Comorbidities,d n | |||
| Cardiovascular eventf | 145 (24.6%) | 154 (26.1%) | 0.5192 |
| Comorbidities related to diabetes, n | |||
| Nephropathy | 9 (1.5%) | 8 (1.4%) | 0.8084 |
| Retinopathy | 7 (1.2%) | 8 (1.4%) | 0.7963 |
| Proteinuria | 3 (0.5%) | 4 (0.7%) | 0.7055 |
| Hypoglycemia | 3 (0.5%) | 4 (0.7%) | 0.7055 |
| Other comorbidities, n | |||
| Hypertension | 370 (62.8%) | 378 (64.2%) | 0.6301 |
| Hyperlipidemia | 414 (70.3%) | 410 (69.6%) | 0.7928 |
| Obesity | 107 (18.2%) | 102 (17.3%) | 0.6759 |
| Anemia | 37 (6.3%) | 39 (6.6%) | 0.8055 |
| Chronic kidney disease | 14 (2.4%) | 12 (2.0%) | 0.6831 |
| Baseline resource utilization,d mean (SD) | |||
| Emergency room visits | 0.29 (1.04) | 0.26 (1.02) | 0.7321 |
| Inpatient visits | 0.67 (3.00) | 0.73 (3.13) | 0.7268 |
| Outpatient/other visits | 9.31 (11.76) | 9.40 (10.03) | 0.8412 |
| Weight (lbs.)g,h | |||
| Number of patients, n | 400 (67.9%) | 403 (68.4%) | — |
| Weight, mean (SD) | 204.4 (51.5) | 205.4 (54.9) | 0.7248 |
| HbA1c, %g,i | |||
| Number of Patients, n | 285 (48.4%) | 285 (48.4%) | — |
| HbA1c level, mean (SD) | 7.1 (1.3) | 7.1 (1.3) | 0.2608 |
| Uncontrolled (i.e., ≥7%), n (%) | 113 (19.2%) | 113 (19.2%) | 1.0000 |
| BP, mm Hgg,h | |||
| Number of patients, n | 549 (93.2%) | 544 (92.4%) | — |
| Systolic BP level, mean (SD) | 130.2 (15.8) | 131.1 (17.4) | 0.3779 |
| Diastolic BP level, mean (SD) | 75.2 (11.1) | 74.6 (10.9) | 0.5563 |
SD, standard deviation.
P value tested the null hypothesis that the distributions were the same between the two cohorts.
Evaluated at the index date.
Evaluated during the 6-month baseline period.
Diabetes (mild to moderate) and diabetes with chronic complications were excluded.
Including acute coronary syndrome, acute myocardial infarction, angina, cardiac arrest, congestive heart failure, coronary artery disease, left ventricular hypertrophy, serious atrial arrhythmia, serious ventricular arrhythmia, sinus tachycardia, and stroke/transient ischemic attack.
The reading on or closest to, but prior to, the index date took precedence over the postindex value.
Evaluated, at most, within 3 months prior to or 3 months after the index date.
Evaluated, at most, within 3 months prior to or 1 month after the index date.
Study Outcomes
Time to Achieve Glycated Hemoglobin <7%
At baseline, 113 patients in each cohort had HbA1c ≥7%, with a mean at 8.2% (see Appendix A for baseline characteristics). Among SMBG users, 80.5% (91/113) achieved HbA1c <7% compared with 63.7% (72/113) for non-SMBG users. Kaplan-Meier estimates of achieving goal HbA1c level are shown in Figure 2A. Half of the patients in the SMBG user cohort reached an HbA1c <7% by 6.5 months, whereas half of the patients in the non-SMBG user cohort achieved glycemic control in 20.5 months (log-rank p = .0016). The adjusted hazard ratio (HR) for the likelihood of achieving HbA1c <7% at any given point in time for SMBG relative to non-SMBG users was also statistically significant (HR = 1.89; 95% confidence interval, 1.16–3.07; p = .0102).
Figure 2.
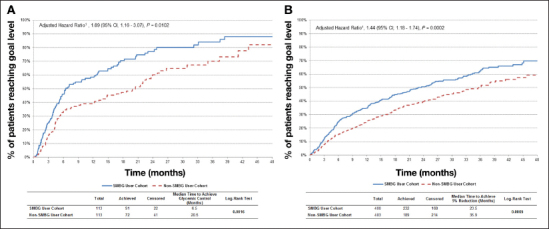
(A) Kaplan–Meier estimates of achieving goal HbA1c (<7%); HR adjusted for year of index date, type of insurance, and matched pairs. (B) Kaplan–Meier estimates of achieving ≥5% weight reduction; HR adjusted for Quan Charlson comorbidity index at baseline. CI, confidence interval.
Time to Achieve >5% Weight Reduction
Figure 2B (SMBG user cohort: N = 400, mean = 204.4 lbs.; non-SMBG user cohort: N = 403, mean = 205.4 lbs.) illustrates that SMBG users were significantly more likely to achieve a ≥5% reduction in weight and to do so faster (median time to achieve ≥5% weight reduction, 23.5 versus 35.9 months; log-rank p = .0005) relative to nonusers. (See Appendix B for baseline characteristics.) Among SMBG users, 58.0% (232/400) achieved a ≥5% reduction compared with 46.9% (189/403) for non-SMBG users. The adjusted HR for the time to achieve ≥5% weight reduction for SMBG relative to non-SMBG users was also statistically significant (HR = 1.44; 95% confidence interval, 1.18–1.74; p = .0002).
Time Maintaining Glycated Hemoglobin <7% in Patients with Baseline Glycated Hemoglobin <7%
Both SMBG users and nonusers (172 patients in each cohort) were equally as likely to maintain glycemic control (3 months, 98.8% versus 98.3%; 12 months, 89.5% versus 93.6%; 36 months, 75.1% versus 79.9%; log-rank p = .6442). After adjustment, the HR for the time maintaining HbA1c <7% for SMBG relative to non-SMBG users remained nonsignificant (HR = 1.40; 95% confidence interval, 0.76–2.59; p = .2839; data not shown).
Mean Glycated Hemoglobin Level Over Time
Similar levels of mean HbA1c values over time were observed between the SMBG and non-SMBG users when analyzing all patients with baseline HbA1c values (285 patients in each cohort; Figure 3B). Of these patients, 60% (172/285) in each cohort had baseline HbA1c <7%, which may partly explain the similarity between the two groups.
Figure 3.
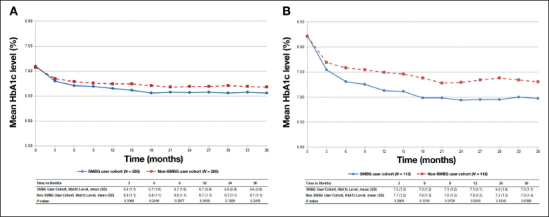
(A) Mean HbA1c level during the follow-up period; patients with HbA1c at baseline. (B) Mean HbA1c level during the follow-up period; patients with uncontrolled HbA1c at baseline. SD, standard deviation.
When analyzing the subset of patients in each group with uncontrolled HbA1c at baseline (i.e., HbA1c ≥7%), the HbA1c level over time was significantly lower in the SMBG user cohort compared with the non-SMBG user cohort. At 12 and 36 months, the differences in mean HbA1c levels between the SMBG and the non-SMBG users were 0.4% (mean 7.1% versus 7.5%; p = .0340) and 0.3% (mean 7.0% versus 7.3%; p = .0390; Figure 3B) , respectively.
Discussion
This retrospective study was designed specifically to assess the short- and long-term impact of SMBG use on changes to HbA1c and weight in newly diagnosed NIT2DM patients using an integrated insurance claims and EMRs database and a matched-cohort design.
The SMBG users who had baseline HbA1c ≥7% in this study achieved HbA1c <7% more rapidly than the nonusers (median time 6.5 months for SMBG users versus 20.5 months for nonusers; log-rank p = .0016). These HbA1c findings are consistent with several studies documenting glycemic benefits associated with the use of SMBG.2–6 In the ROSES trial, Franciosi and coauthors6 found a higher percentage of patients reaching HbA1c <7% in the SMBG group than in the control group at 3 months (54.8% versus 33.3%; p = .15) and 6 months (61.9% versus 20.0%; p = .005). Similarly, Guerci and coauthors4 reported that patients in the SMBG group were more likely to achieve a 0.5% reduction in HbA1c compared with patients in the conventional treatment group (3 months: 50.3% versus 41.6%, p = .026; 6 months: 57.1% versus 46.8%, p = .007).4
The analysis of mean change in HbA1c level over time also indicated a beneficial impact of SMBG on HbA1c in the subset of patients with baseline HbA1c ≥7%; however, statistical significance was only reached from 12 months onward. The difference in HbA1c between the two groups was 0.3–0.4%. These results are similar to a meta-analysis that estimated that SMBG was associated with significant additional HbA1c reduction of 0.31%.18 Other studies have also documented additional HbA1c reductions of similar magnitude.2,5,12,19,20
There are several potential explanations as to why SMBG users were able to achieve a goal HbA1c faster than nonusers. As per prior studies, SMBG use has been associated with better medication compliance.19,20 Additionally, SMBG data can be used by health care providers to make more timely medication adjustments as was seen in prior studies.6,12Finally, patients may use the SMBG data to reinforce lifestyle choices such as eating healthier food and smaller portion sizes and exercising to ensure their blood glucose remains at goal. Durán and coauthors11 found that SMBG users engaged in more exercise and better food choices.
This study could find no benefit for SMBG use in patients with baseline HbA1c at goal (<7%). The SMBG data may help to reinforce that the blood glucose is at goal, which could lead to reduced testing. Infrequent use of SMBG or discontinuation might be potential explanation, although further research would be warranted to confirm these hypotheses. A study by Farmer and coauthors8 found no beneficial effect on glycemic control associated with SMBG in reasonably well-controlled patients.8 Prior literature has also corroborated that SMBG use has a more profound effect on HbA1c reduction when the baseline HbA1c is higher.4,20,21 Patients close to or at their glycemic goal and their health care providers may not see a need to make changes in treatment and/or lifestyle.
Lastly, the present study also evaluated the impact of SMBG use on weight loss in patients with a weight measurement at baseline. The result of this analysis indicated that SMBG users were significantly more likely to achieve a ≥5% reduction in weight. At 6 months, 24.5% of SMBG (versus 15.1% of nonusers) had lost at least 5% of their baseline weight. The differences remained throughout the observation period of 36 months (62.4% versus 50.5%). The literature provides mixed evidence regarding SMBG use and weight reduction in NIT2DM patients. Two studies demonstrated that patients enrolled in a structured SMBG program were more likely to experience weight loss.6,11 Schwedes and coauthors3 concluded that weight improved when using SMBG, but there was no significant difference between SMBG users and the control group (p = .332). In addition, in the DINAMIC 1 study, Barnett and coauthors5 reported a similar weight drop over the course of the study between the SMBG and non-SMBG groups. One potential explanation for this divergence in the studies by Schewedes and coauthors3 and Barnett and coauthors5 is the length of follow-up of 6 months. Our analysis indicates that the gap in achieving a reduction in weight between SMBG and non-SMBG users is more apparent from 6 months onward. The ROSSO-in-praxi study was able to demonstrate that a combination of 12-week lifestyle intervention plus SMBG was associated with a long-term weight loss of 2.4 kg over a 2-year period from a baseline of 94.4 ± 16.4 kg.22
Limitations
This study is subject to several limitations. First, the current study used pharmacy dispensing information as a surrogate for SMBG use, which might not be an accurate proxy given that pharmacy dispensing may not reflect a patient’s actual compliance. However, use of pharmacy refills is considered an acceptable method to estimate medication adherence.23 Second, some laboratory data may be missing. The data contain only results from tests ordered by RMG providers or performed at their primary hospital; the majority of testing likely occurred within the network. However, tests ordered or performed outside this network are not included. Point-of-care testing for HbA1c also could not be included in the data set given the nonuniformity with which this information is recorded. Third, no information was available regarding diabetes education or lifestyle changes such as diet and exercise that might have potentially contributed to the beneficial impact of SMBG on the clinical outcomes studied. Other factors could have also contributed to the beneficial impact. For example, a study reported that glycemic benefits associated with SMBG in insulin-naïve T2DM patients was related to greater medication adherence, but the authors also noted that it was not the sole contributing factor.20 Fourth, the study results may not be generalizable to other populations, as RMG patients are located mainly in central Massachusetts.
Despite efforts made to control for a comprehensive selection of baseline characteristics in the matching algorithm, there may have been residual confounding effects from factors that could not be observed in the database but that may have explained the physician’s decision of SMBG initiation. Patients who use SMBG may be more engaged in their medical care, ensuring they follow clinical advice and seeking health services more intensively and therefore potentially more closely managing their diabetes. The matching algorithm may have led to a selection bias, including more motivated patients. Finally, in order to assess the impact of SMBG use on clinical measures, the study excluded patients without HbA1c or weight assessment at baseline, thus potentially resulting in a subpopulation different than the general, insulin-naïve, newly diagnosed T2DM population. Nevertheless, observational studies, well designed and with appropriate statistical techniques adjusting for potential confounding factors through matching techniques, can provide valuable information regarding medical practice scenarios.
Conclusion
In this retrospective study, the use of SMBG in insulin-naïve patients recently diagnosed with T2DM was associated with improved rates of achievement of glycemic control and weight loss. In addition, SMBG use was also associated with a shorter time to achieve an HbA1c at goal and weight reduction of at least 5%. The SMBG users were as likely as nonusers to maintain glycemic control in already controlled patients. This study adds to the growing evidence that SMBG in this segment of the T2DM population may result in positive clinical benefits.
Acknowledgments
Some of these results were presented as a poster at the Diabetes Technology Meeting in Bethesda, MD, November 8–10, 2012.
Glossary
- (BP)
blood pressure
- (EMR)
electronic medical record
- (HbA1c)
glycated hemoglobin
- (HR)
hazard ratio
- (NIT2DM)
non-insulin-treated type 2 diabetes mellitus
- (RMG)
Reliant Medical Group
- (SMBG)
self-monitoring of blood glucose
- (T2DM)
type 2 diabetes mellitus
Appendix
Appendix A:
Demographic and Clinical Characteristics—Matched Cohorts—Among Patients with Abnormal Baseline Glycated Hemoglobina
| SMBG user cohort | Non-SMBG user cohort | P valueb | |
| (N = 113) | (N = 113) | ||
| Treatment patterns | |||
| Observation period, days, mean (SD) | 924 (364) | 937 (373) | 0.7962 |
| Time from diagnosis, days, mean (SD) | 128 (185) | 97 (169) | 0.1609 |
| Year of index date,c n | |||
| 2007 | 14 (12.4%) | 27 (23.9%) | 0.0280 |
| 2008 | 30 (26.5%) | 36 (31.9%) | 0.3545 |
| 2009 | 28 (24.8%) | 15 (13.3%) | 0.0236 |
| 2010 | 41 (36.3%) | 35 (31.0%) | 0.4054 |
| Demographicsc | |||
| Age, mean (SD) | 62.7 (13.4) | 64.9 (14.9) | 0.2020 |
| Gender, female, n | 53 (46.9%) | 54 (47.8%) | 0.8864 |
| Ethnicity, white, n | 83 (73.5%) | 79 (69.9%) | 0.5371 |
| Insurance,c n | |||
| Health maintenance organization | 52 (46.0%) | 37 (32.7%) | 0.0357 |
| Medicare | 47 (41.6%) | 56 (49.6%) | 0.1985 |
| Medicaid | 6 (5.3%) | 4 (3.5%) | 0.5271 |
| Multiple payors | 8 (7.1%) | 16 (14.2%) | 0.0881 |
| Baseline medication,d n | |||
| Antihyperlipidemics | 47 (41.6%) | 46 (40.7%) | 0.8840 |
| Antihypertensives | 59 (52.2%) | 49 (43.4%) | 0.1892 |
| Beta blockers | 38 (33.6%) | 34 (30.1%) | 0.5553 |
| Antidepressants | 13 (11.5%) | 13 (11.5%) | 1.0000 |
| Quan Charlson comorbidity index,d,e mean (SD) | 0.56 (1.23) | 0.70 (1.19) | 0.2597 |
| Comorbidities,d n | |||
| Cardiovascular eventf | 32 (28.3%) | 25 (22.1%) | 0.2858 |
| Comorbidities related to diabetes, n | |||
| Nephropathy | 3 (2.7%) | 2 (1.8%) | 0.6547 |
| Retinopathy | — | — | — |
| Proteinuria | 0 (0.0%) | 1 (0.9%) | — |
| Hypoglycemia | — | — | — |
| Other comorbidities, n | |||
| Hypertension | 61 (54.0%) | 63 (55.8%) | 0.7855 |
| Hyperlipidemia | 76 (67.3%) | 77 (68.1%) | 0.8759 |
| Obesity | 19 (16.8%) | 17 (15.0%) | 0.7055 |
| Anemia | 4 (3.5%) | 5 (4.4%) | 0.7389 |
| Chronic kidney disease | 2 (1.8%) | 2 (1.8%) | 1.0000 |
| Baseline resource utilization,d mean (SD) | |||
| Emergency room visits | 0.24 (0.71) | 0.12 (0.48) | 0.1287 |
| Inpatient visits | 0.37 (2.05) | 0.37 (1.66) | 1.0000 |
| Outpatient/other visits | 8.18 (9.13) | 7.00 (5.77) | 0.0689 |
| Weight (lbs.)g,h | |||
| Number of patients, n | 77 (68.1%) | 77 (68.1%) | — |
| Weight, mean (SD) | 209.1 (56.2) | 216.8 (55.3) | 0.8304 |
| HbA1c, %g,i | |||
| Number of patients, n (%) | 113 (100.0%) | 113 (100.0%) | — |
| HbA1c level, mean (SD) | 8.2 (1.4) | 8.2 (1.4) | 0.7810 |
| Uncontrolled (i.e., ≥7%), n (%) | 113 (100.0%) | 113 (100.0%) | — |
| BP, mm Hgg,h | |||
| Number of patients, n (%) | 109 (96.5%) | 110 (97.3%) | — |
| Systolic BP level, mean (SD) | 130.6 (15.1) | 135.9 (19.7) | 0.0700 |
| Diastolic BP level, mean (SD) | 75.1 (11.1) | 76.8 (10.1) | 0.1598 |
SD, standard deviation.
P value tested the null hypothesis that the distributions were the same between the two cohorts.
Evaluated at the index date.
Evaluated during the 6-month baseline period.
Diabetes (mild to moderate) and diabetes with chronic complications were excluded.
Including acute coronary syndrome, acute myocardial infarction, angina, cardiac arrest, congestive heart failure, coronary artery disease, left ventricular hypertrophy, serious atrial arrhythmia, serious ventricular arrhythmia, sinus tachycardia, and stroke/transient ischemic attack.
The reading on or closest to, but prior to, the index date took precedence over the postindex value.
Evaluated, at most, within 3 months prior to or 3 months following the index date.
Evaluated, at most, within 3 months prior to or 1 month following the index date.
Appendix B:
Demographic and Clinical Characteristics among Patients with Baseline Weighta
| SMBG user cohort | Non-SMBG user cohort | P valueb | |
| (N = 400) | (N = 403) | ||
| Treatment patterns | |||
| Observation period, days, mean (SD) | 961 (317) | 963 (321) | 0.9483 |
| Time from diagnosis, days, mean (SD) | 133 (183) | 129 (183) | 0.7191 |
| Year of index date,c n | |||
| 2007 | 35 (8.8%) | 41 (10.2%) | 0.4908 |
| 2008 | 125 (31.3%) | 133 (33.0%) | 0.5949 |
| 2009 | 148 (37.0%) | 135 (33.5%) | 0.2991 |
| 2010 | 92 (23.0%) | 94 (23.3%) | 0.9131 |
| Demographicsc | |||
| Age, mean (SD) | 63.2 (13.2) | 64.4 (14.2) | 0.1892 |
| Gender, female, n | 200 (50.0%) | 219 (54.3%) | 0.2181 |
| Ethnicity, white, n | 300 (75.0%) | 309 (76.7%) | 0.5793 |
| Insurance,c n | |||
| Health maintenance organization | 158 (39.5%) | 140 (34.7%) | 0.1627 |
| Medicare | 188 (47.0%) | 205 (50.9%) | 0.2729 |
| Medicaid | 17 (4.3%) | 15 (3.7%) | 0.7022 |
| Multiple payors | 37 (9.3%) | 43 (10.7%) | 0.5017 |
| Baseline medication,d n | |||
| Antihyperlipidemics | 206 (51.5%) | 209 (51.9%) | 0.9185 |
| Antihypertensives | 220 (55.0%) | 215 (53.3%) | 0.6389 |
| Beta blockers | 139 (34.8%) | 136 (33.7%) | 0.7646 |
| Antidepressants | 74 (18.5%) | 83 (20.6%) | 0.4541 |
| Quan Charlson comorbidity index,d,e mean (SD) | 0.70 (1.32) | 0.92 (1.46) | 0.0234 |
| Comorbidities,d n | |||
| Cardiovascular eventf | 99 (24.8%) | 110 (27.3%) | 0.4111 |
| Comorbidities related to diabetes | |||
| Nephropathy | 8 (2.0%) | 3 (0.7%) | 0.1259 |
| Retinopathy | 3 (0.8%) | 5 (1.2%) | 0.4839 |
| Proteinuria | 2 (0.5%) | 3 (0.7%) | 0.6598 |
| Hypoglycemia | 3 (0.8%) | 2 (0.5%) | 0.6477 |
| Other comorbidities | |||
| Hypertension | 259 (64.8%) | 268 (66.5%) | 0.6014 |
| Hyperlipidemia | 284 (71.0%) | 297 (73.7%) | 0.3928 |
| Obesity | 85 (21.3%) | 83 (20.6%) | 0.8197 |
| Anemia | 23 (5.8%) | 30 (7.4%) | 0.3337 |
| Chronic kidney disease | 12 (3.0%) | 9 (2.2%) | 0.4960 |
| Baseline resource utilization,d mean (SD) | |||
| Emergency room visits | 0.26 (1.07) | 0.30 (1.17) | 0.6106 |
| Inpatient visits | 0.57 (2.59) | 0.73 (3.18) | 0.4292 |
| Outpatient/other visits | 9.24 (9.14) | 10.33 (10.84) | 0.1236 |
| Weight (lbs.)g,h | |||
| Number of patients, n | 400 (100.0%) | 403 (100.0%) | — |
| Weight, mean (SD) | 204.4 (51.5) | 205.4 (54.9) | 0.8040 |
| HbA1c (%)g,i | |||
| Number of patients, n | 203 (50.8%) | 200 (49.6%) | — |
| HbA1c level, mean (SD) | 7.0 (1.3) | 7.1 (1.3) | 0.8642 |
| Uncontrolled (i.e., ≥7%), n | 77 (19.3%) | 77 (19.1%) | 0.9589 |
| BP mm Hgg,h | |||
| Number of patients, n | 390 (97.5%) | 399 (99.0%) | — |
| Systolic BP level, mean (SD) | 130.6 (16.0) | 131.3 (17.3) | 0.5525 |
| Diastolic BP level, mean (SD) | 75.3 (10.6) | 74.9 (11.0) | 0.6070 |
SD, standard deviation.
P value tested the null hypothesis that the distributions were the same between the two cohorts.
Evaluated at the index date.
Evaluated during the 6-month baseline period.
Diabetes (mild to moderate) and diabetes with chronic complications were excluded.
Including acute coronary syndrome, acute myocardial infarction, angina, cardiac arrest, congestive heart failure, coronary artery disease, left ventricular hypertrophy, serious atrial arrhythmia, serious ventricular arrhythmia, sinus tachycardia, and stroke/transient ischemic attack.
The reading on or closest to, but prior to, the index date took precedence over the postindex value.
Evaluated, at most, within 3 months prior to or 3 months following the index date.
Evaluated, at most, within 3 months prior to or 1 month following the index date.
Funding
This research was funded by Lifescan, Inc., Milpitas, CA.
Disclosures
Five of the authors (Lefebvre, Parisé, Duh, Pilon, and Laliberté) are employees of Analysis Group, Inc., a consulting company that has received research grants from Lifescan, Inc. Two of the authors (Virdi and Dirani) are employees of Lifescan, Inc. Two of the authors (Sundaresan and Garber) are employees of RMG and have received research grants from Lifescan, Inc.
References
- 1.American Diabetes Association. Standard of medical care in diabetes--2012. Diabetes Care. 2012;(35 Suppl 1):S11–S63. doi: 10.2337/dc12-s011. [DOI] [PMC free article] [PubMed] [Google Scholar]
- 2.Karter AJ, Ackerson LM, Darbinian JA, D’Agostino RB, Jr, Ferrara A, Liu J, Selby JV. Self-monitoring of blood glucose levels and glycemic control: the Northern California Kaiser Permanente Diabetes Registry. Am J Med. 2001;111(1):1–9. doi: 10.1016/s0002-9343(01)00742-2. [DOI] [PubMed] [Google Scholar]
- 3.Schwedes U, Siebolds M, Mertes G. SMBG Study Group. Meal-related structured self-monitoring of blood glucose: effect on diabetes control in non-insulin-treated type 2 diabetic patients. Diabetes Care. 2002;25(11):1928–1932. doi: 10.2337/diacare.25.11.1928. [DOI] [PubMed] [Google Scholar]
- 4.Guerci B, Drouin P, Grangé V, Bougnères P, Fontaine P, Kerlan V, Passa P, Thivolet Ch, Vialettes B, Charbonnel B. ASIA Group. Self-monitoring of blood glucose significantly improves metabolic control in patients with type 2 diabetes mellitus: the Auto-Surveillance Intervention Active (ASIA) study. Diabetes Metab. 2003;29(6):587–594. doi: 10.1016/s1262-3636(07)70073-3. [DOI] [PubMed] [Google Scholar]
- 5.Barnett AH, Krentz AJ, Strojek K, Sieradzki J, Azizi F, Embong M, Imamoglu S, Perusicová J, Uliciansky V, Winkler G. The efficacy of self-monitoring of blood glucose in the management of patients with type 2 diabetes treated with a gliclazide modified release-based regimen. A multicentre, randomized, parallel-group, 6-month evaluation (DINAMIC 1 study) Diabetes Obes Metab. 2008;10(12):1239–1247. doi: 10.1111/j.1463-1326.2008.00894.x. [DOI] [PubMed] [Google Scholar]
- 6.Franciosi M, Lucisano G, Pellegrini F, Cantarello A, Consoli A, Cucco L, Ghidelli R, Sartore G, Sciangula L, Nicolucci A. ROSES Study Group. ROSES: role of self-monitoring of blood glucose and intensive education in patients with type 2 diabetes not receiving insulin. A pilot randomized clinical trial. Diabet Med. 2011;28(7):789–796. doi: 10.1111/j.1464-5491.2011.03268.x. [DOI] [PubMed] [Google Scholar]
- 7.Davidson MB, Castellanos M, Kain D, Duran P. The effect of self monitoring of blood glucose concentrations on glycated hemoglobin levels in diabetic patients not taking insulin: a blinded, randomized trial. Am J Med. 2005;118(4):422–425. doi: 10.1016/j.amjmed.2004.12.006. [DOI] [PubMed] [Google Scholar]
- 8.Farmer A, Wade A, Goyder E, Yudkin P, French D, Craven A, Holman R, Kinmonth AL, Neil A. Impact of self monitoring of blood glucose in the management of patients with non-insulin treated diabetes: open parallel group randomised trial. BMJ. 2007;335(7611):7132. doi: 10.1136/bmj.39247.447431.BE. [DOI] [PMC free article] [PubMed] [Google Scholar]
- 9.O’Kane MJ, Bunting B, Copeland M, Coates VE. ESMON study group. efficacy of self monitoring of blood glucose in patients with newly diagnosed type 2 diabetes (ESMON study): randomised controlled trial. BMJ. 2008;336(7654):1174–1177. doi: 10.1136/bmj.39534.571644.BE. [DOI] [PMC free article] [PubMed] [Google Scholar]
- 10.Kleefstra N, Hortensius J, Logtenberg SJ, Slingerland RJ, Groenier KH, Houweling ST, Gans RO, van Ballegooie E, Bilo HJ. Self-monitoring of blood glucose in tablet-treated type 2 diabetic patients (ZODIAC) Neth J Med. 2010;68(1):311–316. [PubMed] [Google Scholar]
- 11.Durán A, Martín P, Runkle I, Pérez N, Abad R, Fernández M, Del Valle L, Sanz MF, Calle-Pascual AL. Benefits of self-monitoring blood glucose in the management of new-onset type 2 diabetes mellitus: the St Carlos Study, a prospective randomized clinic-based interventional study with parallel groups. J Diabetes. 2010;2(3):203–211. doi: 10.1111/j.1753-0407.2010.00081.x. [DOI] [PubMed] [Google Scholar]
- 12.Polonsky WH, Fisher L, Schikman CH, Hinnen DA, Parkin CG, Jelsovsky Z, Petersen B, Schweitzer M, Wagner RS. Structured self-monitoring of blood glucose significantly reduces A1C levels in poorly controlled, noninsulin-treated type 2 diabetes: results from the Structured Testing Program study. Diabetes Care. 2011;34(2):262–267. doi: 10.2337/dc10-1732. [DOI] [PMC free article] [PubMed] [Google Scholar]
- 13.International Diabetes Federation. IDF guideline on self-monitoring of blood glucose in non-insulin treated type 2 diabetes. 2009. http://www.idf. org/guidelines/self-monitoring.Accessed August 16 2012.
- 14.Rosenbaum PR, Rubin DB. Constructing a control group using multivariate matched sampling methods that incorporate propensity score. Am Stat. 1985;39(1):33–38. [Google Scholar]
- 15.Pandya BJ, Bron M, McCall T, Yu AP, Chen KS, Mattson ME, Wu EQ. Achieving glycemic goal with initial versus sequential combination therapy using metformin and pioglitazone in type 2 diabetes mellitus. Curr Med Res Opin. 2011;27(1):189–195. doi: 10.1185/03007995.2010.536755. [DOI] [PubMed] [Google Scholar]
- 16.Bays HE, Goldberg RB, Truitt KE, Jones MR. Colesevelam hydrochloride therapy in patients with type 2 diabetes mellitus treated with metformin: glucose and lipid effects. Arch Intern Med. 2008;168(18):1975–1983. doi: 10.1001/archinte.168.18.1975. [DOI] [PubMed] [Google Scholar]
- 17.Kong AP, Yamasaki A, Ozaki R, Saito H, Asami T, Ohwada S, Ko GT, Wong CK, Leung GT, Lee KF, Yeung CY, Chan JC. A randomized-controlled trial to investigate the effects of rivoglitazone, a novel PPAR gamma agonist on glucose-lipid control in type 2 diabetes. Diabetes Obes Metab. 2011;13(9):806–813. doi: 10.1111/j.1463-1326.2011.01411.x. [DOI] [PubMed] [Google Scholar]
- 18.Allemann S, Houriet C, Diem P, Stettler C. Self-monitoring of blood glucose in non-insulin treated patients with type 2 diabetes: a systematic review and meta-analysis. Curr Med Res Opin. 2009;25(12):2903–2913. doi: 10.1185/03007990903364665. [DOI] [PubMed] [Google Scholar]
- 19.Karter AJ, Parker MM, Moffet HH, Spence MM, Chan J, Ettner SL, Selby JV. Longitudinal study of new and prevalent use of self-monitoring of blood glucose. Diabetes Care. 2006;29(8):1757–1763. doi: 10.2337/dc06-2073. [DOI] [PMC free article] [PubMed] [Google Scholar]
- 20.Virdi N, Daskiran M, Nigam S, Kozma C, Raja P. The association of self-monitoring of blood glucose use with medication adherence and glycemic control in patients with type 2 diabetes initiating non-insulin treatment. Diabetes Technol Ther. 2012;14(9):790–798. doi: 10.1089/dia.2012.0047. [DOI] [PubMed] [Google Scholar]
- 21.Polonsky W, Fisher L, Schikman C, Hinnen D, Parkin C, Jelsovsky Z, Amstutz L, Schweitzer M, Wagner R. The value of episodic, intensive blood glucose monitoring in non-insulin treated persons with type 2 diabetes: design of the Structured Testing Program (STeP) study, a cluster-randomised, clinical trial { NCT00674986}. BMC Fam Pract. 2010;11:37. doi: 10.1186/1471-2296-11-37. [DOI] [PMC free article] [PubMed] [Google Scholar]
- 22.Kempf K, Kruse J, Martin S. ROSSO-in-praxi follow-up: long-term effects of self-monitoring of blood glucose on weight, hemoglobin A1c, and quality of life in patients with type 2 diabetes mellitus. Diabetes Technol Ther. 2012;14(1):59–64. doi: 10.1089/dia.2011.0116. [DOI] [PubMed] [Google Scholar]
- 23.Hansen RA, Kim MM, Song L, Tu W, Wu J, Murray MD. Comparison of methods to assess medication adherence and classify nonadherence. Ann Pharmacother. Ann Pharmacother. 2009;43(3):413–422. doi: 10.1345/aph.1L496. [DOI] [PubMed] [Google Scholar]