

Abstract
Background. The Accountable Care Organization (ACO) model is rapidly being implemented by Medicare, private payers, and states, but little is known about the scope of ACO implementation.
Objective. To determine the number of accountable care organizations in the United States, where they are located, and characteristics associated with ACO formation.
Study Design, Methods, and Data. Cross-sectional study of all ACOs in the United States as of August 2012. We identified ACOs from multiple sources; documented service locations (practices, clinics, hospitals); and linked service locations to local areas, defined as Dartmouth Atlas hospital service areas. We used multivariate analysis to assess what characteristics were associated with local ACO presence. We examined demographic characteristics (2010 American Community Survey) and health care system characteristics (2010 Medicare fee-for-service claims data).
Principal Findings. We identified 227 ACOs located in 27 percent of local areas. Fifty-five percent of the US population resides in these areas. HSA-level characteristics associated with ACO presence include higher performance on quality, higher Medicare per capita spending, fewer primary care physician groups, greater managed care penetration, lower poverty rates, and urban location.
Conclusions. Much of the US population resides in areas where ACOs have been established. ACO formation has taken place where it may be easier to meet quality and cost targets. Wider adoption of the ACO model may require tailoring to local context.
Keywords: Accountable care organizations, Medicare, health care reform, incentives in health care, health policy, delivery of health care, health care costs
Implementation of the Affordable Care Act is no longer in doubt after the Supreme Court's June 2012 decision to largely uphold the Act and the 2012 elections. Delivery and payment system reforms included in the Act are proceeding, including implementation of accountable care organizations (Berwick and Hackbarth 2012). An accountable care organization (ACO) is a group of providers collectively held responsible for the overall cost and quality of care for a defined patient population. These and other value-based payment reforms are intended to address long-standing problems confronting U.S. health care: uneven quality, unsustainable costs, and care that is fragmented (Fisher et al. 2007; Fisher and Shortell 2010; Casalino and Shortell 2011; Fisher, McClellan, and Safran 2011). ACO implementation began in earnest in 2012: Medicare began the Pioneer ACO program and the Medicare Shared Savings Program to contract with ACOs (Berwick 2011), many organizations began commercial payer ACO contracts (Larson et al. 2012), and several states began negotiating or implementing ACO contracts under Medicaid programs (McGinnis and Small 2012).
At this early stage of development, it is not known whether ACOs will be successful in spurring system-wide transformation of U.S. health care. Early evidence from Medicare's Physician Group Practice Demonstration and a similar commercial contract suggests that the model holds promise (Weeks et al. 2010; Song et al. 2011, 2012; Colla et al. 2012). However, many have raised concerns about the likelihood the ACO model will achieve its aims (Burns and Pauly 2012; Eddy and Shah 2012) and the potential for raised prices as providers consolidate to form ACOs (Berenson, Ginsburg, and Kemper 2010; Berenson et al. 2012; Scheffler, Shortell, and Wilensky 2012). In addition, there are concerns about the high cost and technical difficulty of establishing ACOs, including the work necessary to negotiate or apply for an ACO contract and the investment required to reorganize and redesign care (Pollack and Armstrong 2011; Burns and Pauly 2012; Evans 2012; Lewis et al. 2012). Thus, it is not certain whether a substantial number of provider organizations will undertake accountable care. Most important, nothing is known about the characteristics of the health care markets or local areas where ACOs are being implemented. Research has documented that diffusion of ACO precursors, such as managed care or health maintenance organizations (HMOs) and pay-for-performance, is uneven across local areas (Baker 1999; Rosenthal et al. 2006); thus, it is likely that ACO formation will also be uneven, particularly in the early phases of ACO development.
In this article, we examine how many ACOs were established in the United States as of August 2012; where those ACOs are located; and what types of American communities are more or less likely to be served by an ACO. Our results indicate that over 55 percent of Americans reside in local areas where at least one ACO has a presence. We use information on demographic and health-system characteristics to identify factors associated with the local formation of ACOs. Our findings confirm concerns that the current ACO model may face barriers to implementation in many regions.
Conceptual Model
There are a number of factors that we hypothesize may be associated with ACO formation in a local area. We consider local area demographic characteristics and characteristics of the local health care system. Within the characteristics of the local health care system, there are two broad sets of factors that may be associated with ACO formation: the organization of health care in a local area and the current delivery of health care in a local area.
We consider several aspects of the organization of health care, including the supply of physicians; the supply of hospitals; the number of physician groups; the competitiveness of the local health care market; and the penetration of managed care or HMOs. Beginning with physician supply, we expect that more physicians will be positively associated with ACO presence, as it is more likely that at least one of these physicians is part of an ACO. In contrast, we hypothesize that if there is overcapacity in health care infrastructure or workers in a region (e.g., high hospital supply), providers may be uncertain as to how they can reduce costs while keeping their revenue stream intact and thus less likely to be pursuing an ACO.
Local competition for patients may be positively or negatively associated with ACO presence. Competition may encourage providers to become ACOs to keep a competitive advantage (such as the status as a cutting-edge health care organization). However, competition could discourage ACO formation if we expect dominant providers with large market share to form ACOs. For example, if organizations considering ACO contracts are concerned that a high proportion of patient care may occur with providers outside their ACO network over which they have little control or influence, areas with more concentration and less competition would be more likely to include an ACO. Finally, controlling for number of physicians and concentration, the number of physician groups may be either positively or negatively associated with ACO formation. Formation may be more likely if there are fewer groups, meaning that the existing groups are larger (such as in the case of a large multispecialty group practice), but like supply of physicians, more groups may indicate more opportunities for ACO formation.
We also consider several aspects of the delivery of health care in a region that may be associated with ACO presence, including the total cost of care in a local area and the quality of care delivered. We anticipate that the presence of ACOs may be associated with current delivery that positions providers to succeed under ACO contracts. We first hypothesize that providers in high-quality regions may feel more confident in their ability to meet ACO quality benchmarks than those in lower quality regions. In contrast, ACO benchmarks for the total cost of care and the potential savings an organization can achieve are often based on the ACO's own prior total cost to reward relatively improvement; high-cost organizations may have more savings to gain than organizations that are currently lower cost. We thus hypothesize that providers in high-cost regions may be more attracted to the ACO model because they stand to gain more in shared savings.
In addition, we expect that the presence of related or precursor initiatives to ACOs will predict ACO formation in a local region. For example, we hypothesize that local areas with a high level of managed care penetration would be more likely to have ACOs present; providers in these regions may have more experience in payment reform and thus be more comfortable or confident pursuing ACOs. Notably, each of these hypotheses about the local health care delivery system is most salient at the level of the organization, rather than the region; in the absence of organizational-level data, we use regional data as a proxy.
Finally, we expect some demographic characteristics to be associated with ACO presence. We hypothesize that regions with higher levels of disadvantage (i.e., higher poverty) will be less likely to have ACOs form, either because the providers serving these patients tend to be themselves less resourced or because providers in these regions may be less confident in their ability to achieve cost and quality benchmarks for their patient population. We also control for regional effects, population size, and urbanicity.
Data and Methods
Design Overview
We carried out a cross-sectional study of all ACOs in the United States established by August 2012. We identified all publicly announced ACOs; documented all ACO service locations (practices, clinics, hospitals); and matched service locations to local areas, defined as Dartmouth Atlas hospital service areas (HSAs). For all hospital service areas, we determined whether at least one ACO had a service location within the HSA. We used information on the demographic and health-system characteristics of these HSAs to analyze characteristics associated with the local presence of one or more ACOs, using multivariate logistic regression to estimate the relative importance of each attribute.
Study Population: Identifying and Locating ACOs
We define an ACO as a group of providers collectively held accountable for the total cost and quality of care for a defined patient population. We examined ACOs established by August 2012, when we collected our data.
We identified ACOs through multiple sources. We first identified participants in federal ACO programs: the Medicare Shared Savings Program and the Pioneer ACO Program, both publicly available. Second, we identified ACOs participating in state Medicaid ACO programs, either through publicly available announcements or communication with state Medicaid offices. Third, we identified commercial payer ACOs. Because no comprehensive, public database exists of commercial payer ACOs, we identified these organizations through a variety of sources, including the following: participation in ACO implementation or learning collaboratives (including Premier Inc, the Brookings-Dartmouth Learning Network, and the American Medical Group Association), national surveys identifying ACOs (such as Health Research and Educational Trust's Care Coordination Survey, National Survey of Provider Organizations III), published ACO case studies, certification by the National Committee for Quality Assurance, and public notices of ACO contracts (such as press releases). We only included organizations for which we could confirm a commercial payer for the ACO contract. We confirmed this through various sources, including the ACO, commercial payers, and public notices. We excluded ACOs where we could not identify a payer for an ACO contract. Notably, we excluded organizations that did not meet our above definition of an ACO; most often we excluded organizations that had pay-for-performance but no responsibility for total cost of care.
To identify geographic areas served by ACOs, in June through August 2012 we recorded service locations of all identified ACOs. For each ACO, we documented the zip codes of all service locations, including physician practices, clinics, and hospitals. We identified service locations from the following sources: websites of organizations, public lists of participating ACO providers, and correspondence with ACOs for lists of provider locations.
Characteristics of Local Areas
Our operational definition of a local area is a hospital service area (HSA). The Dartmouth Atlas of Health Care defines 3,436 HSAs, each consisting of a group of zip codes clustered based on travel patterns to local hospitals. Hospital service areas are an appropriate geography for examining where ACOs are forming because they represent local health care markets. We linked each ACO service location (hospital, clinic, or practice) to the corresponding HSA. Each ACO is linked to at least one HSA and often more than one HSA (when the ACO had service locations across multiple HSAs). Likewise, some HSAs contain more than one ACO service location. We use all HSAs in our analysis, and our outcome is a dichotomous variable: whether an HSA contains an ACO service location or not. We also consider outcomes for whether an HSA contains a Medicare ACO service location and whether an HSA contains a private payer ACO service location.
We use measures of the local health care system from the Dartmouth Atlas of Health Care based on 2010 100 percent Medicare fee-for-service claims data (Table 1). We begin with claims-based measures of quality, from which we derived two factor scores for use in our multivariate models. We had available a set of eight claims-based quality measures: proportion of coronary artery disease patients that received blood lipids tests, proportion of diabetics that received blood lipids tests, the proportion of diabetics receiving hemoglobin A1C tests, the proportion of women aged 67–69 receiving a mammogram, the proportion of diabetics receiving an eye exam, the proportion of diabetics with emergency room visits, the proportion of diabetics with hospital admissions, and the number of ambulatory care sensitive condition discharges per 1,000 Medicare enrollees. These variables were highly correlated. We opted to create two factor scores derived from a principal factors exploratory factor analysis of all eight of our quality measures.1 Two factors emerged from this analysis: one broadly clustered around diagnostic testing (blood lipids and hemoglobin A1C tests for diabetics, blood lipids tests for coronary artery disease patients), and the other broadly clustered around chronic disease management (mammograms; hospitalizations, ER visits, and eye exams for diabetics; and discharges for ambulatory care sensitive conditions).
Table 1.
Descriptions, Measurements, and Univariate Means for Variables Used in Analysis
| Variable | Data Source | Measurement | HSAs with no ACO Mean (SD) | HSAs with 1 or more ACOs Mean (SD) |
|---|---|---|---|---|
| Health care system characteristics | ||||
| Mortality | Dartmouth Atlas | Mortality rate per 1,000 Medicare enrollees; age-sex-race adjusted | 5.02 (1.36) | 4.78 (.57) |
| Quality score – chronic disease management | Dartmouth Atlas | Factor score of chronic disease management quality measures | −0.09 (.88) | 0.21 (.64) |
| Quality score – diagnostic tests | Dartmouth Atlas | Factor score of diagnostic test quality measures | −0.13 (1.00) | 0.34 (.63) |
| Total Medicare reimbursement per enrollee | Dartmouth Atlas | Dollars, thousands (unadjusted) | 8.91 (1.72) | 9.33 (1.87) |
| Acute care hospital bed supply | Dartmouth Atlas | Per 100,000 residents | 3.32 (1.42) | 2.36 (.73) |
| Presence of a hospital associated with a system or network | American Hospital Association survey, 2010 | Dichotomous (1/0) | 0.32 (0.47) | 0.46 (0.50) |
| Physician supply | Dartmouth Atlas | Per 100,000 residents | 198.6 (45.99) | 209.1 (56.13) |
| Concentration of primary care providers | 100% Medicare claims | Herfindahl-Hirschman Index, thousands | 1.90 (3.04) | 0.89 (2.05) |
| Number of primary care medical groups | 100% Medicare claims | Number of tax ID numbers for primary care providers per 1,000 residents | 0.31 (.21) | 0.25 (.16) |
| Managed care penetration | 100% Medicare claims | Proportion of Medicare beneficiaries with Medicare Advantage coverage | 0.18 (.14) | 0.27 (.15) |
| Socioeconomic and demographic characteristics | ||||
| Total population | American Community Survey | Population, thousands | 57.3 (105.45) | 183.0 (319.52) |
| Percent in poverty | American Community Survey | Proportion | 0.05 (.03) | 0.04 (.03) |
| Percent urban | American Community Survey | Proportion | 0.48 (.29) | 0.73 (.27) |
| South | American Community Survey | Dichotomous (1/0) | 0.43 (.50) | 0.22 (.42) |
| Midwest | American Community Survey | Dichotomous (1/0) | 0.32 (.47) | 0.29 (.45) |
| West | American Community Survey | Dichotomous (1/0) | 0.15 (.35) | 0.23 (.42) |
We included several additional measures of local health care (Table 1) such as the total cost of care, measured as the total Medicare reimbursements per beneficiary; two measures of health care supply, acute care bed supply and physician supply; the number of primary care physician practices (solo or group); a measure of primary care concentration; and a measure of managed care penetration. To obtain a measure of the number of primary care groups, any tax ID that included a primary care physician was counted as a group with primary care (rather than groups with exclusively primary care physicians); specialties included were general practice, internal medicine, family practice, and geriatrics. Concentration of allowed Medicare charges across primary care physician practices was computed using the Herfindahl-Hirschman index, and indicates if care in select practices (defined as tax ID numbers) dominate the market or many practices share the market equitably. In addition, from the 2010 American Hospital Association survey we include an indicator if an HSA includes one or more hospitals associated with a health system or network. Finally, we use a measure of managed care penetration; our measure is the proportion of all Medicare beneficiaries in a given hospital service area that have one or more months of managed care coverage (Medicare Advantage) rather than traditional fee-for-service Medicare.
We also include data on socioeconomic and demographic characteristics of hospital service areas (Table 1). From the 2010 Census we include age distribution; from the 2000 Census we include percent living in urban areas (not available for the 2010 Census at time of writing). From the 2010 American Community Survey 5-year estimates, we include percent of residents under the federal poverty line and geographic region. Data were aggregated to the HSA-level from ZIP code tabulation area (ZCTA) or census tracts using geographic centroids.2
Statistical Methods
We used multivariate logistic regression to determine which local area characteristics were associated with our dichotomous outcome: whether an HSA had at least one ACO service location present. We regressed ACO presence on health care system measures and local demographic characteristics (Table 1). In addition to logistic models, we tested several other model specifications changing the form of the dependent variable, including Poisson models (outcome specified as the count of ACOs) and ordinal models (outcome specified as 0, 1, or 2+ ACOs in a local area). Substantive results in these models were very similar to the logistic model. Overall, the models showed that the same factors associated with presence of a single ACO were also associated with presence of more than one ACO. We opted to present results from logistic regression for simplicity in describing predicted values.
We tested additional variables not included in models presented here. Socioeconomic characteristics included the following: racial/ethnic composition, percent foreign born, mean income, household size, and education level. Health care system characteristics included supply of physicians (separate for primary care, specialists, and medical specialists) and primary care provider visits. These factors were not significantly associated with ACO presence and were excluded from models reported; our results are not sensitive to the inclusion of these variables.
Results
Number of ACOs and Geographic Scope of Implementation
We identified a total of 227 accountable care organizations that met our inclusion criteria. Overall, 27 percent of local areas are served by at least one ACO, and 9 percent of local areas are served by two or more ACOs. About 55 percent of all Americans reside in local areas with at least one ACO (Figure 1). The coverage of ACOs varied by type of payer—21 percent of local areas were served by at least one Medicare ACO, 13 percent were served by at least one private payer ACO, and 3 percent were served by at least one Medicaid ACO (confined almost entirely to states that launched Medicaid ACO projects: Oregon, Minnesota, and New Jersey).
Figure 1.
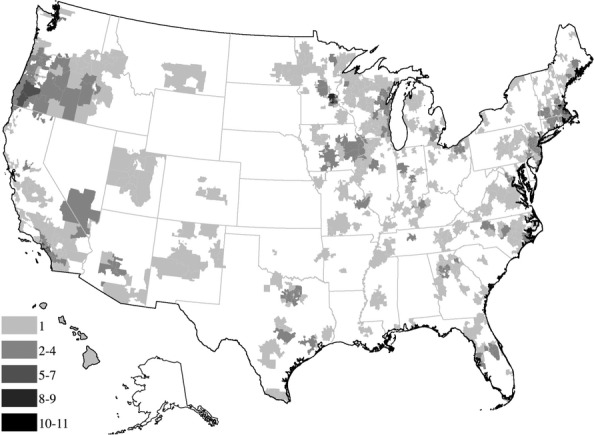
Total Number of ACOs per Hospital Service Area
The accountable care organizations themselves also varied considerably. Many ACOs (37 percent) had service locations in only one area. In contrast, 25 percent of ACOs had a presence in eight or more areas. These results reflect great variation in the types of organizations pursuing the ACO model (Song and Lee 2013). The geographically expansive ACOs were generally integrated delivery systems serving large regions or independent practice associations consisting of many practices. ACOs serving just one local area included single hospitals, standalone clinics, and ACOs working in a targeted area, such as county- or city-based ACOs.
Local Characteristics Associated with ACO Presence
Table 1 presents the descriptive characteristics of local areas with and without ACO service locations. Table 2 reports logistic regression coefficients and t-values for three outcomes: any ACO (Model 1), any Medicare ACO (Model 2), and any private payer ACO (Model 3) in a hospital service area. To illustrate the relative importance of each variable, Figure 2 depicts predicted probabilities of ACO presence (all payers) in a local area across key variables of interest, calculated from the underlying logistic regression model (King, Tomz, and Wittenberg 2000; Tomz, Wittenberg, and King 2003). We illustrate the predicted probability of any ACO being present when the independent variable is at a low value (defined as at the mean of the lowest quintile for continuous variables) compared to a high value (the mean of the highest quintile). Throughout the results we present predicted probabilities from any ACO presence, with discussion of the Medicare and private payer specific models when appropriate.
Table 2.
Coefficients and t-Values from Logistic Models Regressing Presence of One or More ACOs on Local Health Care and Socioeconomic Characteristics
| Variable | Any ACO | Medicare ACO | Private Payer ACO |
|---|---|---|---|
| Coef. (t-Value) | Coef. (t-Value) | Coef. (t-Value) | |
| Health care system characteristics | |||
| Mortality | 0.128 (1.47) | 0.0343 (0.42) | 0.0388 (0.30) |
| Preventive care factor score | 0.304** (3.23) | 0.377*** (3.75) | 0.402** (2.95) |
| Follow up care factor score | 0.486*** (6.30) | 0.375*** (4.56) | 0.571*** (4.99) |
| Total Medicare reimbursements | 0.115** (3.16) | 0.221*** (5.75) | 0.201*** (4.14) |
| Acute care bed supply | −0.252*** (−3.39) | −0.162* (−2.06) | −0.293** (−2.58) |
| Presence of network-affiliated hospital | 0.271** (2.73) | 0.0622 (0.59) | 0.378** (3.04) |
| Physician supply | 0.00461*** (4.04) | 0.00219 (1.83) | 0.00394** (2.73) |
| Local market concentration of primary care | −0.0393 (−1.52) | −0.0356 (−1.29) | −0.165*** (−3.62) |
| Number physician groups | −1.231*** (−3.48) | −1.212** (−3.18) | −3.534*** (−6.13) |
| Managed care penetration | 1.618*** (4.72) | 1.514*** (4.19) | 0.698 (1.56) |
| Socioeconomic and demographic characteristics | |||
| Total population (tens of thousands) | 0.00189*** (5.31) | 0.00183*** (5.75) | 0.000807*** (3.37) |
| Percent in poverty | −8.113*** (−4.24) | −9.432*** (−4.50) | −16.00*** (−6.03) |
| Percent urban | 1.019*** (4.45) | 0.991*** (4.03) | 1.062***(3.32) |
| South | −0.841*** (−5.74) | −0.985*** (−6.28) | −0.420* (−2.31) |
| Midwest | −0.308* (−2.11) | −0.117 (−0.77) | −0.0330 (−0.18) |
| West | −0.150 (−0.91) | −0.526** (−3.04) | −0.109 (−0.53) |
| Constant | −3.142*** (−4.68) | −3.594*** (−5.27) | −3.455*** (−3.59) |
| N | 3,133 | 3,133 | 3,133 |
| Pseudo R-sq | 0.238 | 0.224 | 0.244 |
Note. *p < .05, **p < .01, ***p < .001.
Figure 2.
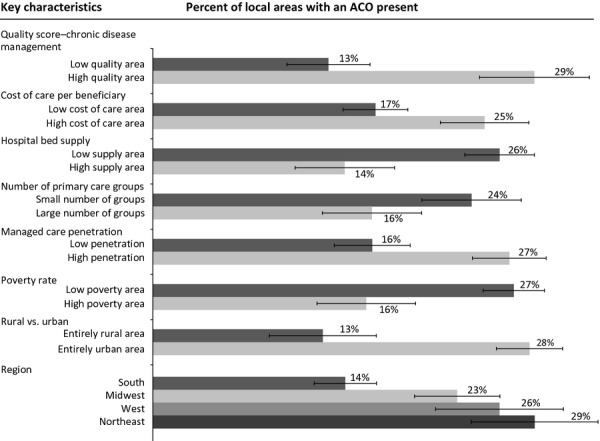
Regression Adjusted Percentages of Local Areas with ACOs by Key Characteristics; Key Characteristics Are Compared at Low Values (Mean of Lowest Quintile) and High Values (Mean of Highest Quintile)
Across HSAs, both quality scores are positively and significantly associated with the presence of an ACO. After adjusting for other characteristics, ACOs have formed in 25 percent of HSAs in the top quintile of diagnostic testing quality, but in only 15 percent of HSAs in the lowest quintile of quality. Similarly, ACOs have formed in areas with better chronic disease management quality (29 percent of high-quality areas vs. 13 percent of low-quality areas). The magnitude of these coefficients is similar across both Medicare and private payer models. In addition, local areas that have higher per capita Medicare costs are significantly more likely to have an ACO present (25 percent of high-cost areas compared to 17 percent of low-cost areas). This effect is larger for Medicare ACO presence than private payer ACOs presence. Finally, the supply of acute care beds is negatively associated with ACO presence; areas with more acute care beds are less likely to be served by an ACO (14 percent of high-supply areas contain an ACO compared to 26 percent of low-supply areas). Again, this is significant across both Medicare and private payer models.
Additional characteristics of the health care system revolve around physician presence, concentration, and managed care. The number of physician groups in an area is negatively associated with ACO presence, controlling for total number of physicians that is, in two regions with similar numbers of physicians, the region where physicians are organized into fewer physician groups is more likely to have an ACO present (24 percent of areas compared to 16 percent of areas with many groups). This effect is larger for private payer ACO presence, though still important for Medicare ACO presence. Market concentration does not have an independent effect on Medicare ACO presence or overall ACO presence, but it does have a small, negative effect on private payer ACO presence. Finally, managed care penetration has a positive effect: 27 percent of areas with high managed care penetration have an ACO present compared to 16 percent of areas with low managed care penetration. Notably, this effect is not significant for private payer ACOs, but only for Medicare ACOs, perhaps given we measure only Medicare managed care penetration and not managed care penetration among commercial payers.
Local socioeconomic and demographic characteristics are also associated with ACO presence. The proportion of residents under the federal poverty threshold is negatively associated with ACO presence, meaning HSAs with higher poverty rates are less likely to have an ACO present (16 percent) compared to places with lower poverty (27 percent). This poverty effect is stronger for private payer ACO presence than Medicare ACO presence. Similarly, urban areas are considerably more likely to have an ACO present compared to rural areas (28 percent compared to 13 percent). Finally, there are remaining regional effects even after controlling for socioeconomic, demographic, and health care factors (14 percent of areas in the South are served by an ACO compared to 29 percent in the Northeast, 26 percent in the West, and 23 percent in the Midwest), though these effects vary by payer.
Discussion
We find that accountable care organizations are present in a substantial fraction of U.S. Hospital Service Areas: 55 percent of Americans live in local areas served by a total of 227 ACOs. However, ACO formation is uneven. ACOs are more likely to have formed in high-cost areas and areas that are high performing on selected claims-based quality measures. ACOs are also more likely to have formed in regions with fewer physician groups, even when holding the overall number of physicians constant. Finally, ACOs are less likely to have formed in high-poverty regions and rural areas. These findings provide the first empirical evidence regarding what external market factors may facilitate or inhibit ACO formation.
These findings are consistent with several hypotheses about what may influence ACO formation. Medicare's ACO programs require ACOs to reach thresholds of performance on required quality measures to be eligible for shared savings. In local areas already performing well on quality, providers may be more confident about meeting quality standards and therefore more likely to undertake an ACO contract. ACOs may be more likely to form in high-cost regions for similar reasons. Although there is marked variation in provider-specific costs within regions (Yasaitis et al. 2009), organizations in high-spending regions likely have greater confidence that they can reduce per capita costs than organizations in low-spending regions.
Next, we found that regions with fewer primary care physician groups are more likely to contain established ACOs. This finding is consistent with a few possible hypotheses. First, it may be that physicians in regions with fewer billing groups find it easier to form an ACO; this may be because these larger groups have enough patients to meet the minimum threshold of patients necessary to become an ACO. In contrast, in regions with many, smaller groups, physicians may need to band together in new ways to have enough patients to pursue an ACO contract. Another hypothesis may be that in regions with fewer groups, the providers have a tighter relationship with the major payers in the area, and this may allow the payers and providers to negotiate innovative payment contracts such as ACOs more easily than in regions where payers are working with a much larger number of physician groups. We also found that regions with more managed care penetration were also more likely to have ACOs. This may be because providers in these regions are more likely to have experience with risk-based payment through managed care and are thus more willing or ready to undertake an ACO contract.
Finally, we hypothesized that health care organizations in rural areas or areas with higher poverty may themselves be underresourced and have less capacity to undertake the capital investments necessary to successfully implement an ACO contract (Pollack and Armstrong 2011; Lewis et al. 2012). In addition, the limited extent of Medicaid ACO programs almost certainly limits participation in ACOs by providers serving a large shared of Medicaid patients. These hypotheses would suggest that policy makers concerned about broadening adoption of the ACO model may want to consider adapting ACO program designs that might facilitate the inclusion and success of such provider organizations (Lewis et al. 2012), such as Medicaid ACO demonstrations, startup financing programs such as Medicare's Advanced Payment initiative, or modifications to risk adjustment methods.
This study has important limitations. We examine only publicly identified ACOs; some commercial payer ACO contracts are likely confidential and not included in our data. Second, many characteristics we examined are likely more important at the provider or organizational level rather than a regional level. We are also unable to examine many other potential determinants of ACO formation that would operate at the organizational level, such as an organization's structure and leadership; care coordination capabilities; and experience with quality improvement (Fisher et al. 2012). Finally, our findings are based on a point in time when the field of ACOs is rapidly evolving, and many ACOs have begun contracts since our data were collected.
This study provided no information about the performance of ACOs identified, and it is beyond the scope of this study to evaluate whether the uneven distribution of ACOs should be a reason for concern. Our findings are consistent with concerns previously raised about the barriers to ACO formation (Burns and Pauly 2012; Evans 2012) and potential challenges facing ACOs that care for vulnerable populations (Pollack and Armstrong 2011; Lewis et al. 2012). The importance of understanding the effects of ACOs underscores the need for timely evidence on the impact of ACOs on cost and quality of care (Fisher et al. 2012).
Our findings have several implications. For policy makers, our results are consistent with the intuition that ACOs may be less likely to form in regions where it may be more difficult to achieve savings or meet quality benchmarks. To the extent that policy makers want to encourage ACO formation, further adaptation of the payment model may be warranted. For example, payers could consider how to structure cost benchmarks to appeal to providers who are already delivering low-cost care. On the quality side, eligibility for shared savings could be made contingent on demonstrating improvement in quality measures as an alternative to achievement of specific levels of performance. Payers may also consider how to best structure contracts to facilitate inclusion of providers with little experience with managed care.
In addition, further research may be warranted into areas where there is little ACO entry, and more fine-grained analysis of provider market characteristics may also provide insight. For example, we have examined only the concentration of primary care providers; it may be that concentration of certain key specialties, such as cardiology or oncology, could inhibit ACO success in a local area unless those specialists are part of the ACO. Specific details about benchmarks, performance measures, and patient assignment might also impact diffusion of ACOs across local areas.
Finally, our findings suggest that provider organizations with ACO contracts have a presence in a substantial fraction of U.S. health care markets. Our data cannot speak to ACO market penetration within any given HSA; while 55 percent of Americans live in areas where ACOs have service locations, a significantly smaller (and presently unknown) share are receiving care as part of an ACO contract. As more data become available on ACOs, future research will be able to speak to important questions such as how many people are currently getting care at ACOs, what types of capabilities these ACOs have, and whether these ACOs are successful at achieving the aims of reduced costs and high-quality care. In addition, whether the relatively large geographic spread of ACOs leads to further adoption of the model and whether the ACO model will contribute to improve care and to lower costs remains to be seen.
Acknowledgments
Joint Acknowledgment/Disclosure Statement: This study was supported by The Commonwealth Fund. A previous version of this paper was presented at the 2013 Academy Health Annual Research Meeting in Baltimore, MD.
Disclosures: None.
Disclaimers: None.
Notes
We tested alternate factor analysis methods (including maximum likelihood, iterated component factors, and principal components analysis), and results were substantively similar across specifications.
For ZCTA and tract-level data analyses, 8 and 53 HSAs, respectively, were omitted due to nonassignment.
Supporting Information
Additional supporting information may be found in the online version of this article:
Appendix SA1: Author Matrix.
References
- Baker LC. “Association of Managed Care Market Share and Health Expenditures for Fee-for-Service Medicare Patients”. Journal of the American Medical Association. 1999;281(5):432–7. doi: 10.1001/jama.281.5.432. doi: 10.1001/jama.281.5.432. [DOI] [PubMed] [Google Scholar]
- Berenson RA, Ginsburg PB, Kemper N. “Unchecked Provider Clout in California Foreshadows Challenges to Health Reform”. Health Affairs. 2010;29(4):699–705. doi: 10.1377/hlthaff.2009.0715. doi: 10.1377/hlthaff.2009.0715. [DOI] [PubMed] [Google Scholar]
- Berenson RA, Ginsburg PB, Christianson JB, Yee T. “The Growing Power of Some Providers to Win Steep Payment Increases from Insurers Suggests Policy Remedies May Be Needed”. Health Affairs. 2012;31(5):973–81. doi: 10.1377/hlthaff.2011.0920. doi: 10.1377/hlthaff.2011.0920. [DOI] [PubMed] [Google Scholar]
- Berwick DM. “Making Good on ACOs' Promise—The Final Rule for the Medicare Shared Savings Program”. New England Journal of Medicine. 2011;365(19):1753–6. doi: 10.1056/NEJMp1111671. doi: 10.1056/NEJMp1111671. [DOI] [PubMed] [Google Scholar]
- Berwick DM, Hackbarth AD. “Eliminating Waste in US Health Care”. Journal of the American Medical Association. 2012;307(14):1513–6. doi: 10.1001/jama.2012.362. doi: 10.1001/jama.2012.362. [DOI] [PubMed] [Google Scholar]
- Burns LR, Pauly MV. “Accountable Care Organizations May Have Difficulty Avoiding the Failures of Integrated Delivery Networks of the 1990s”. Health Affairs. 2012;31(11):2407–16. doi: 10.1377/hlthaff.2011.0675. doi: 10.1377/hlthaff.2011.0675. [DOI] [PubMed] [Google Scholar]
- Casalino LP, Shortell SM. 2011. The ACO Race Is On: Navigating the Terrain. [accessed on April 25, 2012]. Available at http://healthaffairs.org/blog/2011/10/24/the-aco-race-is-on-navigating-the-terrain/
- Colla CH, Wennberg DE, Meara E, Skinner JS, Gottlieb D, Lewis VA, Snyder CM, Fisher ES. “Spending Differences Associated with the Medicare Physician Group Practice Demonstration”. Journal of the American Medical Association. 2012;308(10):1015–23. doi: 10.1001/2012.jama.10812. doi: 10.1001/2012.jama.10812. [DOI] [PMC free article] [PubMed] [Google Scholar]
- Eddy DM, Shah R. “A Simulation Shows Limited Savings from Meeting Quality Targets under the Medicare Shared Savings Program”. Health Affairs. 2012;31(11):2554–62. doi: 10.1377/hlthaff.2012.0385. doi: 10.1377/hlthaff.2012.0385. [DOI] [PubMed] [Google Scholar]
- Evans M. “The Early Returns on Accountable Care”. Modern Healthcare. 2012;42(31):S1–5. [PubMed] [Google Scholar]
- Fisher ES, McClellan MB, Safran DG. “Building the Path to Accountable Care”. New England Journal of Medicine. 2011;365(26):2445–7. doi: 10.1056/NEJMp1112442. doi: 10.1056/NEJMp1112442. [DOI] [PubMed] [Google Scholar]
- Fisher ES, Shortell SM. “Accountable Care Organizations: Accountable for What, to Whom, and How”. Journal of the American Medical Association. 2010;304(15):1715–6. doi: 10.1001/jama.2010.1513. doi: 10.1001/jama.2010.1513. [DOI] [PubMed] [Google Scholar]
- Fisher ES, Staiger DO, Bynum JPW, Gottlieb DJ. “Creating Accountable Care Organizations: The Extended Hospital Medical Staff”. Health Affairs. 2007;26(1):44–57. doi: 10.1377/hlthaff.26.1.w44. doi: 10.1377/hlthaff.26.1.w44. [DOI] [PMC free article] [PubMed] [Google Scholar]
- Fisher ES, Shortell SM, Kreindler SA, Citters ADV, Larson BK. “A Framework for Evaluating the Formation, Implementation, and Performance of Accountable Care Organizations”. Health Affairs. 2012;31(11):2368–78. doi: 10.1377/hlthaff.2012.0544. doi: 10.1377/hlthaff.2012.0544. [DOI] [PubMed] [Google Scholar]
- King G, Tomz M, Wittenberg J. “Making the Most of Statistical Analyses: Improving Interpretation and Presentation”. American Journal of Political Science. 2000;44(2):347–61. [Google Scholar]
- Larson BK, Citters ADV, Kreindler SA, Carluzzo KL, Gbemudu JN, Wu FM, Nelson EC, Shortell SM, Fisher ES. “Insights from Transformations Underway at Four Brookings-Dartmouth Accountable Care Organization Pilot Sites”. Health Affairs. 2012;31(11):2395–406. doi: 10.1377/hlthaff.2011.1219. doi: 10.1377/hlthaff.2011.1219. [DOI] [PubMed] [Google Scholar]
- Lewis VA, Larson BK, McClurg AB, Boswell RG, Fisher ES. “The Promise and Peril of Accountable Care for Vulnerable Populations: A Framework for Overcoming Obstacles”. Health Affairs (Project Hope) 2012;31(8):1777–85. doi: 10.1377/hlthaff.2012.0490. doi: 10.1377/hlthaff.2012.0490. [DOI] [PubMed] [Google Scholar]
- McGinnis T, Small DM. Accountable Care Organizations in Medicaid: Emerging Practices to Guide Program Design. Hamilton, NJ: Center for Health Care Strategies, Inc; 2012. [Google Scholar]
- Pollack CE, Armstrong K. “Accountable Care Organizations and Health Care Disparities”. Journal of the American Medical Association. 2011;305(16):1706–7. doi: 10.1001/jama.2011.533. doi: 10.1001/jama.2011.533. [DOI] [PMC free article] [PubMed] [Google Scholar]
- Rosenthal MB, Landon BE, Normand S-LT, Frank RG, Epstein AM. “Pay for Performance in Commercial HMOs”. New England Journal of Medicine. 2006;355(18):1895–902. doi: 10.1056/NEJMsa063682. doi: 10.1056/NEJMsa063682. [DOI] [PubMed] [Google Scholar]
- Scheffler R, Shortell S, Wilensky G. “Accountable Care Organizations and Antitrust: Restructuring the Health Care Market”. Journal of the American Medical Association. 2012;307(14):1493–4. doi: 10.1001/jama.2012.451. [DOI] [PubMed] [Google Scholar]
- Song Z, Lee T. “The Era of Delivery System Reform Begins”. Journal of the American Medical Association. 2013;309(1):35–6. doi: 10.1001/jama.2012.96870. doi: 10.1001/jama.2012.96870. [DOI] [PMC free article] [PubMed] [Google Scholar]
- Song Z, Safran DG, Landon BE, He Y, Ellis RP, Mechanic RE, Day MP, Chernew ME. “Health Care Spending and Quality in Year 1 of the Alternative Quality Contract”. New England Journal of Medicine. 2011;365(10):909–18. doi: 10.1056/NEJMsa1101416. doi: 10.1056/NEJMsa1101416. [DOI] [PMC free article] [PubMed] [Google Scholar]
- Song Z, Safran DG, Landon BE, Landrum MB, He Y, Mechanic RE, Day MP, Chernew ME. “The ‘Alternative Quality Contract’, Based on a Global Budget, Lowered Medical Spending and Improved Quality”. Health Affairs. 2012;31(8):1885–94. doi: 10.1377/hlthaff.2012.0327. doi: 10.1377/hlthaff.2012.0327. [DOI] [PMC free article] [PubMed] [Google Scholar]
- Tomz M, Wittenberg J, King G. 2003. . “CLARIFY: Software for Interpreting and Presenting Statistical Results,” Citeseer [accessed on July 5, 2010]. Available at http://gking.harvard.edu/clarify/docs/clarify.html.
- Weeks WB, Gottlieb DJ, Nyweide DJ, Sutherland JM, Bynum J, Casalino LP, Gillies RR, Shortell SM, Fisher ES. “Higher Health Care Quality and Bigger Savings Found at Large Multispecialty Medical Groups”. Health Affairs. 2010;29(5):991–7. doi: 10.1377/hlthaff.2009.0388. doi: 10.1377/hlthaff.2009.0388. [DOI] [PubMed] [Google Scholar]
- Yasaitis L, Fisher ES, Skinner JS, Chandra A. “Hospital Quality and Intensity of Spending: Is There an Association?”. Health Affairs. 2009;28(4):w566–72. doi: 10.1377/hlthaff.28.4.w566. doi: 10.1377/hlthaff.28.4.w566. [DOI] [PMC free article] [PubMed] [Google Scholar]
Associated Data
This section collects any data citations, data availability statements, or supplementary materials included in this article.