

Abstract
Objective. To examine trends in the proportion of work-related emergency department visits not expected to be paid by workers' compensation during 2003–2006, and to identify demographic and clinical correlates of such visits.
Data Source. A total of 3,881 work-related emergency department visit records drawn from the 2003–2006 National Hospital Ambulatory Medical Care Surveys.
Study Design. Secondary, cross-sectional analyses of work-related emergency department visit data were performed. Odds ratios and 95 percent confidence intervals were modeled using logistic regression.
Principal Findings. A substantial and increasing proportion of work-related emergency department visits in the United States were not expected to be paid by workers' compensation. Private insurance, Medicaid, Medicare, and workers themselves were expected to pay for 40 percent of the work-related emergency department visits with this percentage increasing annually. Work-related visits by blacks, in the South, to for-profit hospitals and for work-related illnesses were all more likely not to be paid by workers' compensation.
Conclusions. Emergency department-based surveillance and research that determine work-relatedness on the basis of expected payment by workers' compensation systematically underestimate the occurrence of occupational illness and injury. This has important methodological and policy implications.
Keywords: Workers' compensation, occupational injuries, occupational diseases
Work-related injuries and illnesses contribute substantially to overall morbidity in the United States, imposing considerable burdens on affected workers, their families, employers, and society (Boden, Biddle, and Spieler 2001; US Department of Labor, Bureau of Labor Statistics 2010). Leigh (2011) estimated that in 2007 there were more than 8.5 million cases of work-related injury and illness with medical costs alone estimated at nearly $50 billion. Reliable data on the occurrence, causes, costs, and consequences of occupational injury and illness are continually needed to set priorities, develop policies, and implement interventions for the prevention of disease, injury, and disability.
Occupational health surveillance in the United States relies largely on employer reporting of work-related illnesses and injuries. The Bureau of Labor Statistics' (BLS) annual Survey of Occupational Injuries and Illnesses (SOII), which is based on illness and injury logs from a national sample of employers, is the principal source of national- and state-level estimates of occupational morbidity (US Department of Labor, Bureau of Labor Statistics 2012c). Worker's compensation (WC) data are sometimes used for surveillance and research in occupational health instead of employer reports. In some cases, WC systems themselves are used as an alternate data source, with rates being calculated as the number of paid claims over the number of covered workers. In other cases, expected payment by WC is used as a proxy indicator for the work-relatedness of particular illnesses or injuries in the analysis of health care encounter data (Council of State and Territorial Epidemiologists 2005; Thomsen et al. 2007). However, WC coverage policies vary across states, coding systems are not always standardized, and the data are often proprietary, making state-to-state comparisons unreliable (Utterback et al. 2012).
Recent studies have demonstrated that both the SOII and WC data systems significantly underestimate the burden of work-related injury and illness (Boden and Ozonoff 2008; Centers for Disease Control and Prevention 2010b). In contrast to Leigh's estimate of 8.5 million cases of work-related injuries and illnesses, the BLS estimate for 2007 was 4 million (Leigh 2011). These underestimates result from a combination of undercoverage and underreporting. The SOII includes only those injuries and illnesses that are required to be recorded under Occupational Safety and Health Administration (OSHA) recordkeeping rules (excluding, for example, workplace injuries requiring first-aid only) and specifically excludes self-employed individuals, workers on farms with fewer than 11 employees, private household workers, workers whose employers are regulated by federal agencies other than OSHA, federal government workers, and, until recently, state and local government workers (US Department of Labor, Bureau of Labor Statistics 2012a). WC coverage varies between states but may exclude small employers, the self-employed, specific occupations, and, depending on the state, certain types of work-related illness and injury, such as carpal tunnel syndrome (Sengupta, Reno, and Burton 2011). In addition, some covered workers may not report eligible illnesses or injuries to their employers or file WC claims, because of concerns about employer or co-worker retaliation for injury reporting, administrative barriers, and access to alternative health insurance (Boden, Biddle, and Spieler 2001; Azaroff, Levenstein, and Wegman 2002; Strunin and Boden 2004; Fan et al. 2006; US Department of Labor, Bureau of Labor Statistics 2012a).
When not paid by WC, medical costs for work-related injuries and illnesses are paid by private or government-funded health insurance programs, by workers themselves, or indirectly by health care consumers when unpaid costs are absorbed by providers. In this study, we examine the proportion of work-related injury and illness that is not expected to be paid by WC using nationally representative hospital emergency department (ED) data from the National Hospital Ambulatory Medical Care Survey (NHAMCS). Work-related injuries and illnesses from this survey are limited to those who receive their care through EDs, but these cases are not limited by type of employer, whether the injury would be recordable under OSHA regulations, or whether WC was the expected payer. Using these data, we examined trends in the proportion of work-related ED visits not expected to be paid by WC between 2003 and 2006, explored the characteristics of visits not paid by WC, and estimated the proportion of cases paid by other private or publicly financed sources.
Methods
Data
We performed cross-sectional analyses of data from the combined ED files of the 2003–2006 NHAMCS, a nationally representative, annual survey of visits to noninstitutional, general, and short-stay hospitals, excluding federal, military, and VA hospitals. A multistage probability sampling design is used for NHAMCS in which geographically defined areas are first sampled and then eligible hospitals are sampled from within those areas. For the ED files, individual patient visits during randomly assigned 4-week reporting periods are sampled from each hospital ED. The NHAMCS methodology has been fully described elsewhere (Centers for Disease Control and Prevention 2010a).
Data for NHAMCS are abstracted from patients' hospital records by trained hospital staff and recorded on a standardized patient record form (PRF). In the 2003–2006 surveys, the work-relatedness of ED visits was determined based on the narrative description of the patient's chief complaint and the surrounding events and was coded separately from the expected payer, according to specific instructions. Briefly, the abstractor was instructed to “Mark ‘Yes’ if the patient's condition is a result of an illness, injury or poisoning stemming from work-related activities” (Centers for Disease Control and Prevention 2009, p. 127). Having WC as the expected payer was not required for an ED visit to be identified as work related. For this analysis, we included all records for patients aged ≥15 years where the data abstractor answered “yes” to the question “Is this visit work related?” and where the expected payer for the visit was known.
Variables
The dependent variable, expected payment by WC, was based on the abstractor's determination of the expected source of payment for the visit of interest according to the patient record or separate hospital billing information. Available options for coding expected payer included the following: private insurance, Medicare, Medicaid/SCHIP, WC, self-pay, no charge/charity, other, or unknown. Because the NHAMCS public-use dataset did not include separate variables for individual sources of expected payment in all years of our study period, we analyzed the summary variable for primary expected payer. We counted visits as WC cases when “worker's compensation” was the expected payer and as non-WC cases otherwise.
Independent variables of interest included patient's demographic characteristics (gender, age, race, ethnicity) as well as certain hospital (geographic region, urban/rural location, hospital ownership) and clinical (diagnosis, presenting level of pain, immediacy with which patient should be seen, mode of arrival) characteristics of the visits. Urban or rural location was defined based on whether the hospital was located within a census-designated metropolitan statistical area. Hospital ownership categories included not-for-profit, government (nonfederal), and for-profit.
The physician's primary diagnosis for each ED visit was categorized either as an injury/poisoning or as an illness/other and into subcategories of each based on grouping of three-digit ICD-9-CM codes. The illness/other category included illness and any other noninjury/poisoning reason for the visit, including visits where the primary diagnosis was coded with a V-code (factors affecting health status and contact with health services). The categories for presenting level of pain and immediacy with which patient should be seen came directly from the PRF. The patient's mode of arrival at the ED was collapsed into a dichotomous variable reflecting arrival by ambulance or by some other mode, including walk-ins, police car, etc.
We also included year of visit as an independent variable to assess temporal trend in the proportions of WC versus non-WC visits across the 4 years of data.
Analysis
Descriptive statistics of the work-related ED visits included population-weighted frequencies and their distributions by the selected demographic, hospital and clinical variables, and by year. Point estimates and design-adjusted 95 percent confidence intervals for the proportion of non-WC visits were also calculated for all independent variables. The Rao-Scott design-adjusted Chi-square test for independence was used to assess the statistical significance of differences in the proportion of WC and non-WC visits for each independent variable.
All variables significantly associated with non-WC expected payer status were entered into a logistic regression model to produce multivariable-adjusted odds ratios (AOR) and their 95 percent confidence intervals, modeling the odds that a given visit would be a non-WC visit.
All analyses were population-weighted to account for unequal selection probabilities. The calculation of all standard errors was adjusted to account for the complex, multi-stage nature of the NHAMCS sample design using the SURVEY procedures available in SAS 9.3 (SAS Institute Inc., Cary, NC, USA).
Results
The combined 2003–2006 NHAMCS emergency department files comprised 146,296 records representing an estimated 458,634,000 ED visits occurring during the 4-year study period, 4,059 (2.8 percent) of which were coded as work related. We excluded 139 (3.4 percent) of these work-related cases because the expected payer field was blank or coded “unknown” and 39 (1.0 percent) where the patient's age was <15 years. Thus, the final, unweighted sample size for this study was 3,881. One hundred percent had complete data for all demographic, hospital, and outcome variables. Of the clinical variables, 734 (18.9 percent) records had missing data for presenting level of pain, 594 (15.3 percent) for immediacy with which patient should be seen, and 125 (3.2 percent) for mode of arrival. Records with missing data for a particular variable were dropped from analyses involving that variable.
Our sample represented an estimated 12,132,000 (95 percent CI: 11,046,000–13,218,000) work-related ED visits that occurred during the 4-year study period. The population-weighted distribution of these visits by demographic and hospital variables and by expected payer is presented in Table 1, as is the proportion of non-WC visits. During the 4-year study period, the overall proportion of non-WC visits, as a share of all work-related ED visits, was 39.7 percent (95 percent CI: 36.6–42.8 percent). Variables significantly associated with expected WC payment status included race, region, and hospital ownership.
Table 1.
Distribution of Work-Related Emergency Department Visits by Demographic and Hospital Characteristics and by Non-Worker's Compensation Expected Payer—National Hospital Ambulatory Medical Care Survey, United States, 2003–2006
| Characteristic | Est. Number of ED Visits (% of Total)* | Percent Non-WC Expected Payer (95% CI) | p-Value† |
|---|---|---|---|
| Total | 12,132 (100.0) | 39.65 (36.5–42.8) | – |
| Age | |||
| 15–24 years | 2,574 (21.2) | 38.94 (34.1–43.7) | .29 |
| 25–34 years | 3,164 (26.1) | 36.01 (31.5–40.5) | |
| 35–44 years | 2,968 (24.5) | 41.27 (35.4–47.1) | |
| 45–54 years | 2,190 (18.1) | 41.58 (36.5–46.7) | |
| >54 years | 1,235 (10.2) | 43.08 (36.0–50.2) | |
| Gender | |||
| Female | 3,933 (32.4) | 39.74 (35.8–43.7) | .95 |
| Male | 8,199 (67.6) | 39.60 (36.1–43.1) | |
| Race | |||
| White | 9,952 (82.0) | 37.23 (33.7–40.8) | <.01 |
| Black | 1,839 (15.2) | 52.95 (46.4–59.5) | |
| Other | 341 (2.8) | 38.53 (27.0–50.1) | |
| Ethnicity | |||
| Hispanic or Latino | 1,840 (15.2) | 38.16 (32.0–44.3) | .57 |
| Non Hispanic | 10,292 (84.8) | 39.91 (36.7–43.1) | |
| Geographic region | |||
| Northeast | 2,968 (24.5) | 37.13 (30.1–44.2) | .01 |
| Midwest | 2,880 (23.7) | 38.37 (33.5–43.2) | |
| South | 4,134 (34.1) | 46.05 (41.2–50.9) | |
| West | 2,150 (17.7) | 32.49 (25.0–40.0) | |
| Location | |||
| Non rural | 9,980 (82.3) | 39.83 (36.2–43.4) | .80 |
| Rural | 2,152 (17.7) | 38.81 (31.9–45.7) | |
| Ownership | |||
| Not-for-profit | 9,034 (74.5) | 38.72 (35.2–42.3) | .04 |
| Government, nonfederal | 2,127 (17.5) | 37.97 (31.9–44.1) | |
| For-profit | 972 (8.0) | 51.87 (41.0–62.8) | |
| Expected payer | |||
| Worker's compensation | 7,322 (60.4) | – | – |
| Non-worker' comp | 4,810 (39.7) | – | |
| Private insurance | 2,590 (21.4) | – | |
| Self-pay | 1,380 (11.4) | – | |
| Medicare | 202 (1.7) | – | |
| Medicaid | 422 (3.5) | – | |
| No charge | 32 (0.3) | – | |
| Other | 184 (1.5) | – | |
Thousands of visits.
From the Rao-Scott design-adjusted Chi-square test for independence.
The distribution of work-related ED visits by clinical characteristics, along with non-WC proportions, is presented in Table 2. Illnesses were significantly less likely to have WC as expected payer than were injuries. The proportion of WC versus non-WC visits did not differ significantly across subcategories of injuries. Differences were significant across subcategories of illness, however. The proportion of non-WC visits in the largest group of illnesses, musculoskeletal disorders (40.7 percent), was similar to that of injuries (36.9 percent). WC and non-WC visits did not differ significantly in terms of clinical characteristics reflecting the severity of the condition, such as presenting level of pain, immediacy with which patient should be seen, and mode of arrival (i.e., ambulance vs. self-presentation). The proportion of non-WC visits increased significantly during the study period, from 32.1 percent (95 percent CI: 26.9–37.3) in 2003 to 44.9 percent (95 percent CI: 39.6–50.2) in 2006 (Figure 1).
Table 2.
Distribution of Work-Related Emergency Department Visits by Clinical Characteristics and by Non-Worker's Compensation Expected Payer—National Hospital Ambulatory Medical Care Survey, United States, 2003–2006
| Clinical Characteristic | Est. Number of ED Visits (% of Total*) | Percent Non-WC Expected Payer (95% CI) | p-Value† |
|---|---|---|---|
| Diagnosis type | |||
| Injury or poisoning | 8,941 (73.7) | 36.9 (33.5–40.2) | .77‡, <.01§ |
| Dislocation/fracture | 724 (6.0) | 36.1 (27.6–44.7) | |
| Sprain/strain | 2,119 (17.5) | 35.3 (29.7–40.9) | |
| Laceration/puncture/amputation/avulsion | 2,580 (21.3) | 36.7 (32.4–40.9) | |
| Contusion/abrasion/hematoma/crush | 2,165 (17.9) | 36.7 (31.7–41.6) | |
| Burns | 349 (2.9) | 37.1 (26.2–48.0) | |
| Other injury or poisoning | 1,004 (8.3) | 41.6 (34.0–49.1) | |
| Illness or other reason for visit | 3,191 (26.3) | 47.4 (42.8–52.1) | <.01¶, <.01** |
| Disorders of eye and adnexa | 211 (1.7) | 28.9 (13.7–44.1) | |
| Diseases of skin and subcutaneous tissue | 264 (2.2) | 64.9 (51.4–78.3) | |
| Diseases of musculoskeletal system | 1,219 (10.1) | 40.7 (34.4–46.9) | |
| Symptoms, signs, and ill-defined conditions | 307 (2.5) | 53.8 (40.9–66.7) | |
| Other illness or other reason for visit | 1,189 (9.8) | 52.2 (44.6–59.8) | |
| Presenting level of pain†† | |||
| None | 1,232 (12.5) | 41.5 (35.0–48.1) | .81 |
| Mild | 2,280 (23.2) | 40.0 (35.0–45.0) | |
| Moderate | 3,868 (39.3) | 39.6 (35.7–43.6) | |
| Severe | 2,460 (25.0) | 42.2 (36.7–47.6) | |
| Immediacy with which patient should be seen‡‡ | |||
| <15 minutes | 1,533 (14.9) | 41.6 (35.2–47.9) | .62 |
| 15–60 minutes | 3,712 (36.0) | 40.8 (36.5–45.1) | |
| >1–2 hours | 2,933 (28.4) | 37.0 (32.4–41.7) | |
| >2–24 hours | 2,143 (20.8) | 39.6 (33.1–46.1) | |
| Mode of arrival§§ | |||
| Ambulance | 1,107 (9.4) | 42.9 (35.5–50.6) | .41 |
| Walk-in or public service | 10,634 (90.6) | 39.6 (36.3–42.9) | |
Thousands of visits.
From the Rao-Scott design-adjusted Chi-square test for independence.
Testing distribution of WC payment status across subcategories of “Injury or poisoning.”
Testing distribution of WC payment status by injury/illness.
Testing distribution of WC payment status across subcategories of “Illness or other reason for visit.”
Testing distribution of WC payment status across all injury and illness categories.
Due to missing data for this variable, n = 3,147, estimated N = 9,840,000.
Due to missing data for this variable, n = 3,287, estimated N = 10,320,000.
Due to missing data for this variable, n = 3,756, estimated N = 11,741,000.
Figure 1.
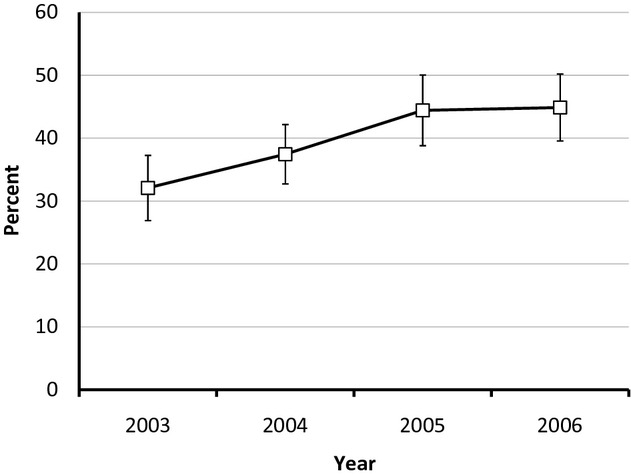
Percent (with 95 percent CI's) of Non-Worker's Compensation Expected Payer Work-Related Emergency Department Visits by Year, National Hospital Ambulatory Medical Care Survey, United States, 2003–2006
The variables race, region, hospital ownership, diagnosis type, and year were included as predictors in the logistic regression model. To estimate the average annual change in the proportion of WC versus non-WC visits, we modeled year as a continuous variable. Multivariable AOR are presented in Table 3. After adjustment for the effects of region, hospital ownership, diagnosis type and year, the odds that a work-related ED visit by a black patient would be a non-WC visit were 72 percent greater than those for a visit by a white patient. The odds that an ED visit in the southern region of the United States would be a non-WC visit were 57 percent higher than in the West. The odds that a visit to a for-profit hospital would be a non-WC visit were 63 percent higher than for a visit to a not-for-profit hospital. The odds that a visit for an illness or other non-injury reason would be a non-WC visit were 52 percent higher than for an injury. Each year during the period 2003–2006, the odds that a given work-related ED visit would be a non-WC visit increased by 19 percent, a trend that was statistically significant.
Table 3.
Multivariable Adjusted Odds Ratios for Non-Worker's Compensation Expected Payer Work-Related Emergency Department Visits—National Hospital Ambulatory Medical Care Survey, United States, 2003–2006
| Characteristic | Adjusted Odds Ratio* (95% CI) |
|---|---|
| Race | |
| White | Ref |
| Black | 1.72 (1.27–2.32) |
| Other | 1.17 (0.64–2.14) |
| Geographic region | |
| Northeast | 1.26 (0.78–2.04) |
| Midwest | 1.30 (0.85–1.98) |
| South | 1.57 (1.02–2.42) |
| West | Ref |
| Ownership | |
| Not-for-profit | Ref |
| Government, nonfederal | 0.92 (0.68–1.24) |
| For-profit | 1.63 (1.08–2.46) |
| Diagnosis type | |
| Injury or poisoning | Ref |
| Illness or other reason for visit | 1.52 (1.26–1.84) |
| Year | 1.19 (1.08–1.31)† |
Odds ratios statistically adjusted for the effect of all other variables in the table.
Odds ratio associated with the average annual change in nonpayment by WC during the study period, year analyzed as continuous variable.
Restricting the analysis to non-WC visits only (n = 1,553), we examined the proportional distribution of expected payer in total and by variables found to be significantly associated with WC payment status in the logistic regression model (Table 4). Globally, racial differences in the distribution of expected payer were statistically significant. While the proportion of non-WC visits expected to be paid by private insurance, self-pay, and other payers was similar for both blacks and non-blacks, we found that visits by blacks (n = 313) were nearly twice as likely as those by nonblacks (n = 1,240) to have Medicaid or Medicare as expected payer. Considering Medicaid separately, visits by blacks were also twice as likely as those by nonblacks to have this expected payer (14.5 percent vs 7.3 percent,  = 8.99, p < .01).
Table 4.
Distribution of Non-Worker's Compensation Expected Payer Work-Related Emergency Department Visits by Selected Characteristics and Expected Payer—National Hospital Ambulatory Medical Care Survey, United States, 2003–2006
| Characteristic | Estimated Number of Visits (% of Total)* | % Paid by Private Insurance | % Paid by Medicaid or Medicare | % Paid by Self-Pay | % Paid by Other | p-Value |
|---|---|---|---|---|---|---|
| Total | 4,810 (100.0) | 53.9 | 13.0 | 28.7 | 4.5 | – |
| Race | ||||||
| Black | 974 (20.2) | 52.1 | 19.2 | 25.9 | 2.8 | |
| Non-black | 3,836 (79.8) | 54.3 | 11.4 | 29.4 | 4.9 | .03 |
| Ownership | ||||||
| For-profit | 504 (10.5) | 53.0 | 10.3 | 34.6 | 2.1 | |
| Other | 4,306 (89.5) | 53.9 | 13.3 | 28.0 | 4.8 | .37 |
| Diagnosis type | ||||||
| Injury or poisoning | 3,296 (68.5) | 56.6 | 12.1 | 27.7 | 3.6 | |
| Illness or other reason | 1,514 (31.5) | 47.9 | 15.0 | 30.7 | 6.4 | .04 |
Thousands of visits.
The distribution of expected payer also differed significantly by diagnosis type. Injury visits were more likely to have private insurance as expected payer than were visits for illnesses or other noninjury reasons.
Discussion
We found that, between 2003 and 2006, approximately 9 million work-related injuries and 3 million work-related illnesses were treated in US hospital EDs. For a substantial proportion of these cases—an estimated 37 percent of injury cases and 47 percent of illness cases—WC was not the expected payer. These findings contribute to the growing literature demonstrating the potential for significant undercounting of injuries and illnesses in occupational health surveillance systems, specifically when work-relatedness is determined by WC status. These results are consistent with those of a recent study using survey data from 10 states which found that the median state proportion of workers whose medical treatment for their self-reported occupational injury was not paid for by WC was 39 percent (Centers for Disease Control and Prevention 2010b).
Our study also contributes new findings that, between 2003 and 2006, the costs for almost 5 million work-related ED visits were paid by private or government health insurance systems or workers themselves, rather than by WC carriers. The costs for work-related ED visits were expected to be paid for by private insurance in 21 percent cases, government-funded insurance in 5 percent of cases, and by workers themselves in 11 percent of cases. This finding is broadly consistent with recent research, which has found a large amount of cost-shifting to non-WC payers. In a study analyzing and National Council on Compensation Insurance data, Leigh and Marcin (2012) estimated that 56 percent of the medical costs resulting from work-related injuries and illnesses in 2007 were shifted to workers and their families, non-WC insurance carriers, and governments. The authors further made the point that the ability of employers to treat occupational injury and illness as an economic externality undermines both prevention efforts (i.e., injuries and illnesses are overproduced) and fairness (i.e., injured or ill workers and innocent third parties absorb the cost).
Because individual workers' eligibility for WC could not be determined using NHAMCS data, we could not distinguish between non-WC visits where either the worker or the condition was not covered and those where WC was not the expected payer for other reasons. While data from the National Academy of Social Insurance suggest that, in 2006, 90 percent of the U.S. workforce was covered by WC (Sengupta, Reno, and Burton 2011), self-employed workers, who are not typically required to have WC insurance, appear to be at higher occupational risk—at least as measured by fatal injuries (Mirabelli, Loomis, and Richardson 2003; US Department of Labor, Bureau of Labor Statistics 2012b)—and could account for a disproportionate share of work-related ED visits. One could argue that, if a worker was not covered by WC, then the cost was not technically shifted. However, whenever the medical costs of work-related injuries and illnesses are not paid for by employers—either directly or indirectly via WC systems—they are liable to be paid by other private or government-funded insurance, and economic incentives for prevention are undermined.
We found that visits for work-related illnesses were significantly more likely than visits for work-related injuries to be non-WC visits. However, we also found significant variation in the proportion of cases where WC was not the expected payer across work-related illness categories. Visits for eye disorders were least likely to be non-WC visits (29 percent), while visits for disorders of the skin were among the most likely (65 percent). This finding is consistent with data from other studies and has been attributed to the challenges for workers and heath care practitioners in recognizing and establishing work-relatedness. This is especially true for common conditions such as dermatitis and musculoskeletal disorders that can be caused or exacerbated by a variety of factors both inside and outside the workplace (Morse et al. 1998; McCall et al. 2005; Bushnell, Li, and Landen 2011).
Visits by blacks to the ED for work-related conditions were significantly more likely to have a non-WC expected payer than visits by whites, even after adjusting for potential differences due to the type of visit. This may reflect differences by racial group in the likelihood of working in a job that provides WC coverage. Compared to whites, blacks are slightly more likely to be employed in contingent or alternative employment arrangements where WC coverage may not be provided (US Department of Labor, Bureau of Labor Statistics 2005; Cummings and Kreiss 2008). Another explanation may be differences by racial groups in levels of job security and fear that reporting a work-related injury might lead to job loss, as has been observed among black poultry workers (Lipscomb et al. 2008). In this study, blacks were significantly more likely than other workers to have their work-related ED costs paid by Medicaid, which suggests that these workers were likely to be self-employed or employed in low-wage and temporary work arrangements, which may also have low job security and lack WC coverage (Strunin and Boden 2004; Cummings and Kreiss 2008; Gaydos et al. 2011).
We did not find that visits by Hispanics were more likely to be non-WC visits than those by non-Hispanics. Given the literature (Du and Leigh 2011; Friedman, Ruestow, and Forst 2012), this ran counter to our prior expectations. Because we analyzed race and ethnicity separately, visits by Hispanics were compared to those by all non-Hispanics, including both whites and blacks, which could have biased the analysis toward the null. However, when we reran the analysis with race/ethnicity included as a single, combined variable (data not shown), visits by Hispanics were still no more likely than those by non-Hispanic whites to be non-WC visits.
Examining potential racial disparities in rates of occupational injuries and illnesses through existing occupational health surveillance systems is challenging because the SOII does not require employers to record the race of injured workers and WC databases generally exclude race and ethnicity (Bonauto et al. 2010). Our finding of the disproportionate degree to which WC was not the expected payer for work-related ED visits among black workers raises concerns that occupational health surveillance systems that rely on WC claims status to determine work-relatedness may underestimate racial disparities in occupational injury and illness (Bonauto et al. 2010; Souza, Steege, and Baron 2010).
We also found that the proportion of non-WC visits varied significantly by region, with visits in the South being most likely to be non-WC visits compared to those in the West, where expected payment by WC was most likely. This could be due to a number of factors, including regional differences in patterns of employment, industry, and occupational risk, as well as in government policies such as labor and occupational safety and health regulations or WC policies. As a region, the South has had levels of occupational risk that were higher than the rest of the country as measured by fatal occupational injuries, especially for black and Hispanic men (Richardson et al. 2004). Southern states also tend to have policy climates that favor business over labor, which have been shown to be associated with increased risk for fatal occupational injury (Loomis et al. 2009). WC programs are administered at the state level and may reflect the broader political economies of the states they serve.
We did not find that clinical severity of work-related visits was associated with expected WC payment status. In this study, we defined severity as those cases having a higher presenting level of pain, requiring more immediate attention, or those cases arriving at the ED by ambulance. Other studies have found that the severity of the condition was one of the most important predictors for whether a patient filed a WC claim (Biddle et al. 1998; Shannon and Lowe 2002). However, in those studies severity was measured differently such as by patient telephone surveys using either a patient-reported 100-point severity scale (Biddle et al. 1998) or by asking those respondents who reported a work-injury whether their injury required medical care, lost-work time, or modified work (Shannon and Lowe 2002). Differences between our findings and those in these other studies may reflect differences due to the types of work-related cases included in the studies as well as differences in how severity was defined.
Although visits to for-profit hospitals accounted for less than 10 percent of all work-related ED visits, they were significantly more likely to be non-WC visits. This could result from differences in the types of patients as well as the nature of the cases seen in for-profit versus other ED facilities.
Finally, we also found that the proportion of non-WC visits increased significantly during the study period, from 32 percent in 2003 to 45 percent in 2006. Because the NHAMCS stopped collecting data on work-relatedness after 2006, we were unable to determine more recent trends. The observed trends could result both from a decrease in workers' eligibility for WC, as well as from changes in workers' willingness to use the WC benefits to which they may have been entitled. The number of claims for WC (as well as the total amount WC medical payments) has been declining (Loomis et al. 2009). So too have the number of work-related injuries and illnesses reported to OSHA. Indeed, during the years of our study, the annual rate of occupational injuries and illness in the United States, as determined by the SOII, showed a similar pattern of decrease—5.0, 4.8, 4.6, and 4.4 cases per 100 full-time equivalent workers for the years 2003–2006, respectively (US Department of Labor, Bureau of Labor Statistics 2012c). However, there is evidence to suggest that the concomitant declines in these indicators are not simply due to a reduction in the incidence of occupational injuries and illnesses. Recent studies suggest that there is substantial undercounting of occupational injuries and illnesses in both WC and OSHA data (Leigh, Marcin, and Miller 2004; Rosenman et al. 2006; Boden and Ozonoff 2008; US Government Accountability Office 2009). It has been well documented that there can be considerable social, economic, and administrative disincentives for workers to file for WC (Biddle et al. 1998; Rosenman et al. 2000; Reville, Bhattacharya, and Sager Weinstein 2001; Azaroff, Levenstein, and Wegman 2002; Shannon and Lowe 2002; Strunin and Boden 2004; Fan et al. 2006), and similar disincentives to reporting have been suggested as reasons why the SOII, which depends on OSHA data, might underestimate national rates of occupational injuries and illnesses (Spieler and Burton 2012). Guo and Burton (2010) found that the proportion of OSHA-recordable injuries that generated WC claims declined between 1985 and 1999 due to increasingly restrictive policies on the part of state agencies and to court decisions. In conjunction with other compensability restrictions, this decline explained more of the decrease in cash benefits paid by WC programs during that period than did the decreases in injury incidence reflected in the SOII. Our findings support the inference that declines in WC claims may be due, at least in part, to a reduction in the proportion of occupational injuries and illnesses that are paid for by WC—not simply due to a decline in the injury and illness rate—and workers face growing barriers to receiving compensation for their work-related injuries and illnesses.
Limitations
There are a number of reasons why the identification of work-related cases by the NHAMCS might not be complete. Injured workers may be reluctant to share details about the work-relatedness of their injury or illness and busy ED clinicians may inadvertently omit details from the patient record that might indicate work-relatedness. Nonetheless, our estimate of the annual number of work-related ED visits was very similar to that determined by a different ED-based surveillance system, the National Electronic Injury Surveillance System-Occupational Supplement (NIESS-Work), which collects data through a nationally representative sample of 67 hospitals. In 2004, NEISS-Work estimated there were 3.4 million work-related injuries and illnesses treated in U.S. EDs, and NHAMCS estimated there were 3.2 million work-related ED visits, including revisits for a previously treated occupational injury or illness (Centers for Disease Control and Prevention 2007).
The types of conditions that are seen in the ED may not be representative of all work-related injuries and illness, as it is estimated that only about a third of all occupational injuries and illnesses requiring medical attention are seen in an ED (Centers for Disease Control and Prevention 2007). Nonetheless, our estimate of WC as expected payer was similar to that found in a state-based survey that asked wage and salary workers about WC payment for all work-related conditions requiring medical attention (Centers for Disease Control and Prevention 2010b).
We also had no information related to the quality of the NHAMCS data for work-relatedness or expected source of payment. An earlier report of work-related injuries from the 1998 NHAMCS found that for 29 percent of the records work-relatedness was not known (McCaig, Burt, and Stussman 1998). However, the NHAMCS standardized patient data abstraction form is periodically updated and while in 1998 the question on work-relatedness was limited to visits classified as injuries, between 2003 and 2006 abstractors were asked to indicate the work-relatedness for all ED visits. During this period the capture rate for work-relatedness rose to 93 percent, with only 3 percent missing and 4 percent marked as “unknown.” The nonresponse rate for the expected source of payment was also low at approximately 5 percent.
While the response rate for these variables was adequate, we had no independent information to validate the quality of the abstracted information or the coding process. For the work-relatedness variable, some misclassification could have occurred because data abstractors sometimes needed to make independent judgments about the work-relatedness based on the patient's description of the incident or events that led to their injury or illness. Also, data on the expected source of payment may be incomplete or may not reflect the actual source of payment if a worker's compensation claim is denied or a worker or insurance company later obtains reimbursement for the ED expenses from WC. Furthermore, because we excluded cases where the expected payer was missing or unknown, our results slightly understate the degree to which work-related visits would be missed by research or surveillance analyzing comparable ED data but relying entirely on expected payment by WC to determine work-relatedness. In those analyses, such cases would be included in the denominator rather than excluded.
Misclassification could also have affected the expected payer variable because of the rules for how it was to be coded by the abstractors. In cases where there were multiple expected payers, abstractors only coded one, using the following hierarchy: Medicaid, Medicare, private insurance, WC, self-pay, no charge, other, unknown. This could have resulted in an underestimation of the proportion of WC visits.
Conclusions
During 2003–2006, a substantial and increasing proportion of work-related emergency department visits in the United States were not expected to be paid by WC. Work-related visits by blacks, in the South, to for-profit hospitals and for work-related illnesses were all more likely not to be paid by WC than those by whites, in the West, to nonproprietary hospitals, and for work-related injuries, respectively. These findings have at least two important policy implications.
First, WC data are useful for occupational health surveillance and research only to the extent that they capture workplace injuries and illnesses. To the extent that there are systematic differences in the characteristics of work-related illnesses and injuries that are paid for by WC and those that are not, the generalization of inferences from surveillance or research based on data from the former to the latter is invalid. Surveillance systems and research that determine work-relatedness on the basis of payment by WC underestimate the occurrence of occupational illness and injury. Information on the work-relatedness—determined independently of expected payer—of all injury and illness encounters should be captured and included in patients' medical records and health care datasets used for surveillance or public health research.
Second, when work-related injuries and illnesses are not paid by WC, the economic burden falls either to the injured workers and their families or to other social or private insurance systems. Shifting the costs of work-related injury and illness away from employers not only makes them willing to tolerate more occupational morbidity and disincentivizes prevention efforts; it raises fairness and equity concerns. This is especially true when the burden falls disproportionately on minorities. Devising a satisfactory solution to this problem will be complex and challenging, but a number of approaches have recently been proposed (Boden 2012; Hilgert 2012; Lippel 2012; Spieler and Burton 2012) and deserve to be considered. Our findings underscore the importance of such considerations.
Acknowledgments
Joint Acknowledgment/Disclosure Statement: This paper was written in the course of both authors' employment by the U.S. Government. No other financial or material support for this project was provided. The findings and conclusions in this report are those of the authors and do not necessarily represent the official position of the Centers for Disease Control and Prevention.
Disclosures: None.
Disclaimers: None.
Supporting Information
Additional supporting information may be found in the online version of this article:
Appendix SA1: Author Matrix.
References
- Azaroff LS, Levenstein C, Wegman DH. “Occupational Injury and Illness Surveillance: Conceptual Filters Explain Underreporting”. American Journal of Public Health. 2002;92(9):1421–9. doi: 10.2105/ajph.92.9.1421. [DOI] [PMC free article] [PubMed] [Google Scholar]
- Biddle J, Roberts K, Rosenman KD, Welch EM. “What Percentage of Workers with Work-Related Illnesses Receive Workers' Compensation Benefits?”. Journal of Occupational and Environmental Medicine. 1998;40(4):325–31. doi: 10.1097/00043764-199804000-00006. [DOI] [PubMed] [Google Scholar]
- Boden LI. “Reexamining Workers' Compensation: A Human Rights Perspective”. American Journal of Industrial Medicine. 2012;55(6):483–6. doi: 10.1002/ajim.22054. [DOI] [PubMed] [Google Scholar]
- Boden LI, Biddle EA, Spieler EA. “Social and Economic Impacts of Workplace Illness and Injury: Current and Future Directions for Research”. American Journal of Industrial Medicine. 2001;40(4):398–402. doi: 10.1002/ajim.10013. [DOI] [PubMed] [Google Scholar]
- Boden LI, Ozonoff A. “Capture-Recapture Estimates of Nonfatal Workplace Injuries and Illnesses”. Annals of Epidemiology. 2008;18(6):500–6. doi: 10.1016/j.annepidem.2007.11.003. [DOI] [PubMed] [Google Scholar]
- Bonauto DK, Smith CK, Adams DA, Fan ZJ, Silverstein BA, Foley MP. “Language Preference and Non-Traumatic Low Back Disorders in Washington State Workers' Compensation”. American Journal of Industrial Medicine. 2010;53(2):204–15. doi: 10.1002/ajim.20740. [DOI] [PubMed] [Google Scholar]
- Bushnell PT, Li J, Landen D. “Group Medical Claims as a Source of Information on Worker Health and Potentially Work-Related Diseases”. Journal of Occupational and Environmental Medicine. 2011;53(12):1430–41. doi: 10.1097/JOM.0b013e3182363bbe. [DOI] [PubMed] [Google Scholar]
- Centers for Disease Control and Prevention. “Nonfatal Occupational Injuries and Illnesses–United States, 2004”. Morbidity and Mortality Weekly Report. 2007;56(16):393–7. [PubMed] [Google Scholar]
- Centers for Disease Control and Prevention. 2009. “2006 NHAMCS Micro-Data File Documentation” [accessed on September 27, 2012, 2009]. Available at http://ftp://ftp.cdc.gov/pub/Health_Statistics/NCHS/Dataset_Documentation/NHAMCS/doc06.pdf.
- Centers for Disease Control and Prevention. 2010a. “Ambulatory Health Care Data: Questionaires, Datasets and Related Documentation” [accessed on September 27, 2012]. Available at http://www.cdc.gov/nchs/ahcd/ahcd_questionnaires.htm.
- Centers for Disease Control and Prevention. “Proportion of Workers Who Were Work-Injured and Payment by Workers' Compensation Systems—10 States, 2007”. Morbidity and Mortality Weekly Report. 2010b;59(29):897–900. [PubMed] [Google Scholar]
- Council of State and Territorial Epidemiologists. Putting Data to Work: Occupational Health Indicators from Thirteen Pilot States for 2000. Atlanta, GA; 2005. [Google Scholar]
- Cummings KJ, Kreiss K. “Contingent Workers and Contingent Health: Risks of a Modern Economy”. Journal of the American Medical Association. 2008;299(4):448–50. doi: 10.1001/jama.299.4.448. [DOI] [PubMed] [Google Scholar]
- Du J, Leigh JP. “Incidence of Workers Compensation Indemnity Claims across Socio-Demographic and Job Characteristics”. American Journal of Industrial Medicine. 2011;54(10):758–70. doi: 10.1002/ajim.20985. [DOI] [PubMed] [Google Scholar]
- Fan ZJ, Bonauto DK, Foley MP, Silverstein BA. “Underreporting of Work-Related Injury or Illness to Workers' Compensation: Individual and Industry Factors”. Journal of Occupational and Environmental Medicine. 2006;48(9):914–22. doi: 10.1097/01.jom.0000226253.54138.1e. [DOI] [PubMed] [Google Scholar]
- Friedman LS, Ruestow P, Forst L. “Analysis of Ethnic Disparities in Workers' Compensation Claims Using Data Linkage”. Journal of Occupational and Environmental Medicine. 2012;54(10):1246–52. doi: 10.1097/JOM.0b013e31825a34d1. [DOI] [PubMed] [Google Scholar]
- Gaydos M, Hoover C, Lynch J, Weintraub J, Bhatia R. A Health Impact Assessment of AB 889, the California Domestic Work Employee Equality, Fairness, and Dignity Act of 2011. San Francisco, CA: San Francisco Department of Public Health, Program on Health, Equity, and Sustainability; 2011. [Google Scholar]
- Guo XS, Burton JF., Jr “Workers Compensation: Recent Developments in Moral Hazard and Benefits Payments”. Industrial Labor Relations Review. 2010;63(2):340–54. [Google Scholar]
- Hilgert JA. “Building a Human Rights Framework for Workers' Compensation in the United States: Opening the Debate on First Principles”. American Journal of Industrial Medicine. 2012;55(6):506–18. doi: 10.1002/ajim.22023. [DOI] [PubMed] [Google Scholar]
- Leigh JP. “Economic Burden of Occupational Injury and Illness in the United States”. Milbank Quarterly. 2011;89(4):728–72. doi: 10.1111/j.1468-0009.2011.00648.x. [DOI] [PMC free article] [PubMed] [Google Scholar]
- Leigh JP, Marcin JP. “Workers' Compensation Benefits and Shifting Costs for Occupational Injury and Illness”. Journal of Occupational and Environmental Medicine. 2012;54(4):445–50. doi: 10.1097/JOM.0b013e3182451e54. [DOI] [PubMed] [Google Scholar]
- Leigh JP, Marcin JP, Miller TR. “An Estimate of the U.S. Government's Undercount of Nonfatal Occupational Injuries”. Journal of Occupational and Environmental Medicine. 2004;46(1):10–8. doi: 10.1097/01.jom.0000105909.66435.53. [DOI] [PubMed] [Google Scholar]
- Lippel K. “Preserving Workers' Dignity in Workers' Compensation Systems: An International Perspective”. American Journal of Industrial Medicine. 2012;55(6):519–36. doi: 10.1002/ajim.22022. [DOI] [PubMed] [Google Scholar]
- Lipscomb H, Kucera K, Epling C, Dement J. “Upper Extremity Musculoskeletal Symptoms and Disorders among a Cohort of Women Employed in Poultry Processing”. American Journal of Industrial Medicine. 2008;51(1):24–36. doi: 10.1002/ajim.20527. [DOI] [PubMed] [Google Scholar]
- Loomis D, Schulman MD, Bailer AJ, Stainback K, Wheeler M, Richardson DB, Marshall SW. “Political Economy of US States and Rates of Fatal Occupational Injury”. American Journal of Public Health. 2009;99(8):1400–8. doi: 10.2105/AJPH.2007.131409. [DOI] [PMC free article] [PubMed] [Google Scholar]
- McCaig LF, Burt CW, Stussman BJ. “A Comparison of Work-Related Injury Visits and Other Injury Visits to Emergency Departments in the United States, 1995–1996”. Journal of Occupational and Environmental Medicine. 1998;40(10):870–5. doi: 10.1097/00043764-199810000-00006. [DOI] [PubMed] [Google Scholar]
- McCall BP, Horwitz IB, Feldman SR, Balkrishnan R. “Incidence Rates, Costs, Severity, and Work-Related Factors of Occupational Dermatitis: A Workers' Compensation Analysis of Oregon, 1990–1997”. Archives of Dermatology. 2005;141(6):713–8. doi: 10.1001/archderm.141.6.713. [DOI] [PubMed] [Google Scholar]
- Mirabelli MC, Loomis D, Richardson DB. “Fatal Occupational Injuries among Self-Employed Workers in North Carolina”. American Journal of Industrial Medicine. 2003;44(2):182–90. doi: 10.1002/ajim.10244. [DOI] [PMC free article] [PubMed] [Google Scholar]
- Morse TF, Dillon C, Warren N, Levenstein C, Warren A. “The Economic and Social Consequences of Work-Related Musculoskeletal Disorders: The Connecticut Upper-Extremity Surveillance Project (CUSP)”. International Journal of Occupational and Environmental Health. 1998;4(4):209–16. doi: 10.1179/oeh.1998.4.4.209. [DOI] [PubMed] [Google Scholar]
- Reville RT, Bhattacharya J, Sager Weinstein LR. “New Methods and Data Sources for Measuring Economic Consequences of Workplace Injuries”. American Journal of Industrial Medicine. 2001;40(4):452–63. doi: 10.1002/ajim.1115. [DOI] [PubMed] [Google Scholar]
- Richardson DB, Loomis D, Bena J, Bailer AJ. “Fatal Occupational Injury Rates in Southern and Non-Southern States, by Race and Hispanic Ethnicity”. American Journal of Public Health. 2004;94(10):1756–61. doi: 10.2105/ajph.94.10.1756. [DOI] [PMC free article] [PubMed] [Google Scholar]
- Rosenman KD, Gardiner JC, Wang J, Biddle J, Hogan A, Reilly MJ, Roberts K, Welch E. “Why Most Workers with Occupational Repetitive Trauma do not file for Workers' Compensation”. Journal of Occupational and Environmental Medicine. 2000;42(1):25–34. doi: 10.1097/00043764-200001000-00008. [DOI] [PubMed] [Google Scholar]
- Rosenman KD, Kalush A, Reilly MJ, Gardiner JC, Reeves M, Luo Z. “How Much Work-Related Injury and Illness Is Missed by the Current National Surveillance System?”. Journal of Occupational and Environmental Medicine. 2006;48(4):357–65. doi: 10.1097/01.jom.0000205864.81970.63. [DOI] [PubMed] [Google Scholar]
- Sengupta I, Reno V, Burton JF., Jr . Workers' Compensation: Benefits, Coverage and Costs, 2009. Washington, DC: National Academy of Social Insurance; 2011. [Google Scholar]
- Shannon HS, Lowe GS. “How Many Injured Workers Do Not File Claims for Workers' Compensation Benefits?”. American Journal of Industrial Medicine. 2002;42(6):467–73. doi: 10.1002/ajim.10142. [DOI] [PubMed] [Google Scholar]
- Souza K, Steege AL, Baron SL. “Surveillance of Occupational Health Disparities: Challenges and Opportunities”. American Journal of Industrial Medicine. 2010;53(2):84–94. doi: 10.1002/ajim.20777. [DOI] [PubMed] [Google Scholar]
- Spieler EA, Burton JF., Jr “The Lack of Correspondence between Work-Related Disability and Receipt of Workers' Compensation Benefits”. American Journal of Industrial Medicine. 2012;55(6):487–505. doi: 10.1002/ajim.21034. [DOI] [PubMed] [Google Scholar]
- Strunin L, Boden LI. “The Workers' Compensation System: Worker Friend or Foe?”. American Journal of Industrial Medicine. 2004;45(4):338–45. doi: 10.1002/ajim.10356. [DOI] [PubMed] [Google Scholar]
- Thomsen C, McClain J, Rosenman K, Davis L, Centers for Disease and Prevention “Indicators for Occupational Health Surveillance”. MMWR Recommendations and Reports. 2007;56(RR-1):1–7. [PubMed] [Google Scholar]
- US Department of Labor, Bureau of Labor Statistics. 2005. “Contingent and Alternative Employment Arrangements, February 2005” [accessed on September 27, 2012]. Available at http://www.bls.gov/news.release/conemp.nr0.htm.
- US Department of Labor, Bureau of Labor Statistics. 2010. “Numbers of Nonfatal Occupational Injuries and Illnesses by Case Type and Ownership, Selected Industries, 2009” [accessed on September 27, 2012]. Available at http://www.bls.gov/iif/oshwc/osh/os/ostb2437.txt.
- US Department of Labor, Bureau of Labor Statistics. “Chapter 9–Occupational Safety and Health Statistics”. Washington, DC: US Department of Labor; 2012a. BLS Handbook of Methods. [Google Scholar]
- US Department of Labor, Bureau of Labor Statistics. 2012b. “Fatal Occupational Injuries, Total Hours Worked, and Rates of Fatal Occupational Injuries by Selected Worker Characteristics, Occupations and Industries, Civilian Workers, 2010” [accessed on September 27, 2012]. Available at http://www.bls.gov/iif/oshwc/cfoi/cfoi_rates_2010hb.pdf.
- US Department of Labor, Bureau of Labor Statistics. 2012c. “Injuries, Illnesses, and Fatalities” [accessed on September 27, 2012]. Available at http://www.bls.gov/iif/home.htm.
- US Government Accountability Office. Workplace Safety and Health: Enhancing OSHA's Records Audit Process Could Improve the Accuracy of Worker Injury and Illness Data. Washington, DC: GAO; 2009. [Google Scholar]
- Utterback DF, Schnorr TM, Silverstein BA, Spieler EA, Leamon TB, Amick BC., 3rd “Occupational Health and Safety Surveillance and Research Using Workers' Compensation Data”. Journal of Occupational and Environmental Medicine. 2012;54(2):171–6. doi: 10.1097/JOM.0b013e31823c14cb. [DOI] [PubMed] [Google Scholar]
Associated Data
This section collects any data citations, data availability statements, or supplementary materials included in this article.