

Abstract
The formylpeptide receptor (FPR1) and formylpeptide-like 1 receptor (FPR2) are G protein–coupled receptors that are linked to acute inflammatory responses, malignant glioma stem cell metastasis, and chronic inflammation. Although several N-formyl peptides are known to bind to these receptors, more selective small-molecule, high-affinity ligands are needed for a better understanding of the physiologic roles played by these receptors. High-throughput assays using mixture-based combinatorial libraries represent a unique, highly efficient approach for rapid data acquisition and ligand identification. We report the superiority of this approach in the context of the simultaneous screening of a diverse set of mixture-based small-molecule libraries. We used a single cross-reactive peptide ligand for a duplex flow cytometric screen of FPR1 and FPR2 in color-coded cell lines. Screening 37 different mixture-based combinatorial libraries totaling more than five million small molecules (contained in 5,261 mixture samples) resulted in seven libraries that significantly inhibited activity at the receptors. Using positional scanning deconvolution, selective high-affinity (low nM Ki) individual compounds were identified from two separate libraries, namely, pyrrolidine bis-diketopiperazine and polyphenyl urea. The most active individual compounds were characterized for their functional activities as agonists or antagonists with the most potent FPR1 agonist and FPR2 antagonist identified to date with an EC50 of 131 nM (4 nM Ki) and an IC50 of 81 nM (1 nM Ki), respectively, in intracellular Ca2+ response determinations. Comparative analyses of other previous screening approaches clearly illustrate the efficiency of identifying receptor selective, individual compounds from mixture-based combinatorial libraries.
Introduction
The search for novel ligands with high affinities to newly identified and poorly understood receptors remains one of the fundamental aims of biomedical research. Further understanding a receptor’s structure, function, and biologic relevance in certain diseases and disorders can be accelerated with the identification of high-affinity ligands. Synthetic combinatorial methods have been in use for the last 20 years and have fundamentally advanced the ability to synthesize and screen large numbers of compounds. One of the earliest methods described, mixture-based libraries combined with positional scanning deconvolution, is the approach that enables the most rapid and economically efficient acquisition of chemical and biologic information (Pinilla et al., 1992; Dooley and Houghten, 1993; Houghten et al., 1999, 2008). Recently, mathematical modeling (Santos et al., 2011) has developed a theoretical foundation for the continued success of mixture-based combinatorial libraries; the harmonic mean model, combined with the multiple structural analogs present in mixture-based combinatorial libraries, explains how mixtures with only a fraction of a percentage of active compounds may still be differentiated in an assay of typical resolution. Additionally, it has been demonstrated that the activity of positional scanning mixtures is robust with respect to the approximate equimolarity of their constituent compounds (Giulianotti et al., 2012).
The ability to identify specific functionalities responsible for driving the activity at each variable position of a chemical scaffold or pharmacophore is one of the strengths of mixture-based libraries. Another advantage of mixture-based libraries resides in the very high densities of compounds that can be synthesized in specific regions of chemical space (Medina-Franco et al., 2008, 2009) to identify quickly the activity cliffs, defined as chemical compounds with high structural similarity but unexpectedly different biologic activity (Maggiora 2006; Medina-Franco et al., 2009). Additionally, these libraries expand the traditional relevant medicinal chemistry space typically covered by current commercial screening collections as well as the Molecular Library Small Molecule Repository (MLSMR) (Singh et al., 2009; Lopez-Vallejo et al., 2012). Compared with existing high-throughput screening (HTS) programs, in which hundreds of thousands of individual compounds are screened against therapeutically important targets, millions of compounds formatted as mixtures can be examined using substantially less material and at much reduced time and labor than if these same mixture-based diversities were made and screened as individual compounds (Houghten et al., 1999, 2008; Pinilla et al., 2003).
Formylpeptide receptors (FPRs) are a small family of G protein–coupled receptors known to be important in host defense and inflammation, and studies have been carried out to identify small-molecule ligands to characterize the structure and function of these receptors (Ye et al., 2009; Kirpotina et al., 2010). The two receptors of the FPR family that are studied here are formylpeptide receptor (FPR1), which is linked to antibacterial inflammation (Le et al., 2002) and malignant glioma cell metastasis (Zhou et al., 2005), and formylpeptide-like 1 receptor 1 (FPR2; formerly known as FPRL-1), which is linked to chronic inflammation in systemic amyloidosis, Alzheimer disease, and prion diseases (Le et al., 2001). These two receptors were originally shown to be expressed primarily in myeloid cells, with varying distribution among myeloid cell subsets and a wide range of tissues (Riviere et al., 2009; Ye et al., 2009). There have been numerous studies to identify naturally occurring and more potent small molecule agonists or antagonists for each of these receptors; these studies are reviewed in (Ye et al., 2009; Dufton and Perretti, 2010).
We previously reported the use of a fluorescent ligand competition assay combined with high-throughput flow cytometry to identify a series of novel small-molecule ligands for FPR1 and FPR2 (Edwards et al., 2005; Young et al., 2005, 2009). The most potent ligands identified were 3570-0208 and BB-V-115, with ligand binding inhibition constants (Ki) of 95 and 270 nM for FPR1 and FPR2, respectively. Each was a selective antagonist of the intracellular Ca2+ response mediated by its target receptor, with an IC50 value of 430 nM for FPR1 (3570-0208) and 940 nM for FPR2 (BB-V-115). Herein, we report the screening and deconvolution of a collection of Torrey Pines Institute for Molecular Studies (TPIMS) libraries using an HTS flow cytometry duplex receptor assay to identify novel FPR ligands. The same flow cytometric technology used for HTS is compatible for the quantitative analysis of ligand affinity. Using positional scanning deconvolution methods, FPR1 and FPR2 selective ligands with nanomolar affinities were identified from mixtures containing from thousands to tens of thousands of compounds. Importantly, this was accomplished by screening more than five million compounds within only 5,261 samples, an extremely efficient and cost-effective process compared with traditional HTS approaches that typically evaluate hundreds of thousands of individual compounds. Herein, we report the most potent FPR1 agonist and FPR2 antagonist identified to date. The newly identified compounds are structurally distinct from all currently described FPR ligands, illustrating the ability of the TPIMS libraries to explore novel regions of chemical space and to identify selective, high-affinity compounds.
Materials and Methods
Preparation of Mixture-Based Libraries and Individual Compounds.
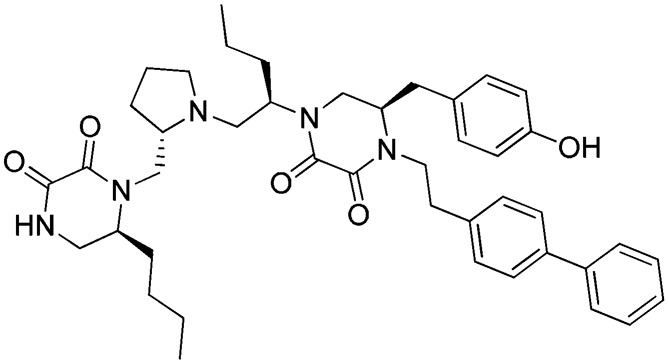
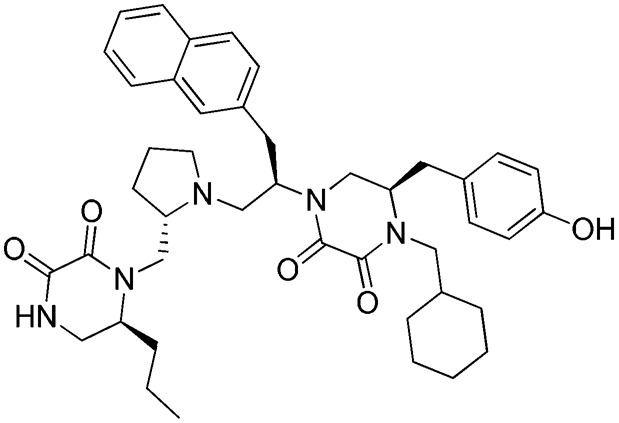
Using solid-phase chemistry approaches, mixture-based libraries were synthesized from resin-bound amino acids, peptides, and peptidomimetics as starting materials using the simultaneous multiple synthesis and “libraries from libraries” approaches, as previously described (Houghten, 1985; Houghten et al., 1991, 1999; Ostresh et al., 1994a; Nefzi et al., 2004). Extensive optimization of each reaction condition was necessary for mixture library generation. The isokinetic ratios necessary for equimolar incorporation of amino acids (Ostresh et al., 1994b) and carboxylic acids (Acharya et al., 2002), as well as other reagents, have been previously determined. Synthetic controls are prepared systematically to determine a wide range of building blocks to be incorporated into varied reactive positions of a given central scaffold molecule. Supplemental Table 1 contains information on 37 small-molecule libraries screened against FPR1 and FPR2. Three peptide libraries (totaling 26 million compounds; libraries 6, 7, and 33 in Supplemental Table 1) were screened but were excluded in the deconvolution or analysis of the screening efficiency (Table 1). In most cases, libraries were dissolved in dimethylformamide at 10 mg/ml and diluted in water for final testing concentrations. The synthesis of library 1344 (including 1343, 1345, 1346, and 1347) has been previously described (Reilley et al., 2010). In brief, library 1344 was synthesized using the “libraries from libraries” approach (Ostresh et al., 1994a; Nefzi et al., 2004) starting with resin-bound N-acylated peptides (Hensler et al., 2006), which were subsequently exhaustively reduced with borane-tetrahydrofuran. No loss of chirality was found in either the reduction or subsequent steps. The resin-bound polyamine was then treated with oxyalyldiimidazole to form the resin-bound pyrrolidine bis-diketopiperazine before cleavage from the resin. The library was synthesized in a positional scanning format with four positions of diversity (Supplemental Table 2). Each separate sublibrary (R1–R4) was synthesized representing the same diversity and differing solely by the location of the defined position, allowing for library screening and deconvolution essentially as described (Pinilla et al., 1992, 2003). The synthesis of library 1481 has been described elsewhere (Nefzi et al., 2000; Schimmer et al., 2004). In brief, library 1481 was synthesized starting with resin-bound N-acylated dipeptides that were exhaustively reduced with borane-tetrahydrofuran, followed by treatment with phenylisocynate to afford the resin-bound polyphenyl ureas, which were subsequently removed from the solid support. Library 1481 was synthesized in a positional scanning format with three positions of diversity. The R1 and R2 positions were prepared with the same 48 functionalities, and R3 was prepared with 39 functionalities (48 × 48 × 39 = 89,856; see Supplemental Table 2). Each separate sublibrary (R1–R3) was synthesized representing the same diversity and differing solely by the location of the defined position, allowing for library screening and deconvolution essentially as described (Pinilla et al., 1992, 2003). Individual compounds derived from libraries 1344 and 1481 were synthesized by the same solid-phase methods used for the libraries and analyzed by liquid chromatography-mass spectrometry (LC-MS) to confirm identity and purity. The individual compounds shown in Table 2 were all purified by reverse-phase high-performance liquid chromatography and had a final purity of >99% as determined by integration of the absorbance at 254 nm. (The LC-MS data for these compounds can be found in Supplemental Fig. 1 and Supplemental Table 3). Additional analytical information based on LC-MS for all 106 TPI compounds can be found in Supplemental Datasets 1 and 2. It should be noted that for the compounds that contain a phenyl group in the R3 position (such as Table 2 compound a: 1754-113 [1-((S)-1-((S)-2-(((S)-6-benzyl-2,3-dioxopiperazin-1-yl)methyl)pyrrolidin-1-yl)-3-phenylpropan-2-yl)-4-phenethyl-5-phenylpiperazine-2,3-dione]), the final product is close to 50:50 racemic mixture of the S,R-phenyl.
TABLE 1.
Comparison of FPR1 and FPR2 ligands identified by four different screening programs
| Library | No. of Samples Tested | No. of Compounds Evaluated | FPR1 |
FPR2 | Reference | ||||||
|---|---|---|---|---|---|---|---|---|---|---|---|
| No. of Compounds Ki < 1 µM | Best |
No. of Compounds Ki < 1 µM | Best |
||||||||
| ID | Ki | Selectivity | ID | Ki | Selectivity | ||||||
| nM | nM | ||||||||||
| PCLa | 880 | 880 | 0 | Sulfinpyrazone | 14,000 | ND | ND | ND | ND | ND | Young et al.,2005 |
| Focusedb | 4,324 | 4,324 | 1 | 1910-5441 | 1,000 | ND | ND | ND | ND | ND | Edwards et al., 2005 |
| MLSMRc | 24,304 | 24,304 | 7 | 3570-0208 | 95 | >187 | 1 | BB-V-115 | 270 | >20 | Young et al., 2009 |
| TPIMSd | 5,261 | 5 million | Herein | ||||||||
| 1754 | 106 | 106 | 55 | 1754-113 | 3 | >3333 | 38 | 1754-31 | 1 | >10,000 | |
| 1753 | 8 | 8 | 7 | 1753-101 | 1 | >10,000 | 0 | ||||
ND, not determined; PCL, Prestwick Chemical Library; TPIMS, Torrey Pines Institute for Molecular Studies.
PCL is a commercial collection of 880 off-patent drugs and alkaloids.
FPR-focused, small-molecule library based on a computational screen.
The National Institutes of Health MLSMR is a small-molecule diversity library.
TPIMS small-molecule mixture based combinatorial libraries. 1754 and 1753 are two sets of individual compounds derived from the deconvolution of selected mixture based libraries.
TABLE 2.
Examples of active compounds for FPR1 and FPR2
| FPR1 |
FPR2 |
|||||
|---|---|---|---|---|---|---|
| Compound No. |
Binding Ki |
Agonist EC50 |
Antagonist IC50 |
Binding Ki |
Agonist EC50 |
Antagonist IC50 |
| nM | ||||||
| Pyrrolidine bis-diketopiperazine scaffold | ||||||
 a: 1754-113
 |
3 | a | 1,070 | b | a | c |
 b: 1754-56
 |
2 | a | 139 | 1,320 | 1,300 | NA |
 c: 1754-26 c: 1754-26 |
46 | a | 2,680 | 70 | a | 3,480 |
 d: 1754-20
 |
b | a | c | 15 | a | 452 |
 e: 1754-19
 |
3,370 | a | c | 6 | a | 1,410 |
 f: 1754-31
 |
b | a | c | 1 | a | 81 |
 g: 1754-49
 |
2,320 | a | c | 33 | 144 | NA |
| Polyphenylurea scaffold | ||||||
 h: 1753-103
 |
4 | 131 | NA | b | a | c |
NA, not applicable.
No agonistic activity at up to 12 µM.
Ki greater than 10,000 nM.
No antagonistic activity at up to 10 µM.
Flow Cytometry Receptor Binding Assay.
The assay was performed in a ‘‘duplex’’ format in which U937/FPR1 cells were tested together with rat basophil leukemia/FPR2 cells, as previously described (Young et al., 2009) (PubChem Summary AIDs 805 and 1202). The FPR1-expressing cells were stained with a red fluorescent dye, with FuraRed allowing them to be distinguished from the FPR2-expressing cells during flow cytometric analysis. A fluorescein label was conjugated to the lysine residue of the WPep peptide (WKYMVm) to produce a fluorescent ligand [WPep–fluorescein isothiocyanate (FITC)] that bound both FPR1 and FPR2. The Kd values for the binding of WPep- FITC to FPR1 and FPR2 were determined to be 1.2 and 1.8 nM, respectively. Assays were performed in polystyrene 384-well plates with small-volume wells (Greiner #784101; VWR, Radnor, PA). Additions to wells were in sequence as follows: 1) test compounds and control reagents (5 μl/well); 2) the combined suspension of U937/FPR1 cells and rat basophil leukemia/FPR2 cells (5 μl/well); and 3) (after 30 minutes, 4°C incubation) WPep-FITC (5 μl/well). After an additional 45 minutes, 4°C incubation, plates were immediately analyzed using flow cytometry. The assay response range was defined by replicate control wells containing unlabeled receptor-blocking peptide (positive control) or buffer (negative control). fMLFF (formyl-MLFF) was used as the FPR1-blocking peptide and unlabeled WPep as the FPR2-blocking peptide. The final concentration of WPep-FITC was 5 nM. The assay was homogeneous in that cells, compounds, and fluorescent peptide were added in sequence, and the wells were subsequently analyzed without intervening wash steps. The HyperCyt high-throughput flow cytometry platform (Kuckuck et al., 2001; Ramirez et al., 2003) was used to sample cells sequentially from wells of 384-well microplates (2 μl/sample) for presentation to a CyAn flow cytometer (Beckman-Coulter, Brea, CA) at a rate of 40 samples per minute. Fluorescence was excited at 488 nm and detected with 530/40 and 680/30 optical bandpass filters for WPep-FITC and FuraRed, respectively. Test compound inhibition of fluorescent peptide binding was calculated as percent inhibition. WPep-FITC fluorescence intensity measurements of cells from control wells were also used to calculate Z′ factors (Zhang et al., 1999), which ranged between 0.6 and 0.8 for each assay.
Intracellular Calcium Mobilization Assays.
Intracellular calcium mobilization assays were performed as previously described with modifications (Edwards et al., 2005). Briefly, cells were collected by centrifugation (200g, 10 minutes, 24°C) and suspended at 106/ml in 1 ml of phosphate-buffered saline (Ca2+, Mg2+ free). Cells were added with 210 nM Fluo4 (FPR2 cells) or with a combination of 210 nM Fluo4 and 210 nM FuraRed (FPR1 cells) (both from Life Technologies, Eugene, OR). After incubation for 30 minutes at 24°C, cells were washed with 1 ml of phosphate-buffered saline, suspended in 1 ml of TCM (RPMI, 10% FBS), and stored in the dark at 24°C until used in assays. For test compound agonist determinations, 50 µl from FPR1 and FPR2 cell suspensions were combined, analyzed 10 seconds in an Accuri C6 flow cytometer (BD Biosciences, San Jose, CA) to determine baseline Fluo4 fluorescence in the FL1 channel (530/20 nm), and then added with 50 µl containing test compounds and analyzed an additional 110 seconds to evaluate changes in Fluo4 fluorescence intensity. During the analysis, FPR1 cells were distinguished from FPR2 cells on the basis of FuraRed fluorescence intensity detected in the FL3 channel (>610 nM). The innate calcium response was quantified as the maximum percentage of cells that exceeded the baseline Fluo4 fluorescence intensity over the course of the analysis. These responses were normalized to the innate calcium responses observed in the presence of 11 nM control peptides: 4Pep for FPR1 cells and WPep for FPR2 cells as follows: normalized calcium response (%) = 100 × innate response % to test compound/innate response percentage to control peptide.
For test compound antagonist determinations, 10 µl of test compound was added to the combined FPR1/FPR2 cell mixture and incubated 5 minutes at 24°C before assessing the innate calcium response to subsequent addition of fMLFF or WPep peptide. In these determinations, fMLFF and WPep were used at concentrations that produced 90% of the maximal intracellular calcium response, and responses were normalized with respect to the innate response to each control peptide observed in the absence of test compounds.
Dose-Response Determinations.
Fluorescent ligand competition dose-response assays were performed essentially as described for single concentration assays except that test compounds were initially tested at a starting concentration of 10 mM in dimethylsulfoxide and serially diluted 1:3 to produce final concentration ranging from 67 μM to 0.1 nM. The resulting ligand competition curves were fitted by Prism software (GraphPad Software, Inc., San Diego, CA) using nonlinear least-squares regression in sigmoidal dose-response model with variable slope, also known as the four-parameter logistic equation. Two parameters, the top and bottom of the fitted curves, were fixed at 100 and 0, the expected upper and lower boundaries of normalized data. Curve-fit statistics were used to determine the concentration of added test compound competitor that inhibited fluorescent ligand binding by 50% (i.e., the IC50).
The FPR expression ranged from 100,000 to 200,000 receptors per cell in different assays as determined by comparison with standard curves generated with Fluorescein Reference Standard microbeads (Bangs Laboratories, Fishers, IN). This corresponds to total FPR concentration of 0.6 to 1.2 nM. To account for the effects of possible ligand depletion at the higher receptor concentrations, Ki values were calculated from IC50 estimates by the method of Munson and Rodbard (1988): Ki = Kd × [y0/(y0 + 2] + IC50/{1 + [p* × (y0 + 2)]/[2 × Kd × (y0 + 1)] + y0}, in which y0 is the initial bound-to-free concentration ratio for the fluorescent ligand, p* is the added concentration of fluorescent ligand, and Kd is the dissociation constant for the fluorescent ligand.
Intracellular Ca2+ dose-response curves were also fitted using nonlinear least-squares regression in a sigmoidal dose response model with variable slope. Curve-fit statistics were used to determine the concentration of added test compound competitor that inhibited Ca2+ responses by 50% (IC50) for antagonists or effected increases in Ca2+ response by 50% (EC50) for agonists. Since responses were normalized relative to control stimuli, the top and bottom of the fitted curves were fixed at 100 and 0.
Results
In the search for novel FPR ligands, we have used four distinctive screening programs (Table 1). For two of these programs, we also evaluated FPR1 and FPR2 ligand binding activity in parallel. All four studies used competitive displacement of a fluorescent ligand as the primary screening method, but each differed with respect to the composition of the compound library and conceptual design of the screening program. The earliest (Young et al., 2005) was a screen of a commercial collection of 880 off-patent drugs and alkaloids, the Prestwick Chemical Library, in which we confirmed the previously reported FPR1 binding activity of sulfinpyrazone (Levesque et al., 1991) but failed to detect novel ligands of greater potency (Table 1: Prestwick Chemical Library). The next involved the screening of a focused library containing 4,234 small-molecule compounds. The library was constructed on the basis of a preliminary computational screen of 480,000 compounds from the commercial ChemDiv collection using an FPR homology model and pharmacophore (Edwards et al., 2005). From several chemically distinct families of FPR1 ligands identified, the most potent was an antagonist with a Ki of 1 µM (Table 1: Focused). In the third approach, we screened a subset of the National Institutes of Health MLSMR, a small-molecule diversity library of 24,304 compounds (Young et al., 2009). Computational structure-activity relationship (SAR) analysis of active compounds from the first round of screening resulted in the commercial procurement and testing of an additional 1,446 small molecules. Seven FPR1 ligands and 1 FPR2 ligand with submicromolar potency were identified, and all were antagonists (Table 1: MLSMR). In each of these first three screening approaches, the physical screening component involved analysis of one test compound per well.
The fourth screening approach is presented here and involved the screening of a collection of mixture-based combinatorial libraries, of which more than five million are classic small-molecule compounds (Table 1: TPIMS Library). This collection is made up of 5,261 mixtures ranging from 48 to 216,000 compounds per mixture. Based on the screening results for FPR1 and FPR2 described as follows, two different libraries were selected for deconvolution to identify individual compounds. From one library, 106 individual compounds (Table 1: 1754) were synthesized and evaluated, of which 56 compounds had Ki values ≤1 µM for FPR1 and 38 had Ki values ≤1 µM for FPR2. Additionally, from the deconvolution of a second library, eight individual compounds (Table 1: 1753) were evaluated, of which seven had Ki values ≤1 µM in FPR1.
As is evident from the results elucidated in Table 1, the set of active compounds (Ki < 1 μM) generated from the mixture-based combinatorial libraries contains compounds that are more active and more selective toward each target than those sets previously obtained from any of the other screening methods performed. In addition to the superiority of these results, positional scanning of combinatorial libraries offers additional advantages to the alternative screening methods attempted. The first is efficiency, as assessed solely by the number of samples tested; given a hit rate in MLSMR of 8/24,304, the probability of randomly testing only 5,375 samples (5,261 mixtures + 114 individual compounds; Table 1) and having at least 100 total positive hits is essentially zero (P ≤ 4.2 ×10−133). Another way to assess screening efficiency is the number of active compounds identified relative to the total number of samples initially tested. In our previous screen of the MLSMR collection, we evaluated 24,304 samples to identify seven hit compounds for FPR1 and 1 for FPR2 (Table 1), hit frequencies of ∼0.03% and ∼0.004%, respectively. In the present study, 5,261 samples were initially screened to obtain hit frequencies of 1.1% for FPR1 and 0.6% for FPR2. In comparison with the MLSMR screen, this represented a 37- and 150-fold increase in hit identification efficiency, respectively.
Primary Screening of Mixtures.
The TPIMS collection of mixture based combinatorial libraries containing 37 different small-molecule scaffolds were formatted on 19 separate 384-well plates (one mixture sample per well) and screened in the duplex flow cytometry assay for inhibition of the FITC-labeled WPep peptide binding to FPR1 and FPR2 receptors. The results of the screen in both receptors are shown in Fig. 1. Each of the 37 libraries is numbered and grouped by color, and the inhibitory activity for each of the 5,261 mixtures is shown. Supplemental Table 1 contains detailed information for the 37 mixture-based libraries. This includes the library synthesis number, the number of mixture samples tested, the number of compounds per mixture, the total number of compounds in each library, the library name, and its chemical structure. A number of libraries showed inhibitory activity for both receptors. Library 21 was one of the most active libraries for both receptors, whereas library 36 was the most active in FPR1 alone. These two libraries were selected for further testing and deconvolution. It is worth noting that other libraries showed modest activity that could also be pursued. Thus, even in the duplex primary screen, a range of pharmacological possibilities was revealed.
Fig. 1.

Activity profiles for FPR1 and FPR2 screened against 37 different mixture-based small-molecule libraries. Each library screened is numbered (see Supplemental Table 1 for library details) and color-coded, and each bar represents the activity (percentage of inhibition of labeled ligand binding to receptor) for a given mixture within each library.
Library 21 is a positional scanning library with four positions of diversity. It is a pyrrolidine bis-diketopiperazine scaffold (library 1344 in Supplemental Table 1). The mixtures for R1 (1–26), R2 (27–52), and R3 (53–78) were each defined with one of 26 functionalities, and each mixture was composed of 28,392 compounds (26 × 26 × 42 = 28,392). The mixtures for R4 (79–120) were each defined with one of 42 functionalities, and each mixture was composed of 17,576 compounds (26 × 26 × 26 = 17,576). The building blocks and the resulting functionalities of each of the mixtures are shown in Supplemental Table 2. Each of the 120 mixtures for this library was retested in a series of confirmatory screens for their inhibitory binding activity of FPR1 and FPR2 receptors. The average and standard error of the mean of different screens (n = 4–7) for each mixture in each diversity position are shown in Supplemental Fig. 2.
Positional Scanning Deconvolution.
Identification of the individual compounds responsible for library 21 activity was carried out using positional scanning deconvolution {Pinilla, 1992 2723/id; Dooley, 1993 2666/id; Houghten, 1999 10071/id; Houghten, 2008 16970/id}, in which the functionalities in each of the defined positions of the most active mixtures within each library were selected to design a set of individual compounds. The most active mixtures for each of the receptors were tested in a dose-response manner, and this information was taken into consideration in the selection of the functionalities from each position. The most differential inhibitory activity was seen in R1, R2, and R3. Some of the most active mixtures (>40% inhibition) for one receptor were among the least active for the other receptor. In R4, the overall inhibitory activity was lower, and little difference was seen between receptors. The selection of functionalities for the synthesis of individual compounds was based solely on activity and not selectivity. The functionalities and the corresponding mixture number (Supplemental Fig. 2; Supplemental Table 2) used for the synthesis of individual compounds for FPR1 included the following: S-benzyl (#2), S-propyl (#19), and S-butyl (#21) in R1; S-benzyl (#28), S-isobutyl (#31), S-hydroxymethyl (#40), R-propyl (#46), and R-butyl (#48) in R2; S-2-butyl (#56), R-4-hydroxybenzyl (#69), S-phenyl (#70), and S-cyclohexyl (#77) in R3; and cyclohexyl-methyl (#107), 4-methyl-1-cyclohexyl-methyl (#115), and 2-biphenyl-4-yl ethyl (#117) in R4. For the individual compounds for FPR2, the functionalities were S-isopropyl (#8), S-propyl (#19), and R-2-naphthylmethyl (#24) in R1; R-4-hydroxybenzyl (#43), R-propyl (#46), R-2-naphthylmethyl (#50), and R-cyclohexyl (#52) in R2; R-benzyl (#63), R-4-hydroxybenzyl (#69), R-propyl (#72), and R-butyl (#74) in R3; and cyclohexyl-methyl (#107), 4-methyl-1-cyclohexyl-methyl (#115), and 2-biphenyl-4-yl ethyl (#117) in R4. A total of 106 compounds (Table 1: 1754) were synthesized and tested at both receptors.
Figure 2 shows a scatter plot of the activity of individual compounds for both receptors. The structural information and inhibitory binding activities for all 106 compounds are given in Supplemental Dataset 1. Nineteen different compounds of the 106 pyrrolidine bis-diketopiperazines were identified with Ki values less than 100 nM for FPR1, of which 15 are FPR1-selective with Ki values more than 100-fold greater for FPR2. For the FPR2 receptor, 23 of the 106 compounds have Ki values less than 100 nM, and of those, 12 were selective for FPR2 with Ki values more than 100-fold greater for FPR1.
Fig. 2.

Scatter plot representation of 106 individual compounds derived from pyrrolidine bis-diketopiperazine library screened against FPR1 and FPR2. The activities (Ki) of each compound for each receptor are shown; their selectivity is denoted; and the number of compounds with different activities and selectivities are shown. See Supplemental Dataset 1 for structure and activity data on each compound. Data labeled a–g refer to compounds in Table 2 and Supplemental Fig. 1.
A visualization of the SAR for the inhibitory binding activity of the 106 diketopiperazine individual compounds is shown in Fig. 3. The figure summarizes the distribution of the inhibitory activity (Ki) values for compounds with a given R-group. Activity is color-coded with a continuous scale from more active (red) to less active (green). The most representative R-groups (i.e., with three or more compounds) are displayed. This visual representation of the SAR clearly shows striking differences in the general activity and selectivity pattern of R-groups. For example, Fig. 3 highlights the overall increased activity for FPR2 when small and aliphatic substituents are used in R1, in particular, S-isopropyl. In general, bulky and aromatic rings in R1 decrease the activity. In contrast, S-benzyl in R1 is favorable for activity for FPR1. A large and hydrophobic moiety in R1, such as R-naphthyl, is not tolerated for either FPR1 or FPR2. For R2, Fig. 3 visually emphasizes the selectivity for FPR2 when R-4-hydroxymethyl or R-2-naphthylmethyl is used. Strikingly, the selectivity switches to FPR1 when the aromatic S-benzyl is used instead at R2. This switch in selectivity might be due to either the switch in stereochemistry or the subtle structural differences in this set of aromatic substitutions. The small and polar S-hydroxymethyl group in R2 leads to inactive compounds for FPR1 and FPR2.
Fig. 3.

Visual representation of the SAR of 106 individual compounds screened against FPR1 and FPR2. The distribution of the activity (Ki) values for compounds containing an R-group is color-coded using a continuous scale from more active (red) to less active (green). The most populated R-groups, with three or more compounds, are shown. The number of compounds with a given substituent is represented with the number of slices in each pie. For visual clarity, the maximum number of slices shown is 16. The figure was generated with the Structure-Activity Report application of Molecular Operating Environment (version 2011.10; Chemical Computing Group Inc., Montreal, QC, Canada) (Clark and Labute, 2009).
Extended Functional Analysis.
Two FPR1 selective compounds from the pyrrolidine bis-diketopiperazine library, namely, 1754-113 and 1754-56 [(R)-4-(2-([1,1′-biphenyl]-4-yl)ethyl)-1-((R)-1-((S)-2-(((S)-6-butyl-2,3-dioxopiperazin-1-yl)methyl)pyrrolidin-1-yl)pentan-2-yl)-5-(4-hydroxybenzyl)piperazine-2,3-dione, are shown in Table 2, along with that of compound 1754-26 [(R)-4-(2-([1,1′-biphenyl]-4-yl)ethyl)-5-(4-hydroxybenzyl)-1-((R)-1-((S)-2-(((S)-6-isopropyl-2,3-dioxopiperazin-1-yl)methyl)pyrrolidin-1-yl)pentan-2-yl)piperazine-2,3-dione], which is the only compound of the 106 tested with a Ki value less than 100 nM for both receptors. These three compounds acted as antagonists when tested for their ability to elicit or inhibit FPR1-mediated intracellular Ca2+ response (Table 2). By contrast, the two compounds exhibited opposite effects in parallel analyses of Ca2+ responses mediated by FPR2. 1754-56 was an agonist for FPR2, with a low micromolar EC50 that matched the Ki value observed in the competitive ligand displacement assay (Supplemental Fig. 3; Table 2). 1754-56 and 1754-26 differ at the R1 functionality, which is S-butyl and S-isopropyl, respectively. Thus, a subtle change in the structure plays a dramatic role in selectivity for these ligands, representing a clear example of an “activity cliff.”
Three FPR2 selective pyrrolidine bis-diketopiperazines (1754-20 [(R)-4-(2-([1,1′-biphenyl]-4-yl)ethyl)-5-(4-hydroxybenzyl)-1-((R)-1-(4-hydroxyphenyl)-3-((S)-2-(((S)-6-isopropyl-2,3-dioxopiperazin-1-yl)methyl)pyrrolidin-1-yl)propan-2-yl)piperazine-2,3-dione], 1754-19 [(R)-4-(cyclohexylmethyl)-5-(4-hydroxybenzyl)-1-((R)-1-(4-hydroxyphenyl)-3-((S)-2-(((S)-6-isopropyl-2,3-dioxopiperazin-1-yl)methyl)pyrrolidin-1-yl)propan-2-yl)piperazine-2,3-dione], and 1754-31 [(R)-4-(cyclohexylmethyl)-5-(4-hydroxybenzyl)-1-((R)-1-((S)-2-(((S)-6-isopropyl-2,3-dioxopiperazin-1-yl)methyl)pyrrolidin-1-yl)-3-(naphthalen-2-yl)propan-2-yl)piperazine-2,3-dione]) are also shown in Table 2. It can be seen that the only difference between the nonselective inhibitor, 1754-26, and the FPR2-selective inhibitor, 1754-20, is the R2 functionality, which is R-propyl for the former and R-4-hydroxybenzyl for the latter. Another significant functional disparity resulted when the S-isopropyl R1 functionality of 1754-31 was replaced with an S-propyl functionality in 1754-49 [(R)-4-(cyclohexylmethyl)-1-((R)-1-((S)-2-(((S)-2,3-dioxo-6-propylpiperazin-1-yl)methyl)pyrrolidin-1-yl)-3-(naphthalen-2-yl)propan-2-yl)-5-(4-hydroxybenzyl)piperazine-2,3-dione]. Not only was there a decrease in FPR2 selectivity (>10,000 to ∼70), but the antagonist (1754-31) was converted to partial agonist (1754-49) in the FPR2-mediated Ca2+ response determinations (Supplemental Fig. 3; Table 2).
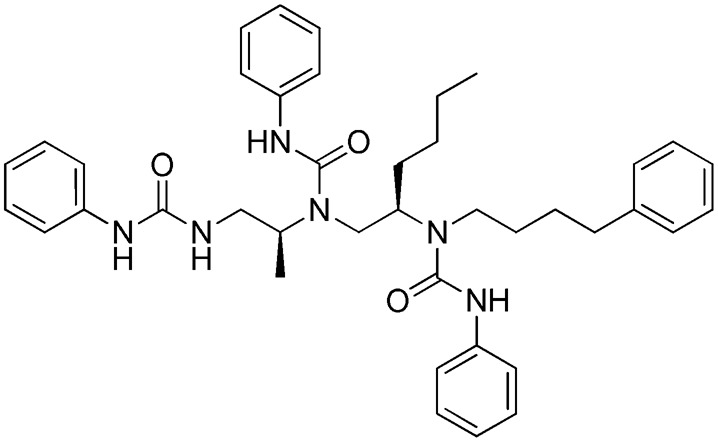
As shown in Fig. 1, library 36 (Library 1481 in Supplemental Table 1) was clearly more active at FPR1 than FPR2. This library is made up of a polyphenylurea scaffold having three positions of diversity. Each mixture contains 1,777–2,304 compounds; the entire library contains 85,248 compounds. Eight individual compounds (Table 1: 1753) were designed based on the deconvolution of the library screening data in FPR1, and the results of the four most active and selective compounds (Ki values 1–24 nM) are shown in Supplemental Dataset 2. 1753-101, 1753-102, and 1753-103 (Table 2) were determined to be selective partial agonists for FPR1 in intracellular Ca2+ response determinations, as illustrated in a representative dose-response profile for 1754-103 [3-phenyl-1-((R)-1-(3-phenyl-1-((S)-1-(3-phenylureido)propan-2-yl)ureido)hexan-2-yl)-1-(4-phenylbutyl)urea] in Supplemental Fig. 3.
Discussion
The rapid and efficient identification of potent and selective FPR ligands presented in this work is in accord with our previous findings that screening of mixture-based libraries enables the rapid exploration of novel regions of the chemical space not typically covered by commercially available screening compounds. The results of screening mixture-based combinatorial libraries over traditional HTS of commercially available small-molecule libraries to identify potent and selective FPR ligands are compared in Table 1. These results clearly show that the use of mixture-based libraries in a duplex HTS system was a more efficient and robust approach for the primary screening stage than the other approaches involving the screening of one compound per well. In the present study, 5,261 samples were initially screened to obtain hit frequencies of 1.1% for FPR1 and 0.6% for FPR2. In comparison with the MLSMR screen, this represented a 37- and 150-fold increase in hit identification efficiency, respectively. This finding indicates that positional scanning of mixture-based combinatorial libraries was significantly more efficient than random testing when evaluated by virtually any standard of significance chosen. It should be noted that the number of total compounds evaluated by the mixture libraries in this study (including five million small-molecule compounds) is beyond the range of feasibility for most single-compound screening efforts.
Screening of the highly dense region of chemical space covered by the active libraries tested herein led to the identification of potent and highly selective ligands and also provided substantial and useful structure-activity relationship information. The individual compounds generated from a positional scanning deconvolution are especially well suited to SAR analysis, since one can immediately analyze the effect that single or double substitutions at individual positions have on the activities of these compounds (see more later in this article). This SAR allows for the identification of the causes of activity cliffs that cannot be readily accomplished in libraries of individual compounds of disparate scaffolds. Thus, the exhaustive exploration of the SAR of the most active libraries readily revealed the presence of activity cliffs, chemical compounds with highly similar structures but unexpectedly very different biologic activities.
Recently, two separate groups have identified potent small-molecule FPR1 antagonists with Ca2+ response IC50 values of 398 nM (Unitt et al., 2011) and 4 nM (Morley et al., 2012). Small-molecule FPR1 agonists have also been identified in a number of recent studies (Schepetkin et al., 2007; Cilibrizzi et al., 2009; Kirpotina et al., 2010), the most potent of which had a Ca2+ response EC50 value of 630 nM (Schepetkin et al., 2007). Potent FPR2 agonists have also been reported with Ca2+ response EC50 values in the 30–40 nM range (Burli et al., 2006; Frohn et al., 2007). The compounds reported here include the most potent FPR1 agonist (1753-103) and FPR2 antagonist (1754-31) identified to date. These compounds are structurally distinct from all previously described FPR ligands. In intracellular Ca2+ response determinations, the FPR1 agonist had an EC50 of 131 nM (binding affinity 4 nM Ki) and the FPR2 antagonist had an IC50 of 81 nM (binding affinity 1 nM Ki).
The SAR findings summarized in Table 2 and Fig. 3 for the FPR1 and FPR2 ligands suggest the importance of S-butyl in the R1 functionality for FPR1 active and selective ligands and R-4-hydroxybenzyl in the R2 functionality for FPR2 active and selective ligands. More extensive structural activity analysis of the 106 compounds supports the importance of these functionalities. The functionalities that are more frequently found in the active and selective compounds for each of the receptors are 1) for FPR1, in R1 S-butyl and S-benzyl and in R2 R-propyl and S-benzyl; and 2) for FPR2, in R1 S-isopropyl followed by S-propyl and in R2 R-4-hydroxymethyl and R-2-naphthylmethyl. It is important to note that even in the primary screen, the mixtures with these functionalities show clear selectivity. For example, in library mixture 1344-8, R1 is defined with S-isopropyl and is active for FPR2, whereas library mixture 1344-21 is defined with S-butyl and shows significantly greater activity for FPR1 than FPR2 (Supplemental Fig. 2; Supplemental Table 2). Although there are specific R-groups with marked differences in activity for FPR1 and FPR2, Fig. 3 and the activity data for individual compounds in Table 2 also indicate that there are specific combinations of R-groups that determine the activity and selectivity of the individual ligands. To explore in detail the SAR of the entire data set, a systematic pairwise comparison of the structure and activity of the 106 molecules was conducted using the principles of activity landscape modeling. Results of the systematic analysis indicated that the compound pair 1754-26/1754-56 (Table 2) represents an “activity switch” where the substitution of an S-isopropyl with S-butyl at R1 increases the activity for FPR1 by 1.36 log units but decreases the activity for FPR2 by 1.28 log units. The analysis also rapidly revealed that the compound pair 1754-20/1754-56 (Table 2) is a “selectivity switch” because changes in the R-groups have a large and opposite effect on the activity for FPR1 and FPR2. These and other conclusions from the comprehensive SAR analysis based on the structure of the 106 ligands are reported elsewhere (Medina-Franco et al., 2013). The structure-activity analysis derived from the deconvolution of positional scanning libraries provides useful information about the importance of the functionalities at each position of the compound, which can then be used as a starting point for a more detailed characterization of the functionalities required for activity and selectivity.
Discrimination between agonists and antagonists in this study was based on elevation of intracellular calcium. We have shown previously that in these assay systems, the cellular response reflects a distribution of responding and nonresponding cells that are captured in the current analysis and can distinguish among antagonists as well as full and partial agonists. Thus, the collection of FPR1 and FPR2 agonists and antagonists we report here adds to the FPR1/FPR2 ligands identified and characterized by different groups. The ligands identified cover divergent structural classes, but in some cases, the ligands within structural classes display similar functional activity (i.e., piperazines as selective FPR2 agonists) (Kirpotina et al., 2010). However, there are several examples from these studies, including our own, in which compounds derived from similar scaffolds have divergent functional activity against FPR1 and FPR2, such as an apparently slight modification in structure changes a ligand from a selective agonist to a selective antagonist. For instance, N-tert-butoxycarbonyl peptides have been reported as FPR1 antagonists, whereas the N-formyl peptides of the same or similar composition are FPR1 agonists (Ye et al., 2009). The synthetic, nonpeptide FPR2 agonist (Quin-C1) differs from the FPR1 antagonist Quin-C7 only in the para position of the phenyl ring, methoxy (Quin-C1) to hydroxyl (C7) (Zhou et al., 2007). In the current study, modification of the R1 propyl functionality of the FPR2 agonist (1754-49) to an isopropyl yielded an FPR2 antagonist (1754-31). Additionally, there are examples of what appear to be small structural modifications that change a ligand from a target-selective functionality to a nonselective functionality against FPR1 and FPR2. For instance, Khlebnikov et al. (2012) report that by modifying the p-COOCH3 group on their benzimidazole selective FPR1 agonist (AG-11/05) to a m-COCH3 group, they obtained the dual FPR1/FPR2 agonist (AG-11/06). In a similar manner, we observed that the modification of the phenol portion of the R2 functionality of the FPR2 selective antagonist (1754-20) to a methyl group yielded the dual FPR1/FPR2 antagonist (1754-26) (Supplemental Fig. 4). The accumulated SAR to date supports the high degree of homology between the FPR targets. The ligands in which slight structural modifications produce a dramatic shift in functionality holds promise for the identification of therapeutically relevant, target/functionality specific compounds. Additionally, the breadth of structural classes reported to date for FPR1 and FPR2 indicates that many structural motifs are available for these targets, expanding the range of medicinal chemistry space available for optimization of leads.
The use of positional scanning libraries with a duplex HTS approach enabled the identification of compounds with diverse functional activities (selective agonist, selective antagonist, dual antagonist, mixed agonist/antagonist) containing a wealth of SAR from the screening 5,261 samples. It is important to note that more than five million small molecules were assessed in this approach. Such a wealth of data lends itself to a broad analysis and quantification of the overall screening process, which will be reported elsewhere (Santos et al., 2013). We anticipate that the combined approaches illustrated herein, in which mixture-based positional scanning libraries are screened in a variety of differing targets and assay formats, such as the duplex flow cytometry used in the current studies, will facilitate and accelerate a wide range of translational drug discovery efforts. Finally, it is worth noting that although the exploration of two libraries has revealed extraordinary pharmacological diversity, other opportunities within the TPIMS chemical space, such as libraries 8, 22, 23, 24, and 28, remain to be explored.
Supplementary Material
Acknowledgments
The authors thank Jason Fenwick for synthesizing individual compounds and Marty Eldridge for graphical assistance. The authors also thank the State of Florida, Executive Office of the Governor’s Office of Tourism, Trade, and Economic Development.
Abbreviations
- 1754-19
(R)-4-(cyclohexylmethyl)-5-(4-hydroxybenzyl)-1-((R)-1-(4-hydroxyphenyl)-3-((S)-2-(((S)-6-isopropyl-2,3-dioxopiperazin-1-yl)methyl)pyrrolidin-1-yl)propan-2-yl)piperazine-2,3-dione
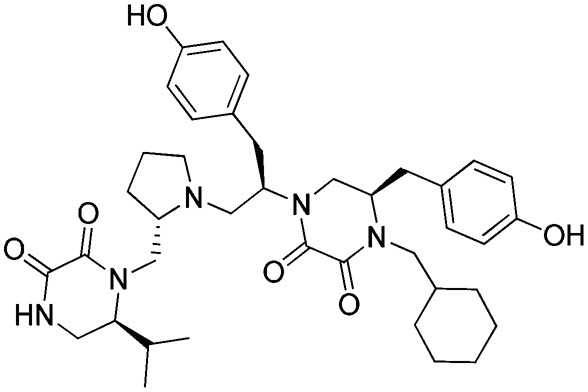
- 1754-20
(R)-4-(2-([1,1′-biphenyl]-4-yl)ethyl)-5-(4-hydroxybenzyl)-1-((R)-1-(4-hydroxyphenyl)-3-((S)-2-(((S)-6-isopropyl-2,3-dioxopiperazin-1-yl)methyl)pyrrolidin-1-yl)propan-2-yl)piperazine-2,3-dione
- 1754-26
(R)-4-(2-([1,1′-biphenyl]-4-yl)ethyl)-5-(4-hydroxybenzyl)-1-((R)-1-((S)-2-(((S)-6-isopropyl-2,3-dioxopiperazin-1-yl)methyl)pyrrolidin-1-yl)pentan-2-yl)piperazine-2,3-dione
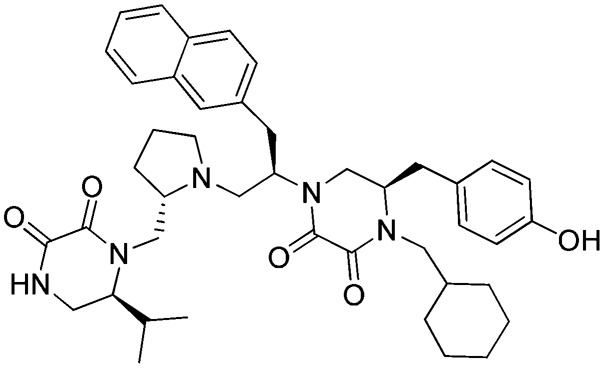
- 1754-31
(R)-4-(cyclohexylmethyl)-5-(4-hydroxybenzyl)-1-((R)-1-((S)-2-(((S)-6-isopropyl-2,3-dioxopiperazin-1-yl)methyl)pyrrolidin-1-yl)-3-(naphthalen-2-yl)propan-2-yl)piperazine-2,3-dione
- 1754-49
(R)-4-(cyclohexylmethyl)-1-((R)-1-((S)-2-(((S)-2,3-dioxo-6-propylpiperazin-1-yl)methyl)pyrrolidin-1-yl)-3-(naphthalen-2-yl)propan-2-yl)-5-(4-hydroxybenzyl)piperazine-2,3-dione
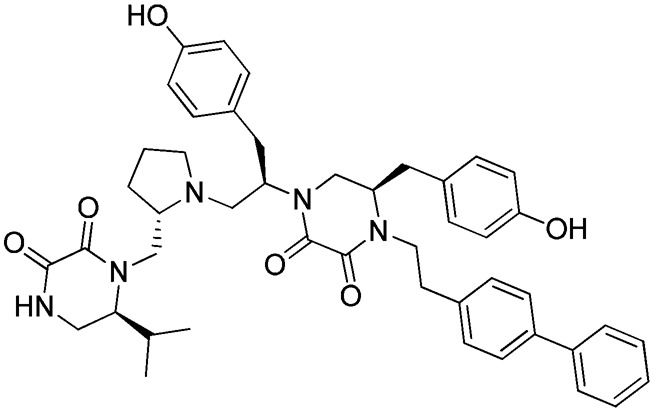
- 1754-56
(R)-4-(2-([1,1′-biphenyl]-4-yl)ethyl)-1-((R)-1-((S)-2-(((S)-6-butyl-2,3-dioxopiperazin-1-yl)methyl)pyrrolidin-1-yl)pentan-2-yl)-5-(4-hydroxybenzyl)piperazine-2,3-dione
- 1754-103
3-phenyl-1-((R)-1-(3-phenyl-1-((S)-1-(3-phenylureido)propan-2-yl)ureido)hexan-2-yl)-1-(4-phenylbutyl)urea
- 1754-113
1-((S)-1-((S)-2-(((S)-6-benzyl-2,3-dioxopiperazin-1-yl)methyl)pyrrolidin-1-yl)-3-phenylpropan-2-yl)-4-phenethyl-5-phenylpiperazine-2,3-dione
- FITC
fluorescein isothiocyanate
- FPR1
formylpeptide receptor
- FPR2
formylpeptide-like 1 receptor 1
- HTS
high-throughput screening
- LC-MS
liquid chromatography-mass spectrometry
- MLSMR
Molecular Library Small Molecule Repository
- SAR
structure-activity relationship
- TPIMS
Torrey Pines Institute for Molecular Studies
Authorship Contributions
Participated in research design: Pinilla, Edwards, Young, Sklar, Houghten.
Conducted experiments: Pinilla, Edwards, Appel, Yates-Gibbins, Giulianotti, Young, Medina-Franco, Santos.
Contributed new reagents or analytic tools: Pinilla, Edwards, Appel, Yates-Gibbins, Giulianotti, Medina-Franco, Santos.
Performed data analysis: Pinilla, Edwards, Appel, Yates-Gibbins, Giulianotti, Young, Medina-Franco, Santos.
Wrote or contributed to the writing of the manuscript: Pinilla, Edwards, Appel, Giulianotti, Medina-Franco, Santos, Sklar, Houghten.
Footnotes
This work was supported by the National Institutes of Health National Institute of Mental Health [Grants U54MH074425 and U54MH084690]; the National Institutes of Health National Human Genome Research Institute [Grant R01HG005066]; the University of New Mexico (UNM) Shared Flow Cytometry and High-Throughput Screening Resource supported in part by UNM Cancer Center and National Institutes of Health National Cancer Institute [Grant P30 CA118100] and National Institutes of Health National Center for Research Resources [U54 RR026083]; and the National Institutes of Health National Institute on Drug Abuse [Grant 1RO1DA031370].
 This article has supplemental material available at molpharm.aspetjournals.org.
References
- Acharya AN, Ostresh JM, Houghten RA. (2002) Determination of isokinetic ratios necessary for equimolar incorporation of carboxylic acids in the solid-phase synthesis of mixture-based combinatorial libraries. Biopolymers 65:32–39 [DOI] [PubMed] [Google Scholar]
- Bürli RW, Xu H, Zou X, Muller K, Golden J, Frohn M, Adlam M, Plant MH, Wong M, McElvain M, et al. (2006) Potent hFPRL1 (ALXR) agonists as potential anti-inflammatory agents. Bioorg Med Chem Lett 16:3713–3718 [DOI] [PubMed] [Google Scholar]
- Cilibrizzi A, Quinn MT, Kirpotina LN, Schepetkin IA, Holderness J, Ye RD, Rabiet MJ, Biancalani C, Cesari N, Graziano A, et al. (2009) 6-methyl-2,4-disubstituted pyridazin-3(2H)-ones: a novel class of small-molecule agonists for formyl peptide receptors. J Med Chem 52:5044–5057. [DOI] [PMC free article] [PubMed]
- Clark AM, Labute P. (2009) Detection and assignment of common scaffolds in project databases of lead molecules. J Med Chem 52:469–483 [DOI] [PubMed] [Google Scholar]
- Dooley CT, Houghten RA. (1993) The use of positional scanning synthetic peptide combinatorial libraries for the rapid determination of opioid receptor ligands. Life Sci 52:1509–1517 [DOI] [PubMed] [Google Scholar]
- Dufton N, Perretti M. (2010) Therapeutic anti-inflammatory potential of formyl-peptide receptor agonists. Pharmacol Ther 127:175–188 [DOI] [PubMed] [Google Scholar]
- Edwards BS, Bologa C, Young SM, Balakin KV, Prossnitz ER, Savchuck NP, Sklar LA, Oprea TI. (2005) Integration of virtual screening with high-throughput flow cytometry to identify novel small molecule formylpeptide receptor antagonists. Mol Pharmacol 68:1301–1310 [DOI] [PubMed] [Google Scholar]
- Frohn M, Xu H, Zou X, Chang C, McElvaine M, Plant MH, Wong M, Tagari P, Hungate R, Bürli RW. (2007) New ‘chemical probes’ to examine the role of the hFPRL1 (or ALXR) receptor in inflammation. Bioorg Med Chem Lett 17:6633–6637 [DOI] [PubMed] [Google Scholar]
- Giulianotti MA, Debevec G, Santos RG, Maida LE, Chen W, Ou L, Yu Y, Dooley CT, Houghten RA. (2012) A novel method for the determination of isokinetic ratios and its application in the synthesis of two new positional scanning libraries. ACS Comb Sci 14:503–512 [DOI] [PMC free article] [PubMed] [Google Scholar]
- Hensler ME, Bernstein G, Nizet V, Nefzi A. (2006) Pyrrolidine bis-cyclic guanidines with antimicrobial activity against drug-resistant Gram-positive pathogens identified from a mixture-based combinatorial library. Bioorg Med Chem Lett 16:5073–5079 [DOI] [PubMed] [Google Scholar]
- Houghten RA. (1985) General method for the rapid solid-phase synthesis of large numbers of peptides: specificity of antigen-antibody interaction at the level of individual amino acids. Proc Natl Acad Sci USA 82:5131–5135 [DOI] [PMC free article] [PubMed] [Google Scholar]
- Houghten RA, Pinilla C, Appel JR, Blondelle SE, Dooley CT, Eichler J, Nefzi A, Ostresh JM. (1999) Mixture-based synthetic combinatorial libraries. J Med Chem 42:3743–3778 [DOI] [PubMed] [Google Scholar]
- Houghten RA, Pinilla C, Blondelle SE, Appel JR, Dooley CT, Cuervo JH. (1991) Generation and use of synthetic peptide combinatorial libraries for basic research and drug discovery. Nature 354:84–86 [DOI] [PubMed] [Google Scholar]
- Houghten RA, Pinilla C, Giulianotti MA, Appel JR, Dooley CT, Nefzi A, Ostresh JM, Yu Y, Maggiora GM, Medina-Franco JL, et al. (2008) Strategies for the use of mixture-based synthetic combinatorial libraries: scaffold ranking, direct testing in vivo, and enhanced deconvolution by computational methods. J Comb Chem 10:3–19 [DOI] [PubMed] [Google Scholar]
- Khlebnikov AI, Schepetkin IA, Kirpotina LN, Brive L, Dahlgren C, Jutila MA, Quinn MT. (2012) Molecular docking of 2-(benzimidazol-2-ylthio)-N-phenylacetamide-derived small-molecule agonists of human formyl peptide receptor 1. J Mol Model 18:2831–2843 [DOI] [PMC free article] [PubMed] [Google Scholar]
- Kirpotina LN, Khlebnikov AI, Schepetkin IA, Ye RD, Rabiet MJ, Jutila MA, Quinn MT. (2010) Identification of novel small-molecule agonists for human formyl peptide receptors and pharmacophore models of their recognition. Mol Pharmacol 77:159–170 [DOI] [PMC free article] [PubMed] [Google Scholar]
- Kuckuck FW, Edwards BS, Sklar LA. (2001) High throughput flow cytometry. Cytometry 44:83–90 [PubMed] [Google Scholar]
- Le Y, Murphy PM, Wang JM. (2002) Formyl-peptide receptors revisited. Trends Immunol 23:541–548 [DOI] [PubMed] [Google Scholar]
- Le Y, Yazawa H, Gong W, Yu Z, Ferrans VJ, Murphy PM, Wang JM. (2001) The neurotoxic prion peptide fragment PrP(106-126) is a chemotactic agonist for the G protein-coupled receptor formyl peptide receptor-like 1. J Immunol 166:1448–1451 [DOI] [PubMed] [Google Scholar]
- Levesque L, Gaudreault RC, Marceau F. (1991) The interaction of 3,5-pyrazolidinedione drugs with receptors for f-Met-Leu-Phe on human neutrophil leukocytes: a study of the structure-activity relationship. Can J Physiol Pharmacol 69:419–425 [DOI] [PubMed] [Google Scholar]
- López-Vallejo F, Giulianotti MA, Houghten RA, Medina-Franco JL. (2012) Expanding the medicinally relevant chemical space with compound libraries. Drug Discov Today 17:718–726 [DOI] [PubMed] [Google Scholar]
- Maggiora GM. (2006) On outliers and activity cliffs: why QSAR often disappoints (Abstract). J Chem Inf Model 46:1535. [DOI] [PubMed] [Google Scholar]
- Medina-Franco JL, Martínez-Mayorga K, Bender A, Marín RM, Giulianotti MA, Pinilla C, Houghten RA. (2009) Characterization of activity landscapes using 2D and 3D similarity methods: consensus activity cliffs. J Chem Inf Model 49:477–491 [DOI] [PubMed] [Google Scholar]
- Medina-Franco JL, Martinez-Mayorga K, Giulianotti MA, Houghten RA, Pinilla C. (2008) Visualization of chemical space in drug discovery. Curr Computeraided Drug Des 4:322–333 [Google Scholar]
- Medina-Franco JL, Pinilla C, Appel JR, Giulanotti MA, Santos RG, Yongye AB, Edwards BS, Sklar LA, Houghten RA. (2013) Scanning structure-activity relantionships in combinatorial data sets: Rapid identification of activity-switches. J Chem Inf Model 53:1475–1485 [DOI] [PMC free article] [PubMed] [Google Scholar]
- Morley AD, King S, Roberts B, Lever S, Teobald B, Fisher A, Cook T, Parker B, Wenlock M, Phillips C, et al. (2012) Lead optimisation of pyrazoles as novel FPR1 antagonists. Bioorg Med Chem Lett 22:532–536 [DOI] [PubMed] [Google Scholar]
- Munson PJ, Rodbard D. (1988) An exact correction to the “Cheng-Prusoff” correction. J Recept Res 8:533–546 [DOI] [PubMed] [Google Scholar]
- Nefzi A, Ong N, Houghten RA. (2000) An efficient two-step synthesis of mono-, di- and triureas from resin-bound amides. Tetrahedron Lett 41:5441–5446 [Google Scholar]
- Nefzi A, Ostresh JM, Yu Y, Houghten RA. (2004) Combinatorial chemistry: libraries from libraries, the art of the diversity-oriented transformation of resin-bound peptides and chiral polyamides to low molecular weight acyclic and heterocyclic compounds. J Org Chem 69:3603–3609 [DOI] [PubMed] [Google Scholar]
- Ostresh JM, Husar GM, Blondelle SE, Dörner B, Weber PA, Houghten RA. (1994a) “Libraries from libraries”: chemical transformation of combinatorial libraries to extend the range and repertoire of chemical diversity. Proc Natl Acad Sci USA 91:11138–11142 [DOI] [PMC free article] [PubMed] [Google Scholar]
- Ostresh JM, Winkle JH, Hamashin VT, Houghten RA. (1994b) Peptide libraries: determination of relative reaction rates of protected amino acids in competitive couplings. Biopolymers 34:1681–1689 [DOI] [PubMed] [Google Scholar]
- Pinilla C, Appel JR, Blanc P, Houghten RA. (1992) Rapid identification of high affinity peptide ligands using positional scanning synthetic peptide combinatorial libraries. Biotechniques 13:901–905 [PubMed] [Google Scholar]
- Pinilla C, Appel JR, Borràs E, Houghten RA. (2003) Advances in the use of synthetic combinatorial chemistry: mixture-based libraries. Nat Med 9:118–122 [DOI] [PubMed] [Google Scholar]
- Ramirez S, Aiken CT, Andrzejewski B, Sklar LA, Edwards BS. (2003) High-throughput flow cytometry: validation in microvolume bioassays. Cytometry A 53:55–65 [DOI] [PubMed] [Google Scholar]
- Reilley KJ, Giulianotti MA, Dooley CT, Nefzi A, McLaughlin JP, Houghten RA. (2010) Identification of two novel, potent, low-liability antinociceptive compounds from the direct in vivo screening of a large mixture-based combinatorial library. AAPS J 12:318–329 [DOI] [PMC free article] [PubMed] [Google Scholar]
- Rivière S, Challet L, Fluegge D, Spehr M, Rodriguez I. (2009) Formyl peptide receptor-like proteins are a novel family of vomeronasal chemosensors. Nature 459:574–577 [DOI] [PubMed] [Google Scholar]
- Santos RG, Appel JR, Giulianotti MA, Edwards BS, Sklar LA, Houghten RA, Pinilla C. (2013) The mathematics of a successful deconvolution: a quantitative assessment of mixture-based combinatorial libraries screened against two formylpeptide receptors. Molecules 18:6408–6424 [DOI] [PMC free article] [PubMed] [Google Scholar]
- Santos RG, Giulianotti MA, Dooley CT, Pinilla C, Appel JR, Houghten RA. (2011) Use and implications of the harmonic mean model on mixtures for basic research and drug discovery. ACS Comb Sci 13:337–344 [DOI] [PMC free article] [PubMed] [Google Scholar]
- Schepetkin IA, Kirpotina LN, Khlebnikov AI, Quinn MT. (2007) High-throughput screening for small-molecule activators of neutrophils: identification of novel N-formyl peptide receptor agonists. Mol Pharmacol 71:1061–1074 [DOI] [PubMed] [Google Scholar]
- Schimmer AD, Welsh K, Pinilla C, Wang Z, Krajewska M, Bonneau M-J, Pedersen IM, Kitada S, Scott FL, Bailly-Maitre B, et al. (2004) Small-molecule antagonists of apoptosis suppressor XIAP exhibit broad antitumor activity. Cancer Cell 5:25–35 [DOI] [PubMed] [Google Scholar]
- Singh N, Guha R, Giulianotti MA, Pinilla C, Houghten RA, Medina-Franco JL. (2009) Chemoinformatic analysis of combinatorial libraries, drugs, natural products, and molecular libraries small molecule repository. J Chem Inf Model 49:1010–1024 [DOI] [PMC free article] [PubMed] [Google Scholar]
- Unitt J, Fagura M, Phillips T, King S, Perry M, Morley A, MacDonald C, Weaver R, Christie J, Barber S, et al. (2011) Discovery of small molecule human FPR1 receptor antagonists. Bioorg Med Chem Lett 21:2991–2997 [DOI] [PubMed] [Google Scholar]
- Ye RD, Boulay F, Wang JM, Dahlgren C, Gerard C, Parmentier M, Serhan CN, Murphy PM. (2009) International Union of Basic and Clinical Pharmacology. LXXIII. Nomenclature for the formyl peptide receptor (FPR) family. Pharmacol Rev 61:119–161 [DOI] [PMC free article] [PubMed] [Google Scholar]
- Young SM, Bologa C, Prossnitz ER, Oprea TI, Sklar LA, Edwards BS. (2005) High-throughput screening with HyperCyt flow cytometry to detect small molecule formylpeptide receptor ligands. J Biomol Screen 10:374–382 [DOI] [PubMed] [Google Scholar]
- Young SM, Bologa CM, Fara D, Bryant BK, Strouse JJ, Arterburn JB, Ye RD, Oprea TI, Prossnitz ER, Sklar LA,, et al. (2009) Duplex high-throughput flow cytometry screen identifies two novel formylpeptide receptor family probes. Cytometry A 75:253–263 [DOI] [PMC free article] [PubMed] [Google Scholar]
- Zhang JH, Chung TD, Oldenburg KR. (1999) A simple statistical parameter for use in evaluation and validation of high throughput screening assays. J Biomol Screen 4:67–73 [DOI] [PubMed] [Google Scholar]
- Zhou C, Zhang S, Nanamori M, Zhang Y, Liu Q, Li N, Sun M, Tian J, Ye PP, Cheng N,, et al. (2007) Pharmacological characterization of a novel nonpeptide antagonist for formyl peptide receptor-like 1. Mol Pharmacol 72:976–983 [DOI] [PubMed] [Google Scholar]
- Zhou Y, Bian X, Le Y, Gong W, Hu J, Zhang X, Wang L, Iribarren P, Salcedo R, Howard OM,, et al. (2005) Formylpeptide receptor FPR and the rapid growth of malignant human gliomas. J Natl Cancer Inst 97:823–835 [DOI] [PubMed] [Google Scholar]
Associated Data
This section collects any data citations, data availability statements, or supplementary materials included in this article.