

Abstract
Introduction
Increased methamphetamine use occurred during the last decade and little is known about factors associated with death.
Objective
This study assesses trends in psychostimulant deaths in the United States.
Methods
Using the CDC Wonder Database we reviewed all deaths among 15-64 year olds from 1999 to 2009. We identified decedents who died with “psychostimulants with abuse potential, excluding cocaine” using the ICD code T43.6 to identify methamphetamine-related deaths. We determined trends in death rates and the most common underlying causes of death. We calculated age-stratified and age-adjusted death rates/100,000 person-years (p-y) and (95% confidence interval [CI]) among those who died with psychostimulants from 2005 to 2009.
Results
The rate of psychostimulant-related deaths increased three fold from 1999 (0.37/100,000 (p-y) (95% CI 0.354-0.39) to 2005 (1.05/100,000 p-y (95% CI 1.01-1.10). Deaths steadily declined from 2006 to 2008, but rose again in 2009 to 0.97/100,000 p-y (95% CI 0.92-1.01). Across all age groups, men had a 2-3 times higher rate of death than women. American Indians/Alaska Natives were twice as likely to die a psychostimulant-related death as compared to non-Hispanic whites. The Northwestern/Western region of the US had the highest rates of psychostimulant-related deaths, while the Northeastern region had the lowest death rates. “Accidental poisonings” (ICD-10: X40-49) was the most frequently listed cause of death among those who died with psychostimulants.
Conclusions
Psychostimulant related deaths declined from 2006 to 2008 but are rebounding. Interventions targeting those at highest risk of death must be implemented and studied to prevent increasing deaths.
Keywords: methamphetamine, amphetamine, psychostimulant, overdose
Introduction
Methamphetamines and other related psychostimulants, such as amphetamine salts and methylphenidate, are highly addictive and widely abused. From 2004 to 2008, among individuals 12 years and older in the United States (US), methamphetamine showed the highest trends in increased use, only behind cocaine, marijuana, and prescription drugs (1). Methamphetamine use declined significantly from 2002 to 2008, but rose again in 2009. The number of individuals aged 12 and older who used methamphetamine in the past month increased 60% from 2008 to 2009 (2). Non-medical use of amphetamine salts and methylphenidate has also increased, with self-reported use ranging from 5-35% among college-aged students (3). Tracking methamphetamine use via national surveys and treatment admissions allows for monitoring trends in use. However, the effect of psychostimulants on mortality remains poorly understood.
Sources for monitoring use of methamphetamine and related psychostimulants include: the Treatment Episode Dataset (TEDS), which records approximately 1.5 million substance abuse treatment admissions annually, the Drug Abuse Warning Network Dataset (DAWN), a national surveillance system that moniters emergency department (ED) visits associated with drug abuse and drug-related deaths, and the National Survey on Drug Use and Health (NSDUH), which provides national and state-level data on the use of tobacco, alcohol, illicit drugs, and mental health in the US (4-6). Addionally, the US Drug Enforcement Agency (DEA) provides yearly statistics on rates of methamphetamine lab and paraphenilia seizures (7). According to these sources, people seeking treatment for methamphetamine/amphetamine addiction increased 88% from 1997 to 2007 (8). Nationally, ED visits involving amphetamines or methamphetamine increased 54% between 1995 to 2002, however from 2004 to 2009, ED visits related to methamphetamine use decreased by more than 50%, while ED visits related to amphetamine use increased (9,10). The US DEA reported 241 clandestine methamphetamine lab seizures during 1995. By 2004, lab seizures peaked to 18,091 and in 2010 they remained high at 13,378 (7). At the turn of the 21st century, the US experienced an explosion of methamphetamine use, triggering the aptly titled period in our history “The Meth Epidemic.” We set out to examine trends in deaths involving methamphetamine and related psychostimulants.
Little is known about psychostimulant-related deaths, demographics of decedents, or related disorders contributing to death. People who use methamphetamine, and other stimulants, often suffer from psychiatric comorbidities, including psychotic and mood disorders (11,12). What role these mental health disorders play in death warrents further investigation. We reviewed all deaths among those 15-64 years related to psychostimulant (non-cocaine) use in the US from 1999 to 2009. We sought to determine the number of deaths related to psychostimulant use, risk factors for death, temporal and geographic trends, and sociodemographic factors of those who died with psychostimulants from 2005 to 2009. We hypothesized deaths related to psychostimulants would increase over the study period, mirroring the increased use of methamphetamine reported by the TEDS and DAWN datasets. We expected that the death rate related to psychostimulants would be greatest in the Western US, and that the decendents would be mostly young males. Lastly, we hypothesized that many people who died with psychostimulants would have a co-occurring mental or behavioral disorders related to their substance abuse.
Methods
Data Sources and Variables
This study reviewed publically available death data which was exempted from protocol review by the Colorado Multiple Institutional Review Board. We used the CDC Wonder Database which listed cause of death data taken from US residents’ death certificates. CDC Wonder collected mortality data from records for all certificates filed in the US. Deaths of residents who died abroad and deaths of foreign residents (ie. illegal immigrants) were excluded from the database. This dataset included mortality information and population-based data spanning the years 1999 to 2009 and referenced the 2000 year population. Each death record contained a single underlying cause of death and up to twenty multiple causes of death listed by the physician/coroner. Underlying (primary) cause of death was defined by the World Health Organization (WHO) as the “disease or injury which initiated the the train of events leading directly to the death, or the circumstances of the accident or violence which producted the fatal injury.” Underlying cause of death was selected from the conditions entered by the physician/coroner on the cause of death section on the death certificate. The number of deaths, crude death rates, or age-adjusted death rates were obtained by place of residence upon death, age group, race/ ethnicity, gender, year of death, and cause of death by the associated International Classification of Diseases-10 (ICD-10) code (13).
Case Selection and Classification
The ICD code T43.6, “poisoning due to psychostimulants with abuse potential excluding cocaine,” was used to search the database because it most accurately captures the events of interest. Because T43.6 describes only the mechanism of death, it could not be used to search the database as the underlying cause of death. “Poisoning by psychostimulants”does not describe the disease or injury which led directly to death. For this reason, T43.6 was listed as one of the multiple causes of death contributing to the underlying cause of death on the death certificate. Using the code T43.6, we searched the database for the total number of deaths per year from 1999 to 2009. Next, we searched for demographic information, including age, gender, race/ethnicity, state of residence upon death, limiting the search to the years 2005 to 2009 for a more timely reprepresentation of trends. Lastly, we determined the most common underlying causes of death among those who died with psychostimulants, which included all years, 1999 to 2009. In our analysis, we excluded individuals less than 15 years old and older than 64 years old due to small numbers relative to the other age groups.
Statistical Analyses
We used age-adjusted death rates (number of deaths/100,000 person years [p-y], and 95% confidence intervals [CI]) by gender, race/ethnicity and state using the 2000 U.S. standard population. When we calculated death rates by selected age groups, crude rates were used and expressed as the number of deaths reported each calendar year. We calculated rate ratios by dividing the rate of the referent group by the rate of the group of primary interest. We calculated the percentage of psychostimulant-related deaths which had an autopsy performed from 2003 to 2009.
Results
There were 15,514 psychostimulant-related deaths recorded over the eleven year period among 15-64 year olds in the US. The rate of psychostimulant-related deaths increased from 0.37/100,000 person-years (p-y) (95% CI 0.354-0.39) in 1999 to 1.05/100,000 p-y (95% CI 1.01-1.10) in 2005 (Figure 1). By 2008, deaths due to psychostimulants dropped significantly to 0.78/100,000 p-y (95% CI 0.74-0.82), but rose again to 0.97/100,000 p-y (95% CI 0.92-1.01) in 2009. From 2005-2009, men 45-54 years old had the highest overall death rate (1.93/100,000 p-y), however men aged 55-64 died a psychostimulant-related death 3.64 times more than women (Table I). Women 35-44 years old had the highest death rate among all other female age groups (0.72/100,000 p-y). Across all age groups, men had a 2-3 times higher rate of death than women (Table I).
Figure 1.

1999-2009 Death Rates Related to Psychostimulants in 15-64 Year Olds
Table I.
Gender Death Rate and Death Rate Ratio Related to Psychostimulants in 15-64 Year Olds for 2005 to 2009
| Age Group |
Male Death Rate |
Female Death Rate |
Male: Female Death Rate Ratio |
|---|---|---|---|
| 15-24 | 0.57 | 0.24 | 2.38 |
| 25-34 | 1.19 | 0.49 | 2.43 |
| 35-44 | 1.74 | 0.72 | 2.42 |
| 45-54 | 1.93 | 0.71 | 2.68 |
| 55-64 | 0.91 | 0.25 | 3.64 |
When grouping decedents by race/ethnicity from 2005-2009, American Indians/Alaska Natives had a death rate of 2.05/100,000 p-y, 95% CI 1.74-2.36 (Table II). American Indians/Alaska Natives were twice as likely to die a psychostimulant-related death as compared to non-Hispanic whites. Of all racial/ethnic groups, African Americans had the lowest death rate related to psychostimulants (0.31/100,000 p-y, 95% CI 0.28-0.34).
Table II.
Death Rates Related to Psychostimulants and Death Rate Ratios by Race/Ethnicity in 15-64 Year Olds for 2005 to 2009
| Race | Age Adjusted Rate/100,000 p-y (95% CI) |
Death Rate Ratio* |
|---|---|---|
| White | 1.02 (1.00-1.05) | 1 |
|
African
American/Black |
0.31 (0.28-0.34) | 0.30 |
|
Asian or Pacific
Islander |
0.58 (0.51-0.65) | 0.57 |
|
American Indian or
Alaska Native |
2.05 (1.74-2.36) | 2.01 |
| Hispanic or Latino | 0.86 (0.81-0.91) | 0.84 |
| Total | 0.89 (0.87-0.91) | 0.87 |
Referent group: Whites
The Northwestern/Western region of the US had the highest rates of psychostimulant-related deaths, while the Northeastern region had the lowest death rates (Figure 2). The ten states with the highest psychostimulant-related death rate ranged from 1.7 to 5 times the national average over the five period from 2005 to 2009 (Table III). Nevada had the highest death rate related to psychostimulants each of the ten years studied ranging from 2.15/100,000 p-y (95% CI 1.43-3.11) in 1999 to a peak of 6.42/100,000 p-y (95% CI 5.21-7.84) in 2004 (Table IV).
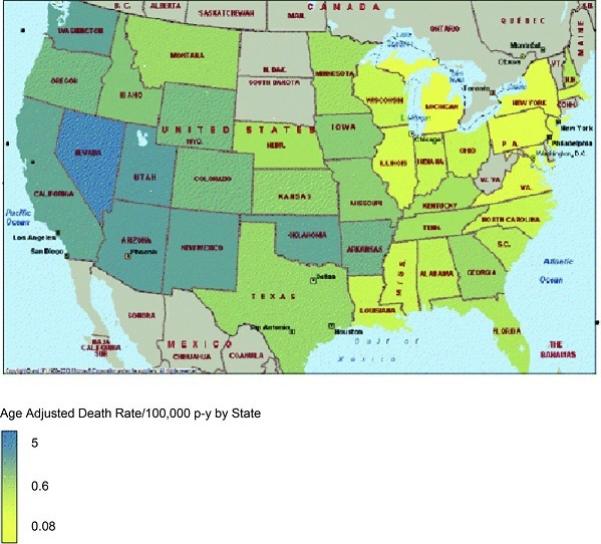
Table III.
U.S. States with Highest Death Rates Related to Psychostimulants and State Death Rate Ratio from 2005-2009 in 15-64 Year Olds
| Residence at time of death |
Age Adjusted Death Rate per 100,000 p-y (95% CI) |
State Death Rate Ratio* |
|---|---|---|
| Nevada | 4.62 (4.15-5.08) | 5.19 |
| Hawaii | 4.41 (3.77-5.05) | 4.96 |
| New Mexico | 3.02 (2.59-3.46) | 3.39 |
| Arizona | 2.97 (2.73-3.21) | 3.34 |
| Utah | 2.88 (2.51-3.26) | 3.24 |
| California | 2.68 (2.59-2.78) | 3.01 |
| Washington | 2.44 (2.23-2.65) | 2.74 |
| Oklahoma | 2.40 (2.11-2.69) | 2.70 |
| Arkansas | 1.91 (1.62-2.20) | 2.15 |
| Wyoming | 1.53 (1.00-2.25) | 1.72 |
|
U.S. Death
Rate |
0.89 (0.87-0.91) | 1.0 |
Referent group: U.S. Death Rate related to psychostimulants
Table IV.
Age Adjusted Death Rates Related to Psychostimulants in Nevada from 1999 to 2009 in 15-64 Year Olds
| Year | Age Adjusted Death Rate/100,00 p-y (95% CI) |
|---|---|
| 1999 | 2.15 (1.43-3.11) |
| 2000 | 2.27 (1.53-3.24) |
| 2001 | 2.54 (1.77-3.53) |
| 2002 | 4.83 (3.77-6.11) |
| 2003 | 4.63 (3.60-5.88) |
| 2004 | 6.42 (5.21-7.84) |
| 2005 | 5.65 (4.53-6.95) |
| 2006 | 5.31 (4.25-6.56) |
| 2007 | 3.81 (2.94-4.86) |
| 2008 | 3.73 (2.88-4.76) |
| 2009 | 4.56 (3.61-5.69) |
The most common underlying causes of death associated with psychostimulants were examined. “Accidental poisonings” (ICD-10: X40-49) was the most frequently listed cause of death (Figure 3). The remaining underlying causes of death include: 1) “poisonings of undetermined intent” (ICD 10: Y11-Y19), 2) “intentional self-poisoning”(ICD 10: X60-X69), 3) “hypertensive and heart diseases”(ICD 10: I10-I15, I20-I25, I30-I51), and 4) “mental and behavioral disorder due to psychoactive substance use” (ICD 10: F10-F19). All remaining underlying causes of death are listed as “other” (Figure 3).
Figure 3.

Underlying Causes of Death among those who died with Psychostimulants
Autopsy status listed as yes, no, or unknown, was recorded on all poisoning-related deaths beginning in 2003. On average, autopsies were known to have been perfomed on 83% of those who were listed as having a psychostimulant-related death.
Discussion
During the years 1999 to 2009 there was a significant overall increase in the psychostimulant-related death rate in the United States. These results demonstrate that men had a higher psychostimulant-related death rate across all age groups. American Indians/Alaska Natives were at the highest risk of a psychostimulant-related death as compared to all other racial/ethnic groups. The Northwestern and Western United States uniformly reported the highest death rates related to psychostimulants. Lastly, those who died with psychostimulants often died of an accidental overdose, but many died of intentional poisoning, a cardiac-related event, or a mental/behavorial disorder.
The rise in psychostimulant-related deaths from 1999 to 2005 reflects national treatment admissions data for methamphetamine, population-based surveys on the emergence of methamphetamine abuse, and the increasing number of methamphetamine lab seizures across the US over the last decade. According to the TEDS data set, from 1999 to 2006, treatment admissions for methamphetamine/amphetamine increased 156% (25/100,000 admissions to 64/100,000 admissions) (14). Methamphetamine treatment admissions peaked in 2005, and declined in 2006-2007, reflecting our findings for psychostimulant-related death rates (8). The NSDUH found that of the 203,670 people ≥ 12 years old surveyed, those meeting criteria for methamphetamine abuse or dependence increased from 10.6% in 2002 to 22.3% in 2004 (3). Dependent methamphetamine users have been shown to be at a higher risk of overdose and have negative health comorbidities associated with chronic substance abuse, including death (15). National trends showing increased dependence on methamphetamine mirror our findings for an increased psychostimulant-related death rate until 2005.
Death rates related to psychostimulants peaked in 2005, dropped from 2006 to 2008 and rose again in 2009. These numbers are consistent with NSDUH data which showed that past month methamphetamine users decreased from 2006 (731,000, 0.3%) to 2008 (314,000, 0.1%), but increased in 2009 (502,000, 0.2%) (16,17). Although there was an increase in psychostimulant related death rates from 2008 to 2009, ER visits continued to decline from 2008 (66,308) to 2009 (64,117) (10). The temporary drop in methamphetamine use may be attributed to the Combat Methamphetamine Act, federal legislation enacted in March 2006, regulating retail over-the-counter sales of ephedrine, pseudoephedrine, and phenylpropanolamine, all important precursors in the manufacturing of methamphetamine (18). With the paucity of precursor chemicals, small methamphetamine manufactures declined, methamphetamine became scarce, and the price per ounce increased. The decline in psychostimulant use may be temporary, with rising numbers of methamphetamine lab seizures across the Southeastern and Midwestern US. According to the DEA, methamphetamine lab seizures doubled from 2007 to 2010, demonstrating a resurgence of methamphetamine production (7).
Across all age groups, men had a higher psychostimulant-relate death rate. Interestinly, a meta-analysis examining gender differences in methamphetamine users showed that women report a younger age of initiation as compared to age-matched men (19). Similarly, survey data from 2002 to 2005 of past year methamphetamine initiation show that women, aged 12 years or older, had higher rates of first time use as compared to age-matched men. Over the same time period, however, men had higher trends of past year use compared to age-matched women (20). According to DAWN admissions data from 2004 to 2008, men had nearly double the number of ED visits involving methamphetamine as compared to women (293,139 versus 163,209) (21). Although women inititate methamphetamine use at a younger age, men tend to use methamphetamine more frequently and have more ED admissions related to its use. These trends may help to explain why men had an overall higher psychostimulant-related death rate.
Our results show an increased mortality rate among American Indians/Alaska Natives above any other racial/ethnic group in the US. American Indians/Alaska Natives generally report higher lifetime and past year use of illicit drugs compared to all other racial/ethnic groups (22). During 2006 to 2008, American Indians/Alaska Natives ≥ 12 years old reported using methamphetamine 3 times more than the national average for the same age group (1.4% vs. 0.54%) (23). Data from the Indian Health Service show a 60% increase in treatment admissions for methamphetamine abuse between 2001 and 2007 (24). During 2001 to 2006, methamphetamine use among the Navajo Nation more than doubled (25). In 2006, the Bureau of Indian Affairs Office of Law Enforcement Services surveyed Tribes regarding their perception of methamphetamine’s impact on their community. Three quarters of Tribal Police surveyed felt that methamphetamine posed the greatest threat to their community, more than any other substance, including alcohol, and 64% indicated an increased in domestic violence and assault/battery as a result of increased methamphetamine use (26). There are significant barriers to receiving substance abuse treatment among American Indians/Alaska Natives living in urban areas and on reservations, including low insurance coverage, limited access to transportation, and discomfort in the “westernized” treatment health care system (27-29). These factors may partially explain the disportionately high rate of psychostimulant-related deaths among Native Americans/Alaska Natives.
From 2005-2009, states located in the northwestern and western US had the highest death rates related to psychostimulants. These data parallel treatment admission during 1997-2007. Over these eleven years, 64-74% of primary methamphetamine treatment admissions were located in the West; over the same time period, only 1% methamphetamine treatment admissions were located in the Northeast (8). More recently, however, there has been a shift in these trends. Total treatment admissions across the US for methamphetamine/amphetamine declined steadily from 2005 to 2010, but in the midwestern and southestern US, treatment admissions remained relatively stable or increased from 2008 to 2010 (17,30). Simarily, domestic methamphetamine lab seizure rates increased and remained high in midwestern and southestern states from 2004-2010 (7). We believe that future pyschostimulant-related death rate data will reflect these trends, with increasing death rates in the Southeastern and Midwestern US relative to the Western and Northwestern US.
Of those who died with psychostimulants, most had an underling cause of death due to an accidental or intentional overdose. Hypertension/cardiac diseases and mental and/or behavioral disorders due to psychoactive substance use were two additional commonly listed causes of death. Numerous studies have established a relationship between methamphetamine/amphetamine use and fatal cardiac outcomes, including myocardial infarction and cardiomyopathy leading to congestive heart failure (31-36). A greater understanding of the cardiac complications related to methamphetamine abuse is warrented due to the high morbidity and mortality shown to be associated with its use.
Mental and behavioral problems have also shown to be associated with methamphetamine use. Prior studies have suggested that methamphetamine users develop methamphetamine-induced psychotic disorders and psychotic symptoms, behavior problems, including violent behavior, and depression with or without suicide attempt (10,37-40). Using methamphetamine can increase the risk of developing a mental or behavorial disorder, or aggravate an existing one, thus increasing the risk of death from a variety of causes.
Strengths and Limitations
This is study examined trends in psychostimulants-related mortality using a large national dataset of all deaths among those 15-64 years old in the US. Limitations in this study relate to the ICD-10 coding for psychostimulants which are not sufficiently sensitive to determine whether deaths were related to methamphetamine versus pharmaceutical psychostimulants such as methylphenidate or amphetamine salts. The data source relies on data from the original death certificates, and may contain diagnostic information which was recorded based on best available information, especially in the circumstance when a decedent was found post-mortem. Autopsy status (yes, no, unknown) on overdose deaths was listed by CDC Wonder beginning in 2003. Confirmation of psychostimulants upon death by autopsy increases the validity of these results. This data source could not provide information about alternative causes of death that might be related to methamphetamine use. For example, some homicide deaths may have been related to methamphetamine use among the perpetrators (rather than the victims). Thus, we may have underestimated the national burden of death related to methamphetamine use and distribution.
Lastly, Oregon, a state with a high rate of psychostimulant-related deaths, does not distiguish between methamphetamine and amphetamine when tracking treatment admissions in the 1996-2006 TEDS admissions data set. However, for the states that did make this distinction, methamphetamine constituted about 95% of combined methamphetamine/amphetamine admissions (13).
Conclusion
This study highlights important sociodemographic aspects among those who died with psychostimulants. Non-Hispanic white males and American Indians/Alaska Natives are at highest risk of a psychostimulant-related death. Individuals 45-54 years old and people residing in Western/Northwestern United States are also at a high risk of death. With the knowledge gained from this study, a broad range of interventions should be explored to prevent further fatalities in these populations. Psychostimulant-related deaths in the US are a significant drug-related cause of death, and warrant resource allocation and further study for prevention measures.
Based on mortality data in 2009, psychostimulant-related deaths are increasing after a period of decline. Increasing methamphetamine production in Mexcio and small scale domestic production is driving up methamphetamine availability in the US. Since mid-2009, methamphetamine seizure, price, and purity levels have indicated increasing methampehtamine availability in US drug markets (41). Current laws in restricting over the counter sales of ephedrine, pseudoephedrine, and phenylpropanolamine caused a tempory decline in methamphetamine production, which likely decreased methamphetamine use and subsequent psychostimulant-related deaths. More recently, national survey data showed that use has quickly rebounded as methamphetamine availability has increased (2,7). Prevention, treatment and law enforcement continue to be important in combating methamphetamine use and related death. Programs that target youth and adolescents need to continue any methamphetamine-related educational component of their prevention strategies. Their efficacy needs to be studied in order to adapt to changing trends in use. Broad implemention of prevention programs should be initiated in communities where psychostimulant-related mortality remains high, such as Native American reservations.
Treatment of substance abuse continues to play an important role in prevention of death. Linking methamphetamine users with appropriate treatment services will reducing the morbidity and mortality associated with methamphetamine use. This is especially true in rural areas of the US where use continues to be a problem. Adapting successful prevention and treatment programs which target specific high risk group demographics, such as middle aged males and Native Americans, may improve mortality outcomes. Further research to identify potential pharmacotherapeutic interventions in the treatment of methamphetamine abuse may help prevent relapse in patients who struggle with traditional treatment methods. Finally, law enforcement should continue to target methamphetamine at the source via both domestic labs and the border with Mexico. Officers should be kept up to date on clandestine methamphetamine manufactures’ most recent production methods in order to recognize the signs of new production methods (42). Methamphetamine production and availability has rebounded in the US. Future mortality data will contine to show increasing numbers reflecting this trend unless key measures are broadly implemented.
Acknowledgments
Funding sources for authors during the study include a grant from the Department of Health and Human Services, Health Resources and Services Administration T32HP10006 to Pediatrics School of Medicine, University of Colorado in support of Dr. Calcaterra. Dr. Binswanger was supported by the National Institute on Drug Abuse (R03DA029448, R21DA031041). The content is solely the responsibility of the authors and does not necessarily represent the official views of the funders.
Abbreviations
- CDC
Center for Disease Control
- TEDS
Treatment Episode Data Set
- NSDUH
National Survey of Drug Use and Health
- DAWN
Drug Abuse Warning Network
- ICD
International Classification of Disease
- CI
Confidence interval
- DEA
Drug Enforcement Agency
- WHO
World Health Organization
- ED
emergency department
Footnotes
Conflict of Interest: None
Bibliography
- 1.National Drug Threat Assessment 2010 . U.S. Dept of Justice National Drug Intelligence Center; [Accessed 1/2012]. Feb, 2010. Table B1. Trends in Percentage of Past Year Drug Use, 2004-2008. http://www.justice.gov/ndic/pubs38/38661/ [Google Scholar]
- 2.Substance Abuse and Mental Health Services Administration . Summary of National Findings (Office of Applied Studies, NSDUH Series H-38A, HHS Publication No. SMA 10-4856Findings) Rockville, MD: [Accessed 7/2012]. 2010. Results from the 2009 National Survey on Drug Use and Health: Volume I. http://www.samhsa.gov/data/NSDUH/2k9NSDUH/2k9Results.htm. [Google Scholar]
- 3.Wilens T, Adler L, Adams J, et al. Misuse and diversion of stimulants prescribed for ADHD: A systemic review of the literature. Journal of the American Academy of Child and Adolescent Psychiatry. 2008;47:21–31. doi: 10.1097/chi.0b013e31815a56f1. [DOI] [PubMed] [Google Scholar]
- 4.The Treatment Episode Data Set (TEDS) [Accessed 1/2012]; http://www.icpsr.umich.edu/icpsrweb/SAMHDA/series/00056.
- 5.Drug Abuse Warning Network [Accessed 1/2012]; http://www.samhsa.gov/data/DAWN.aspx.
- 6.National Survey on Drug Use and Health [Accessed 1/2012]; http://oas.samhsa.gov/nhsda.htm.
- 7.United States Drug Enforcement Administration [Accessed 7/2012];Methamphetamine Lab Incidents 2004-2010. http://www.justice.gov/dea/concern/map_lab_seizures.html.
- 8.Substance Abuse and Mental Health Services Administration. Office of Applied Studies . National Admissions to Substance Abuse Treatment Services, DASIS Series: S-47, DHHS Publication No. (SMA) 09-4379. Rockville, MD: [Accessed 1/2012]. 2009. Treatment Episode Data Set (TEDS) 1997-2007. http://wwwdasis.samhsa.gov/teds07/teds2k7a508web.pdf. [Google Scholar]
- 9.Substance Abuse and Mental Health Services Administration. Office of Applied Studies . DHHS Publication No. SMA 03-3780, DAWN Series D-24. Rockville, MD: [Accessed 1/2012]. 2003. Emergency Department Trends From Drug Abuse Warning Network, Final Estimates 1995-2002. http://www.samhsa.gov/data/driverrprt/dawn2k2/2k4amphetamines.pdf. [Google Scholar]
- 10.Substance Abuse and Mental Health Services Administration. Drug Abuse Warning Network . National Estimates of Drug-Related Emergency Department Visits. Substance Abuse and Mental Health Services Administration; Rockville, MD: [Accessed 7/2012]. 2011. 2009. HHS Publication No. (SMA) 11-4659, DAWN Series D-35. http://www.samhsa.gov/data/2k11/dawn/2k9dawned/html/dawn2k9ed.htm#Sect1.2. [Google Scholar]
- 11.Salo R, Flower K, Kielstein A, et al. Psychiatric comorbidity in methamphetamine dependence. Psychiatry Research. 2011;186:356–361. doi: 10.1016/j.psychres.2010.09.014. [DOI] [PMC free article] [PubMed] [Google Scholar]
- 12.Rounsaville B. Treatment of cocaine dependence and depression. Biol Psychiatry. 2004;56:803–809. doi: 10.1016/j.biopsych.2004.05.009. [DOI] [PubMed] [Google Scholar]
- 13.International Classification of Diseases. World Health Organization; [Accessed 1/2012]. http://www.who.int/classifications/icd/en/ [Google Scholar]
- 14.Substance Abuse and Mental Health Services Administration. Office of Applied Studies [Accessed 1/2012];Treatment Episode Data Set (TEDS): 1996-2006. http://wwwdasis.samhsa.gov/teds06/teds2k6aweb508.pdf.
- 15.Darke S, Kaye S, McKetin R, et al. Major physical and psychological harms of methamphetamine. Drug and Alcohol Review. 2008;27:253–62. doi: 10.1080/09595230801923702. [DOI] [PubMed] [Google Scholar]
- 16.Substance Abuse and Mental Health Services Administration . Summary of National Findings (Office of Applied Studies, NSDUH Series H-38A, HHS Publication No. SMA 10-4856Findings) Rockville, MD: [Accessed 1/2012]. 2010. Results from the 2009 National Survey on Drug Use and Health: Volume I. http://www.samhsa.gov/data/NSDUH/2k9NSDUH/2k9Results.htm. [Google Scholar]
- 17.Substance Abuse and Mental Health Services Administration . Summary of National Findings (Office of Applied Studies, NSDUH Series H-38A, HHS Publication No. SMA 10-4856Findings) Rockville, MD: [Accessed 7/2012]. 2010. Results from the 2009 National Survey on Drug Use and Health: Volume I. http://oas.samhsa.gov/NSDUH/2k9NSDUH/2k9Results.htm. [Google Scholar]
- 18.Combat Methamphetamine Epidemic Act 2005 (Title VII of Public Law 109-177) USA Patriot Improvement and Reauthorization Act of 2005.
- 19.Dluzen D, Liu B. Gender differences in methamphetamine use and responses: A review. Gender Medicine. 2008;5(1):24–35. doi: 10.1016/s1550-8579(08)80005-8. [DOI] [PubMed] [Google Scholar]
- 20.Substance Abuse and Mental Health Services Administration. Office of Applied Studies . The NSDUH Report: Methamphetamine Use. Rockville, MD: [Accessed 1/2012]. Jan 26, 2007. http://www.samhsa.gov/data/2k7/meth/meth.pdf. [Google Scholar]
- 21.Substance Abuse and Mental Health Services Administration. Office of Applied Studies . The DAWN Report: Emergency Department Visits Involving Methamphetamine: 2004 to 2008. Rockville, MD: [Accessed 1/2012]. Aug 24, 2010. http://oas.samhsa.gov/2k10/DAWN017/Meth.htm. [Google Scholar]
- 22.Substance Abuse and Mental Health Services Administration . Results from the 2007 National Survey on Drug Use and Health: National Findings (Office of Applied Studies, NSDUH Series H-34, DHHS Publication No. SMA 08-4343) Rockville, MD: [Accessed 1/2012]. 2008. http://www.samhsa.gov/data/nsduh/2k7nsduh/2k7Results.htm. [Google Scholar]
- 23.Barlow A, Mullany B, Neault N, et al. Examining correlates of methamphetamine and other drug use in pregnant American Indian adolescents. American Indian Alaska Native Mental Health Research. 2010;17(1):1–24. doi: 10.5820/aian.1701.2010.1. [DOI] [PubMed] [Google Scholar]
- 24.National Drug Intelligence Center, U.S. Department of Justice . Indian Country Drug Threat Assessment (Doc. ID 2008-RO958-002) Washington, D.C: [Accessed 1/2012]. 2008. http://www.justice.gov/ndic/pubs28/29239/index.htm. [Google Scholar]
- 25.Testimony of Jefferson Keel, First Vice President, National Congress of American Indians. United States Senate Committee on Indian Affairs; [Accessed 1/2012]. Oversight Hearing on the Problem of Methamphetamine in Indian Country. http://www.indian.senate.gov/public/_files/Keel040506.pdf. [Google Scholar]
- 26.National Methamphetamine Initiative Survey [Accessed 1/2012];The status of the methamphetamine threat and impact on Indian Lands. Prepared for Bureau of Indian Affairs Law Enforcement Services. 2006 Apr 12; http://www.ncai.org/ncai/Meth/BIA_MethSurvey.pdf.
- 27.Katz R. Addressing the health care needs of American Indians and Alaska Natives. Am J Public Health. 2004;94(1):13–14. doi: 10.2105/ajph.94.1.13. [DOI] [PMC free article] [PubMed] [Google Scholar]
- 28.Moulton P, Miller M, Offutt S, et al. Identifying rural health care needs using community conversations. J Rural Health. 2007;23:92–6. doi: 10.1111/j.1748-0361.2006.00074.x. [DOI] [PubMed] [Google Scholar]
- 29.Call K, McAlpine D, Johnson P, et al. Barriers to care among American Indians in public health care programs. Med Care. 2006;44(6):595–600. doi: 10.1097/01.mlr.0000215901.37144.94. [DOI] [PubMed] [Google Scholar]
- 30.Substance Abuse and Mental Health Services Administration. Office of Applied Studies [Accessed 7/2012];SAS output for TEDS admissions by state and year. http://wwwdasis.samhsa.gov/webt/NewMapv1.htm.
- 31.Turnipseed S, Richards J, Kirk J, Diercks D, Amsterdam E. Frequency of acute coronary syndrome in patients presenting to the emergency department with chest pain after methamphetamine use. J Emerg Med. 2003;24(4):369–373. doi: 10.1016/s0736-4679(03)00031-3. [DOI] [PubMed] [Google Scholar]
- 32.Kaye S, McKetin R, Duflou J, Darke S. Methamphetamine and cardiovascular pathology: a review of the evidence. Addiction. 2007;102:1204–1211. doi: 10.1111/j.1360-0443.2007.01874.x. [DOI] [PubMed] [Google Scholar]
- 33.Diercks D, Fonarow G, Kirk J, Jois-Bilowich P, Hollander J, Weber J, et al. Illicit stimulant use in a United States heart failure population presenting to the emergency department (from the acute decompensated heart failure national registry emergency module) Am J Cardiol. 2008;102:1216–1219. doi: 10.1016/j.amjcard.2008.06.045. [DOI] [PubMed] [Google Scholar]
- 34.Wijetunga M, Seto T, Lindsay J, Schatz I. Crystal methamphetamine-associated cardiomyopathy: Tip of the iceberg? J of Toxicology. 2003;41(7):981–986. doi: 10.1081/clt-120026521. [DOI] [PubMed] [Google Scholar]
- 35.Yeo K, Wijetunga M, Ito H, Efird J, Tay K, Seto T, et al. The association of methamphetamine use and cardiomyopathy in young patients. The Am J of Med. 2007;120:165–171. doi: 10.1016/j.amjmed.2006.01.024. [DOI] [PubMed] [Google Scholar]
- 36.Diercks D, Kirk J, Turnipseed S, Amsterdam E. Evaluation of patients with methamphetamine and cocaine-related chest pain in a chest pain observation unit. Crit Pathways in Cardiol. 2007;6:161–164. doi: 10.1097/HPC.0b013e31815991f9. [DOI] [PubMed] [Google Scholar]
- 37.McKetin R, McLaren J, Lubman D, et al. The prevalence of psychotic symptoms among methamphetamine users. Addiction. 2006;101:1473–1478. doi: 10.1111/j.1360-0443.2006.01496.x. [DOI] [PubMed] [Google Scholar]
- 38.Zweben J, Cohen J, Christian D, et al. Psychiatric symptoms in methamphetamine users. American Journal of Addiction. 2004;13:181–190. doi: 10.1080/10550490490436055. [DOI] [PubMed] [Google Scholar]
- 39.Glasner-Edwards S, Marinelli-Casey P, Hillhouse M, et al. Depression among methamphetamine users: Association with outcomes from the Methamphetamine Treatment Project at 3-year follow up. 2009;197:225–231. doi: 10.1097/NMD.0b013e31819db6fe. [DOI] [PMC free article] [PubMed] [Google Scholar]
- 40.Yen CF, Chong MY. Comorbid psychiatric disorders, sex, and methamphetamine use in adolescents: a case-control study. Comprehensive Psychiatry. 2006;47:215–220. doi: 10.1016/j.comppsych.2005.07.006. [DOI] [PubMed] [Google Scholar]
- 41.US Department of Justice National Drug Intelligence Center [Accessed 7/2012];National Methamphetamine Threat Assessment. 2010 Product No. 2010-Q0317-004. http://s3.amazonaws.com/nytdocs/docs/374/374.pdf.
- 42.Update: The changing landscape of the methamphetamine epidemic. Carnevale Associates LLC; [Accessed 7/2012]. Mar, 2011. The Current Status of the Methamphetamine Epidemic. http://www.wicomicohealth.org/files/0/0/the_current_status_of_the_methamphetamine_epidemic-2011.pdf. [Google Scholar]