Abstract
A growing interest in redox-active compounds as therapeutics for oxidative stress-related diseases led to the design of metalloporphyrins as some of the most potent functional SOD-mimics. Herein we report the detailed electrochemical study of the protolytic and redox equilibria of manganese ortho and meta substituted N-ethylpyridyl porphyrins (MnPs), MnTE-2-PyP5+ and MnTE-3-PyP5+, in aqueous solutions. Electrochemical parameters of redox processes for all experimentally available species have been determined, as well as their diffusion coefficients and estimated sizes of aqueous cavities. The results indicate that possible change of the intracellular acidity cannot affect the antioxidant activity of MnPs in vivo, since no change in the E0′app (MnIIIP/MnIIP) values was observed below pH 10. Furthermore, the results confirm that both of these MnPs can be efficient redox scavengers of peroxynitrite (ONOO−), another major damaging species in vivo. This can occur by either the single-electron reduction or the two-electron reduction of ONOO−, involving either the MnIVP/MnIIIP redox couple or MnIVP/MnIIP redox couple. In addition to kred(ONOO−) reported previously, the thermodynamic parameters calculated herein imply a strong and identical driving force for the reaction of both ortho and meta isomeric MnPs with ONOO−. An enlargement of both MnIIIP complexes upon increase of the solution pH was also observed and attributed to the reduction of positive charge on the central ion caused by the deprotonation of the axial water molecules. This expansion of aqueous cavities suggests the formation of a solvent cage and the increased lipophilicity of MnIIIP complexes caused by increased electron density on the Mn ion.
INTRODUCTION
In recent years there has been considerable interest in the research of cellular oxidative stress which is a condition of imbalance between the metabolic production of reactive oxygen and nitrogen species (ROS and RNS, respectively) causing damage to cellular components (lipids, proteins and nucleic acids) and the cellular ability to scavenge the reactive metabolites or repair the incurred damage. The molecular species implicated in the oxidative stress are the superoxide anion (O2•−), peroxynitrite (ONOO−), the hydroxyl radical (OH•), etc. A schematic representation of the reactions involved in the cellular oxidative stress is given in Figure S1. An effective cellular defence from the O2•− exists in the class of superoxide-dismutase enzymes (SOD). SOD-deficiency is linked to numerous pathological conditions, including diabetes, pulmonary, cardiovascular and degenerative diseases, as well as carcinogenesis.1–3 An optimal dismuting ability of a compound is expected when the formal reduction potential is midway between the single-electron formal reduction potentials for oxygen (E0′ = − 0.16 V vs. NHE) and superoxide (E0′ = + 0.89 V vs. NHE),4–5 providing a similar driving force for both half-reactions of the dismutation cycle. This is indeed the case with the SOD enzymes,6 but also with several manganese porphyrins (MnPs) that proved to be robust redox catalysts due to their unique electronic properties and the accessibility of several oxidation states of manganese.7–10
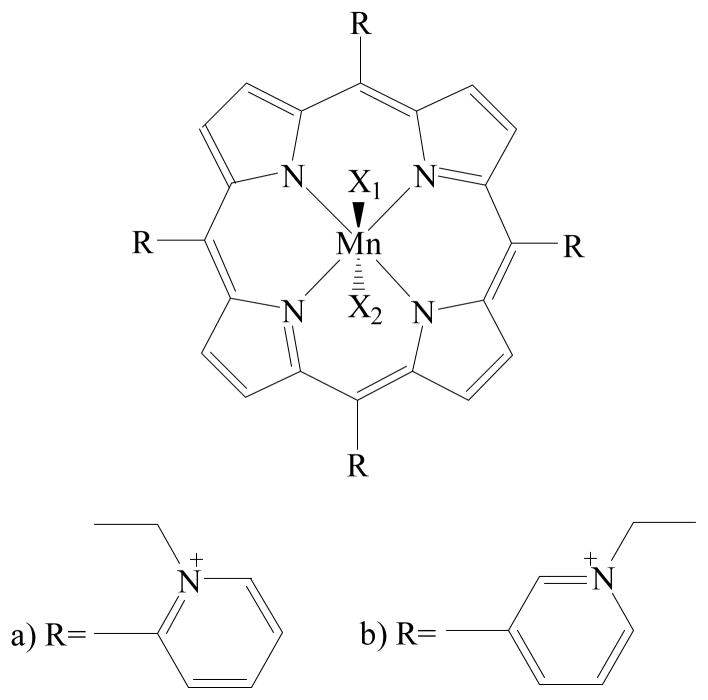
A structure-activity relationship (SAR) established for MnPs, relating the metal-centred reduction potential (E1/2) and the catalytic rate constant for the O2•− dismutation (log kcat), led to the design of some of the most potent functional SOD-mimics described so far.11–18 The formal reduction potential of manganese ortho tetrakis(N-ethylpyridinium-2-yl)porphyrin (MnTE-2-PyP, Figure 1a), bearing ortho cationic aromatic heterocyclic groups, is close to the potential of the SOD enzyme itself, which in turn results in excellent SOD-like activity, both in vitro and in vivo.14–15, 19 Moreover, the increased lipophilicity and rotational flexibility of the more recently synthesized isomer, Mn meta tetrakis(N-ethylpyridinium-3-yl)porphyrin (MnTE-3-PyP, Figure 1b),20 resulted in an increased cellular uptake. Considering that these compounds are able to equally efficiently dismute O2•− and also reduce ONOO− or CO3•−,21–22 their application under pathological conditions could help alleviate oxidative stress and reduce cellular damage. A reactivity scheme of MnPs in the presence of cellular reductants in aqueous solutions is given in Figure S2.14, 22–31
Figure 1.
a) Manganese ortho tetrakis(N-ethylpyridinium-2-yl)porphyrin ≡ MnTE-2-PyP, b) Manganese meta tetrakis(N-ethylpyridinium-3-yl)porphyrin ≡ MnTE-3-PyP. X1 and X2 stand for the aqua, hydroxo, or/and oxo ligand(s), with X2 not necessarily included. Charges are omitted throughout the text for clarity.
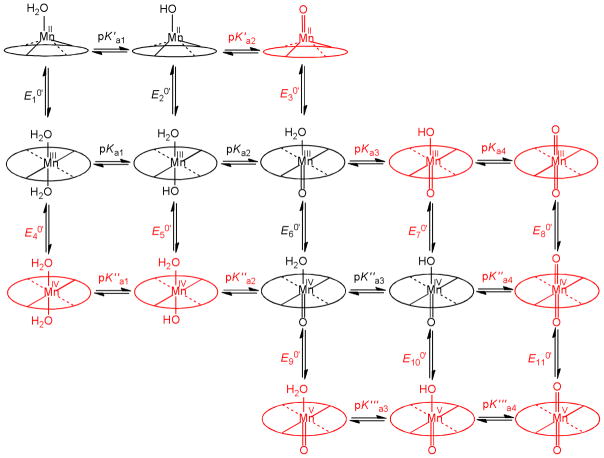
The axial coordination of the central metal ion is crucial for understanding the reactivity of MnPs. In an aqueous solution MnPs can axially coordinate water molecules, which, depending on the manganese oxidation state and pH, can deprotonate to hydroxo- and/or oxo-ligands.33–34 We have recently proposed a scheme of the speciation of MnII–IVTE-2-PyP and MnII–IVTE-3-PyP in a broad pH range (Figure 2).32 These equilibria can have a profound influence on the redox activity and the corresponding biological effects of metalloporphyrins, as evidenced in a recent study,35 where the reduced electron-deficiency of the metal site in (OH)(H2O)FePs vs. (H2O)2MnPs at physiological conditions resulted in vastly different SARs for a series of isomeric N-alkylpyridyl Fe and Mn porphyrins. As the scheme in Figure 2 is meant to be general, the corresponding Mn(V) species were included in order to account for the species of N-methylpyridyl isomers characterised in the modelling of haloperoxidases.36–39
Figure 2.
Equilibria describing the observed behaviour of MnPs in aqueous solutions.32 The experimentally unavailable species and related thermodynamic parameters are coloured red.
Herein we report the detailed electrochemical study of the protolytic and redox equilibria of Mn(II)–(IV) porphyrins in aqueous solutions. Electrochemical parameters of redox processes for all the experimentally available species have been determined, including their diffusion coefficients and the estimated sizes of aqueous cavities. The thermodynamic parameters for the reaction of both ortho and meta isomeric Mn porphyrins with peroxynitrite have been calculated as well.
EXPERIMENTAL
Throughout the experiments, the water used was double-distilled in an all-glass apparatus and the highest purity chemicals were used. The investigated metalloporphyrins, MnIIITE-2-PyPCl5 and MnIIITE-3-PyPCl5, were synthesized according to the published procedures.14, 20 Stock solutions of MnPs were prepared by dissolution of solid substances in the double-distilled water. Buffers used for the working solutions were prepared from Na2B4O7 × 10H2O (Riedel-de Haën), CAPS (N-cyclohexyl-3-aminopropanesulfonic acid) (Sigma), NaH2PO4 (Merck) and Na2HPO4 × 2H2O (Merck). The pH of the working solutions was adjusted by the addition of standard solutions of HCl or NaOH. The supporting electrolyte in all measurements was 0.1 M NaCl. The final concentrations of MnPs in the working solutions were determined spectrophotometrically from known molar absorbance coefficients (ε455 (MnTE-2-PyP) = 1.38 × 10⁵ M−1 cm−1 and ε462 (MnTE-3-PyP) = 1.55 × 10⁵ M−1 cm−1).9
Cyclic voltammetry (CV) and chronocoulometry (CC) were performed in a BASi VC-5 cell under anaerobic conditions using a three-electrode CH Instruments 600D potentiostat with iR-drop compensation, on-line connected to a PC. The data were treated by CHI software v11.13. The working, reference and auxiliary electrode were a glassy carbon (GC) electrode, the Ag/AgCl standard electrode (3 M NaCl) and a platinum wire, respectively. The GC electrode was polished with an aqueous alumina slurry with particles 0.05 μm in diameter before every experiment and the electrode surface was determined to be A = 0.085 ± 0.010 cm2 by chronocoulometry of a 2 mM solution of K3[Fe(CN)6] in 1 M aqueous KCl.40–42 The pH of aqueous solutions was determined on a Mettler Toledo T70 titrator with Mettler DG-111-SC glass electrode calibrated with the standard buffers pH 4.00, 7.00 and 10.00. The potentials are reported vs. the standard hydrogen electrode (SHE, referring to the hydrogen pressure of 1 bar), unless stated differently. Electrochemical simulations were performed using DigiElch software.43
RESULTS
Cyclic voltammetry of MnTE-2-PyP and MnTE-3-PyP
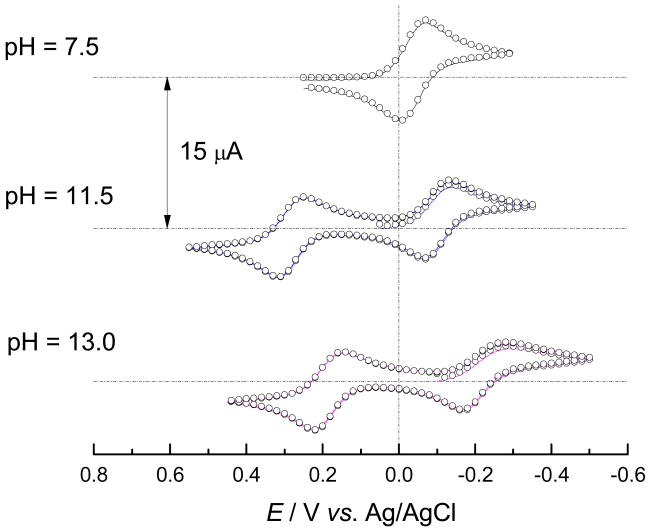
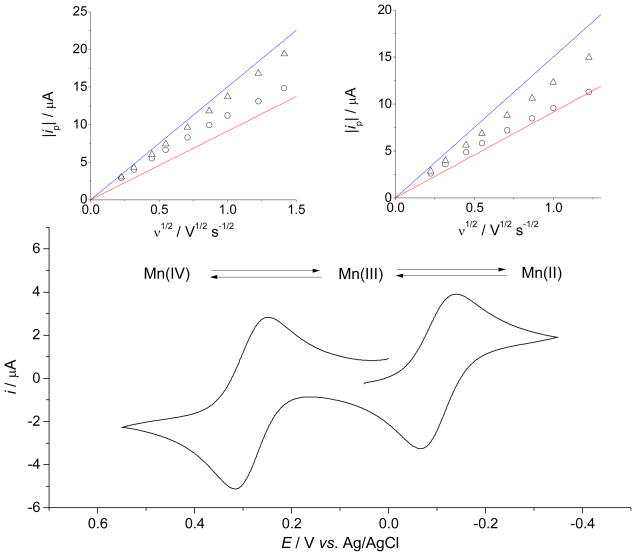
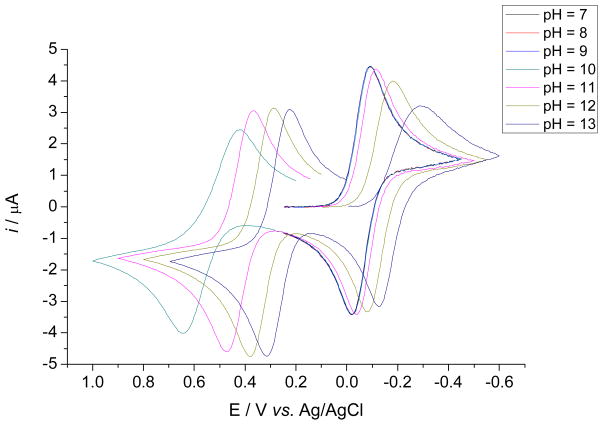
Cyclic voltammograms of the aqueous solutions of MnIIIPs recorded at various pH values and scan rates indicate two distinct electron transfer processes attributed to MnIIIP/MnIIP and MnIVP/MnIIIP redox couples. In neutral and mildly basic media only one pH-independent current peak pair has been observed and has been attributed to MnIIIP/MnIIP electron transfer process (Figures 3 and S3). At pH values above 10 an additional fully developed current peak pair appeared at more positive potentials, corresponding to the MnIVP/MnIIIP redox transition (Figures 3 and S3). The cathodic and anodic current peak potentials, Epc and Epa, of both redox processes shift toward more negative values upon increasing pH of the solution. The cathodic-anodic peak separation, ΔEp = |Epc − Epa|, for both redox processes increases with ν at all values of pH, indicative of a quasi-reversible single-electron transfer. Dependency of peak current, ip, vs. ν1/2 for both redox processes (insets of Figures 4 and S4) clearly demonstrates the transition from approximately reversible electron transfer at low values of ν, to approximately irreversible electron transfer at high values of ν, also characteristic for quasi-reversible electron transfers.
Figure 3.
Dependence of cyclic voltammograms of aqueous solutions of MnTE-2-PyP on pH, ν = 0.1 V s−1, [NaCl] = 0.1 M, θ = 25 °C, (○) simulation in DigiElch. Similar behaviour has been reported previously for methyl and butyl analogues, MnTM-2-PyP and MnTnBu-2-PyP.23, 49 Redox couples shown relate to the MnIIII/MnIIP (right cycle) and the MnIV/MnIII couples (left cycle).
Figure 4.
Cyclic voltammogram of 0.65 mM aqueous solution of MnTE-2-PyP, pH = 11.3, [CAPS] = 50 mM, [NaCl] = 0.1 M, ν = 0.1 V s−1, θ = 25 °C. Inset left: Dependence of |ip| on ν1/2 for the MnIVP/MnIIIP redox transition: ipc (○), ipa (△), Randles-Ševčik equation for the reversible electron transfer (
 ), peak-current equation for the irreversible electron transfer, α = 0.3 (
 ). Inset right: Dependence of |ip| on ν1/2 for the MnIIIP/MnIIP redox transition: ipc (○), ipa (△), Randles-Ševčik equation for the reversible electron transfer (
 ), peak-current equation for the irreversible electron transfer, α = 0.3 (
 ). The value of Dapp obtained by chronocoulometry at the same pH (Table 2) was used for calculation.
Parameters of the recorded cyclic voltammograms were evaluated according to the previously published procedures.44–45 The current peak potentials Epc and Epa were taken directly from the CHI software and used to calculate the half-wave potential, E1/2 = (Epc + Epa)/2. The apparent rates of electron transfer, k0app, were estimated from the polynomial model of dependence of ΔEp on log ψ (Figure S5), assuming that the rigidity of the porphyrin ring prevents a significant difference between the diffusion coefficients of the oxidized and the reduced species (i.e. DO ≈ DR and E1/2 ≈ E0′, according to the expression E1/2 = E0′ + R T/(n F) ln (DR/DO)1/2).46 The parameter ψ is defined as ψ = (DO/DR)α/2 k0app (π DO f ν)−1/2, where DO and DR are the diffusion coefficients of the oxidized and the reduced species, α is the cathodic electron transfer coefficient and f = F/(R T), whereas the ΔEp vs. log ψ couples were obtained from data published by Nicholson.47 The obtained k0app values are the rates of the electron exchange in the condition of E = E0′, i.e. when the rates of both reduction and oxidation reactions have the same value equal to k0app, which represents a measure of the kinetic facility of a redox couple.48 The apparent values of the cathodic electron transfer coefficient, αapp, are a measure of the symmetry of the redox transfer energy barrier,48 and were estimated by simulating the recorded voltammograms using the DigiElch software (a typical simulation is given in Figure S6). A summary of the estimated electrochemical parameters for the MnIIIP/MnIIP and MnIVP/MnIIIP redox couples is given in Table S7.
The obtained results indicate a single-electron reduction of MnIIIPs in a neutral medium, according to eq. (1).
| (1) |
The observed pH-independence of the formal reduction potential and other electrochemical parameters of the MnIIIP/MnIIP redox couple at pH < 10 confirmed that no simultaneous protolysis occurs in the electron transfer process. As the pH value of the solution increases above 10, a negative shift of the observed formal potential can be observed and attributed to the deprotonation of an axial water molecule either at MnIIIP or MnIIP, or both. The cyclic voltammograms recorded at higher pH values of the solutions are the result of the existence of mixtures of various deprotonated species of MnIIIP and MnIIP which behave as simple single-electron transfers whose apparent formal potentials, E0′app, and rates of electron transfer, k0app, are pH-dependent.50–54 Therefore, the observed pH-dependence of voltammograms can be attributed to the protolysis equilibria depicted in Figure 2.
The redox reaction involving the MnIVP/MnIIIP redox couple shows significant dependence on pH. This electron transfer cannot be observed in a neutral medium due to a formal potential more positive than that of water.32 However, the formal potential of the MnIVP/MnIIIP redox couple decreases upon the increase of the pH of the solution resulting in the increased rate of the electron transfer and the development of the well defined peak current couples (Figures 3 and S3). Such a behaviour can be attributed to a single-electron reduction accompanied by simultaneous dissociation of two protons, according to eq. (2).
| (2) |
As the pH value of the solution increases above 10, the formal reduction potential of the MnIVP/MnIIIP redox couple shifts negatively by approximately 120 mV per pH unit which is in excellent agreement with the Nernst equation predicting a shift of −118 mV per pH unit for a two-proton, single-electron oxidation which is thermodynamically favoured in basic media. Further increase of the pH above 12 results in a negative shift of approximately 60 mV per pH unit which is again in excellent agreement with the Nernst equation predicting a shift of −59 mV per pH unit for a single-proton, single-electron reduction given in eq. (3).
| (3) |
Thermodynamics of electroreduction of MnIIITE-2-PyP and MnIIITE-3-PyP
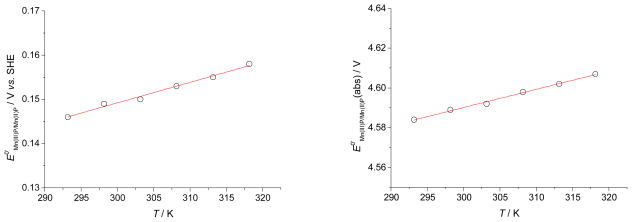
The thermodynamic parameters of the electroreduction of MnIIIP complexes were obtained by measuring the temperature dependence of the cyclic voltammograms of the MnIIIP/MnIIP redox couple (Figure S8). The measurements were performed in the range from 20 °C to 45 °C at pH = 7.5 where the fully protonated species of both MnIIIPs and MnIIPs are dominant in the solution.32 The response of the working electrode was measured vs. the Ag/AgCl reference whose temperature response was previously calibrated vs. the saturated calomel electrode (SCE) under the same experimental conditions. From the known temperature dependence of the SCE potential vs. SHE,55 the temperature dependence of the potential of the Ag/AgCl reference vs. SHE was calculated to be: EAg/AgCl vs. SHE = − 1.72381 × 10⁻⁵ T2 + 0.01013 T − 1.29508, R2 = 0.9948 (Figure S9). It follows that the temperature dependence of the formal reduction potential (E0′ vs. SHE) and the absolute reduction potential (E0′(abs)) for the MnIIIP/MnIIP redox couple can be determined from the known temperature dependence of the potential of the Ag/AgCl reference vs. SHE and the values of E1/2 obtained by cyclic voltammetry, again assuming DO ≈ DR and E1/2 ≈ E0′ (Figures 5 and S10). The absolute formal reduction potential was calculated according to eq. (4), where θ is the experimental temperature in °C and is the absolute entropy change of the standard hydrogen electrode reaction.56–57 Finally, the thermodynamic parameters of electroreduction of MnIIIPs were calculated as ΔS0′ = (n F ΔE0′)/ΔT and ΔH0′ = −n F E0′ − TΔS0′ and are given in Table 1.
Figure 5.
The temperature dependence of the formal reduction potential (left, E0′ vs. SHE) and the absolute reduction potential (right, E0′ (abs)) of MnIIIP/MnIIP redox couple of MnTE-2-PyP: [MnTE-2-PyP] = 0.65 mM, pH = 7.5, [NaH2PO4] = 50 mM, [NaCl] = 0.1 M.
Table 1.
The thermodynamic parameters of the electroreduction of MnIIIP complexes calculated from temperature dependencies of the formal reduction potentials (E0′ vs. SHE) and the absolute reduction potentials (E0′ (abs)): pH = 7.5, [NaH2PO4] = 50 mM, [NaCl] = 0.1 M.
| MnP | ΔH0′ ± σ/kJ mol−1 | ΔS0′ ± σ/J K−1 mol−1 | ΔH0′ (abs) ± σ/kJ mol−1 | ΔS0′ (abs) ± σ/J K−1 mol−1 |
|---|---|---|---|---|
| MnTE-2-PyP | −29 ± 1 | 48 ± 3 | −469 ± 2 | 88 ± 7 |
| MnTE-3-PyP | −29 ± 6 | 106 ± 19 | −468 ± 6 | 145 ± 12 |
| (4) |
Chronocoulometry of the electroreduction of MnIIITE-2-PyP and MnIIITE-3-PyP
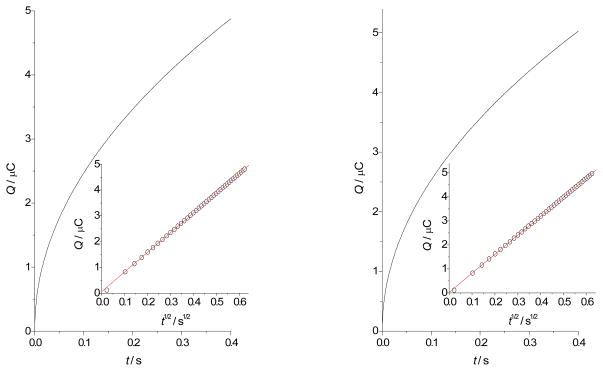
Chronocoulometric measurements in the duration of tmax = 0.4 s were performed at various pH values in the same solutions and under the same conditions as the CV. The values of the first step potential, E1, and the second step potential, E2, were selected to be approximately 200 mV more positive and approximately 300 mV more negative than the formal potentials of the MnIIIP/MnIIP couples, respectively, as determined by the simulations of CV measurements (Table S7). Typical chronocoulograms of aqueous solutions of MnPs are shown in Figure 6. The apparent diffusion coefficients of MnIIIPs, Dapp, were calculated from the slopes, ΔQ/Δt1/2, of the background-corrected Anson plots58–59 obtained directly from the CHI software (typical Anson plots are shown in the insets of Figure 6). Additionally, the apparent radii of aqueous cavities of MnIIIPs were calculated according to the known Stokes-Einstein relation, rapp = kB T/(6 π η Dapp), where kB is the Boltzmann constant and η = 0.899 × 10⁻³ kg m−1 s−1 is the viscosity of 0.1 M aqueous solution of NaCl.60–62 The results of chronocoulometric measurement of the electroreduction of MnIIIPs are given in Table 2.
Figure 6.
Chronocoulometry of MnP complexes in aqueous solutions, left: [MnTE-2-PyP] = 0.54 mM, pH = 7.5, [NaH2PO4] = 50 mM, [NaCl] = 0.1 M, θ = 25 °C, E1 = 0.2 V, E2 = −0.35 V, tmax = 0.4 s. Inset left: Anson plot of the observed dependence of the charge Q vs. t1/2, right: [MnTE-3-PyP] = 0.52 mM, pH = 12.3, [Na2HPO4] = 50 mM, [NaCl] = 0.1 M, θ = 25 °C, E1 = 0 V, E2 = −0.55 V, tmax = 0.4 s. Inset right: Anson plot of the observed dependence of the charge Q vs. t1/2.
Table 2.
The results of chronocoulometric measurement of the electroreduction of MnIIITE-2-PyP and MnIIITE-3-PyP, [NaCl] = 0.1 M, θ = 25 °C.
| MnP | pH | (Dapp ± σ)/10−6 cm2 s−1 | (rapp ± σ)/Å |
|---|---|---|---|
| MnTE-2-PyP | 7.5 | 2.35 ± 0.05 | 10.3 ± 0.2 |
| 11.3 | 2.16 ± 0.05 | 11.2 ± 0.3 | |
| 13.0 | 1.85 ± 0.04 | 13.1 ± 0.3 | |
| MnTE-3-PyP | 7.5 | 2.15 ± 0.05 | 11.3 ± 0.3 |
| 12.3 | 2.00 ± 0.05 | 12.1 ± 0.3 | |
| 13.2 | 1.78 ± 0.04 | 13.6 ± 0.3 |
DISCUSSION
The electrochemical behaviour of 0.5 mM solutions of MnPs in the range of pH values from 7 to 13 was successfully simulated according to the scheme shown in Figure 2. The previously published values of the experimentally available deprotonation constants and formal reduction potentials E10′ and E60′ were used for the simulations,32 as well as the values of αapp and k0app from Table S7. The experimentally unavailable deprotonation constants were taken to be at least one pH unit beyond the studied pH range (pK′a2 = 14, pKa3 = 14, pKa4 = 15, pK″a1 = 5, pK″a2 = 6, pK″a4 = 14). These values were used for all simulations and expressions below. Other parameters used in the simulations were the reported value of the diffusion coefficient of H+(aq), DH+ = 9.3 × 10⁻⁵ cm2 s−1,63 the electrode surface area A = 0.085 cm2 and the rates of the protonation reactions estimated as kp = 1010 dm3 mol−1 s−1.64 The results of these simulations are shown in Figures 7 and S11.
Figure 7.
Simulation of the electrochemical behaviour of a 0.5 mM solution of MnTE-2-PyP in the range of pH values form 7 to 13.
The appropriate Nernst equation for the pH-dependent apparent formal reduction potentials of the MnIIIP/MnIIP redox couple, E0′app (MnIIIP/MnIIP), at 25 °C according to the scheme shown in Figure 2 is given in eq. (5), where E10′ is the formal reduction potential of the fully protonated species of the MnIIIP/MnIIP redox couple, and the values of fX are given by the eqs. (6) and (7).65
| (5) |
| (6) |
| (7) |
Considering that the value of E40′ is not experimentally accessible, the pH-dependent formal reduction potential of the MnIVP/MnIIIP redox couples can be expressed relative to the formal reduction potential E60′, determined by the oxidation of MnIIIPs with octacyanomolybdate (E60′ = + 0.578 V vs. SHE and E60′ = + 0.479 V vs. SHE for MnTE-2-PyP and MnTE-3-PyP, respectively).32 Therefore, the E0′app (MnIVP/MnIIIP) is given by eq. (8), where the values of fX are given by eqs. (9) and (10).
| (8) |
| (9) |
| (10) |
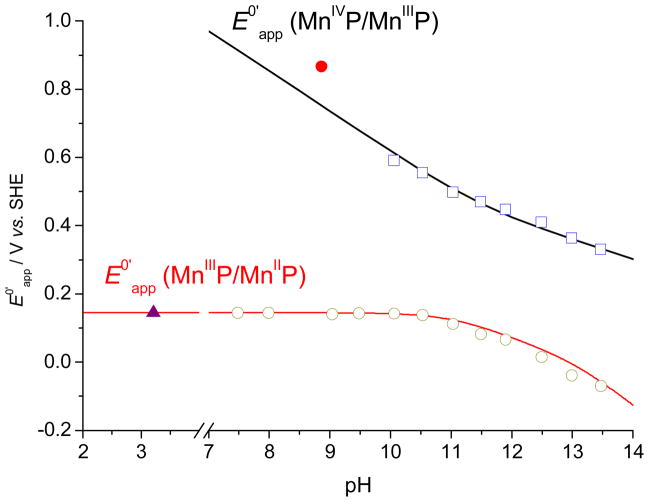
The E0′app values of the MnIIIP/MnIIP and MnIVP/MnIIIP redox couples, simulated by eqs. (5) and (8), compare reasonably well with the previously published values determined spectrophotometrically32 and the values presented in this paper, as shown in Figures 8 and S12 (the values of the experimentally unavailable deprotonation constants were the same as the simulations shown in Figures 7 and S11). The most significant deviation can be observed for the values of E0′app (MnIVP/MnIIIP) determined by oxidation of MnIIIP with octacyanomolybdate,32 which is most likely related to the complex photolytic and hydrolytic reactions of octacyanomolybdate,66 shifting the octacyanomolybdate(V/IV) equilibrium during spectrophotometric titrations and consequently shifting the apparent formal potential to more positive values. Shifting the values of E60′ from ref. 32 by approximately −100 mV (Table 3) for both MnTE-2-PyP and MnTE-3-PyP yielded good simulations of CV data (Figures 8 and S12). Other small deviations from the simulated curves can be attributed to the differences in the ionic media used for the electrochemical measurements presented here and the spectrophotometric determinations of the deprotonation constants32 (0.1 M NaCl and 2 M NaClO4, respectively), because it was shown that the deprotonations of the axial water molecules exhibit a strong dependence on the ionic strength of the solution.49
Figure 8.
Comparison of the pH-dependent apparent formal reduction potentials, E0′app, of the MnIIIP/MnIIP and MnIVP/MnIIIP redox couples of MnTE-2-PyP, simulated by eqs. (5) and (8) with various experimental values: (
 ) oxidation of MnIIIP with octacyanomolybdate (ref. 32), (
 ) cyclic voltammetry of the MnIVP/MnIIIP redox couple (Table S7), (
 ) reduction of MnIIIP with ascorbate (ref. 32) and (○) cyclic voltammetry of the MnIIIP/MnIIP redox couple (Table S7).
Table 3.
Electrochemical parameters for the reduction of the experimentally accessible species of MnP complexes, [NaCl] = 0.1 M, θ = 25 °C. Values of the deprotonation constants were taken from ref. 32: pK′a1 = 11.75, pKa1 = 10.89, pKa2 = 11.62, pK″a3 = 11.14 for MnTE-2-PyP and pK′a1 = 12.04, pKa1 = 11.57, pKa2 = 12.70 and pK″a3 = 11.99 for MnTE-3-PyP. As previously in Figures 7, 8, S11 and S12, the experimentally unavailable deprotonation constants were taken to be at least one pH unit beyond the studied pH range, i.e. pK′a2 = 14, pKa3 = 14, pKa4 = 15, pK″a1 = 5, pK″a2 = 6, pK″a4 = 14.
| MnP | couple | index | Ei0′/V vs. SHE* | ki0/10−2 cm s−1 | αi |
|---|---|---|---|---|---|
| MnTE-2-PyP | MnIIIP/MnIIP | 1 | 0.145 | 0.3 | 0.4 |
| 2 | 0.094 | 0.7 | 0.3 | ||
| 3 | ≤ −0.046 | ≤ 0.3 | 0.3 | ||
| MnIVP/MnIIIP | 5 | ≥ 0.812 | 1.0 | 0.3 | |
| 6 | 0.470 | 1.3 | 0.3 | ||
| 7 | ≤ 0.301 | ≤ 1.6 | 0.4 | ||
| MnTE-3-PyP | MnIIIP/MnIIP | 1 | −0.020 | 0.4 | 0.4 |
| 2 | −0.045 | 0.8 | 0.3 | ||
| 3 | ≤ −0.121 | ≤ 0.3 | 0.3 | ||
| MnIVP/MnIIIP | 5 | ≥ 0.779 | 1.0 | 0.3 | |
| 6 | 0.390 | 1.3 | 0.3 | ||
| 7 | ≤ 0.271 | ≤ 1.4 | 0.4 |
The calculated values differ somewhat from the previously published potentials determined by cyclic voltammetry,24 due to the differences in methodology and electrode calibration. Yet, importantly, the differences in the formal reduction potentials among the studied members of Mn(III) N-alkylpyridylporphyrin series are correct and thus all relationships based on these differences are correct as well.
A further deviation can be observed for the value of E0′app (MnIIIP/MnIIP) of MnTE-3-PyP determined by the reduction of MnIIIP with ascorbate and the values determined electrochemically (Figure S12). The extent of this deviation cannot be attributed solely to the difference in ionic strength, since no proton exchange occurs upon the reduction of the MnIIIP at pH values below 10 where the fully protonated species of MnIIIP and MnIIP are dominant in the solution (i.e. E0′app (MnIIIP/MnIIP) = E10′ in the scheme shown in Figure 2). However, the dehydroascorbic acid produced by the reduction of MnIIIP is likely to decompose to some extent in this range of pH67 (even though special care was taken to eliminate this during experiments32), thus shifting the ascorbate/dehydroascorbic acid equilibrium and consequently shifting the apparent formal potential of the ascorbic acid to more positive values.
Following the procedure outlined by Laviron,54 a general expression describing the pH-dependence of k0app (MnIIIP/MnIIP) for the electron transfer involving two deprotonations of the oxidized and the reduced species (six-member ladder scheme) can be derived. The expression is given in eqs. (11)–(13), where Ka1 and Ka2 are the deprotonation constants of the MnIIIP species, K′a1 and K′a2 are the deprotonation constants of the MnIIP species, whereas kX0 and αX are the heterogeneous electron exchange rates and transfer coefficients, respectively, of redox processes characterized by the formal potentials E10′, E20′ and E30′ in Figure 2.
| (11) |
| (12) |
| (13) |
The apparent heterogeneous electron transfer rates of the MnIIIP/MnIIP couples first increase upon their deprotonation, and then decrease again upon further increase of pH. The increase of k0app for the mono-deprotonated MnIIIP/MnIIP couple is surprising, considering the reduced overall positive charge of the complex and the lower formal reduction potential, which might be indicative of a concerted proton-electron transfer.68 The MnIIIP/MnIIP electron transfers of both complexes are characterized by the apparent cathodic transfer coefficients αapp < 0.5 at all pH values, which is indicative of an asymmetric potential-energy function for the transition state, meaning that the activated complexes of both redox processes have predominantly the structure of the oxidized species because the change of the potential on the working electrode exhibits greater influence on the reduction activation energy, ΔGc‡.69 This could be the result of a change of the complex geometries from an octahedral to a near square pyramidal upon the reduction of MnIIIPs, since the MnIIPs coordinate only one axial water molecule because of an increase of the manganese ion radius.34 Similar results were also previously reported for the n-butyl isomer of the same series, MnTnBu-2-PyP (the calculated values of Ei0′ for all experimentally available species are given in Table S13, for comparison with Table 3).49
A general expression, similar to eq. (11), describing the pH-dependence of k0app (MnIVP/MnIIIP) in the range of pH values from 10 to 13 is given in eqs. (14)–(16), where K″X are the deprotonation constants of the MnIVP species, KX are the deprotonation constants of the MnIIIP species, kX0 and αX are the heterogeneous electron transfer rates and coefficients, respectively, of redox processes characterized by the formal potentials E50′, E60′ and E70′ in Figure 2. The values of fX are given by eqs. (9) and (10).
| (14) |
| (15) |
| (16) |
The values of k0app observed for the MnIVP/MnIIIP couples first begin to increase with the increase of the pH of the solution, in agreement with the redox equilibrium given by eq. (2) and the stabilization of the oxidation product upon the increase of pH. Further increase of the pH of the solution leads to a decrease of the k0app values as the redox equilibrium given by eq. (3) becomes dominant in the solution due to the deprotonation of the MnP species. The changes in the electron transfer rates for the MnIVP/MnIIIP couples are of similar magnitude for both isomers, but the electron transfer of the meta isomer is slightly more rapid, most probably due to its structural flexibility facilitating the approach of the redox-active site to the surface of the electrode.
Despite the fact that the ortho ethyl substitution of the pyridyl moiety in tetrakis(N-ethylpyridinium-2-yl)porphyrin yields somewhat bulkier porphyrin than the analogous meta substitution,70 a 1-Å larger average radius of the diaqua MnIIITE-3-PyP (rapp = 11.3 Å) relative to the diaqua MnIIITE-2-PyP (rapp = 10.3 Å) is observed (Table 4). This could indicate that the measured radii of the complexes are actually more closely related to the distances between the central Mn(III) ion and the terminal ethyl hydrogen atoms, the distances that are expected to be larger in meta than ortho isomers. In turn one could also speculate that the complex ions are attached to the electrode surface through the axially coordinated water molecule, since the obtained radius is related to the equatorial area of each complex. A slightly higher value of the obtained diffusion coefficient of the ortho than meta MnP isomer (Dapp = 2.35 × 10⁻⁶ cm2 s−1 vs. Dapp = 2.15 × 10⁻⁶ cm2 s−1 at pH = 7.5, respectively) is presumably caused by a weaker hydration of the former isomer due to its increased bulkiness.
Table 4.
Diffusion coefficients and apparent radii of aqueous cavities of the protonated, mono-deprotonated and di-deprotonated species of MnIIIP complexes, [NaCl] = 0.1 M, θ = 25 °C. Values of the deprotonation constants were taken as in Table 3.
| MnP | couple | index | DO/10−6 cm2 s−1 | rO/Å |
|---|---|---|---|---|
| MnTE-2-PyP | MnIIIP/MnIIP | 1 | 2.35 | 10.3 |
| 2 | 2.24 | 10.8 | ||
| 3 | ≤ 1.83 | ≥ 13.2 | ||
| MnTE-3-PyP | MnIIIP/MnIIP | 1 | 2.15 | 11.3 |
| 2 | 2.10 | 11.6 | ||
| 3 | ≤ 1.68 | ≥ 14.5 |
The obtained chronocoulometric results indicate an enlargement of both MnIIIP complexes at the electrode surface (an increase of rapp) upon increase of the solution pH, which can be attributed to the reduction of positive charge on the central ion caused by the deprotonation of the axial water molecules. This is indicative of the expansion of their aqueous cavities in bulk aqueous medium (this model treats the solvent as a high-dielectric continuum, interacting with charges that are embedded in a spherical cavity of lower dielectric),71–73 whereas the formation of a solvent cage causes their reduced mobility.74 Such finding is in agreement with a previous study on the lipophilicity of MnPs, wherein the loss of a single charge on cationic MnPs upon reduction with ascorbate increases their lipophilicity (and in turn their bioavailability) up to 3 orders of magnitude.75
The expressions for the pH-dependence of Dapp values of MnIIIPs are given in eqs. (17) and (18), where H2A, HA− and A2− denote the protonated, mono-deprotonated and di-deprotonated species of MnIIIP complexes.76 Solving the systems of these equations with known MnIIIP deprotonation constants32 yielded the values of DO and rO given in Table 4.
| (17) |
| (18) |
In conclusion, regarding the antioxidant therapeutic potential of the investigated metalloporphyrins, the results reported in this work undoubtedly demonstrate that below pH 10 there is no change in the E0′app (MnIIIP/MnIIP) values, indicating that possible change of the intracellular acidity cannot affect the antioxidant activity of MnPs in vivo. Furthermore, we have calculated the thermodynamic parameters that support the reactivity of both MnPs studied herein as efficient scavengers of peroxynitrite in a neutral aqueous medium. This reaction occurs either by the single-electron reaction involving the MnIVP/MnIIIP redox couple (kred(MnTE-2-PyP, 37 °C) = 3 × 10⁷ M−1 s−1), or the two-electron reaction involving the MnIVP/MnIIP redox couple (kred(MnTE-2-PyP, 37 °C) > 107 M−1 s−1).22 In the latter case, the first step is the reduction of MnIIIP with cellular reductants, O2•−, or protein thiols (Figure S2). 22, 27, 29–30, 77 The corresponding formal potentials for the reduction of MnPs, E0′ (MnIVP/MnIIIP) and E0′ (MnIVP/MnIIP) in a neutral aqueous medium can be calculated as 0.980 V and 0.563 V vs. SHE for MnTE-2-PyP and 0.993 V and 0.487 V vs. SHE for MnTE-3-PyP, respectively (Table S14). The related formal potentials for single-electron and two-electron reductions of ONOO− are E0′ (ONOO−/NO2•) = 1.6V and E0′ (ONOO−/NO2−) = 1.3 V,78 resulting in driving forces of approximately 0.6 V and for the single-electron reduction, and 0.75 V for the two-electron reduction of ONOO−. This would at least thermodynamically favour the two- over the single-electron reduction of this biologically devastating anion, thus favouring the production of the benign nitrite, NO2−, as opposed to the production of the toxic nitrogen dioxide radical, NO2•.
Supplementary Material
Acknowledgments
The authors are thankful to the Croatian Ministry of Science (MZOŠ grant: 006-0061247-0009) and to Duke University’s CTSA grant 1 UL 1 RR024128-01 from NCRR/NIH for their financial support.
Footnotes
Dedicated to the memory of Ivan Kos, our dear friend and colleague.
References
- 1.Lahaye D, Muthukumaran K, Hung CH, Gryko D, Reboucas JS, Spasojevic I, Batinic-Haberle I, Lindsey JS. Bioorganic & Medicinal Chemistry. 2007;15:7066–7086. doi: 10.1016/j.bmc.2007.07.015. [DOI] [PMC free article] [PubMed] [Google Scholar]
- 2.Salvemini D, Riley DP, Cuzzocrea S. Nature Reviews Drug Discovery. 2002;1:367–374. doi: 10.1038/nrd796. [DOI] [PubMed] [Google Scholar]
- 3.Szabó C, Ischiropoulos H, Radi R. Nature Reviews Drug Discovery. 2007;6:662–680. doi: 10.1038/nrd2222. [DOI] [PubMed] [Google Scholar]
- 4.Wood PM. Biochemical Journal. 1988;253:287–289. doi: 10.1042/bj2530287. [DOI] [PMC free article] [PubMed] [Google Scholar]
- 5.Sawyer DT, Valentine JS. Accounts of Chemical Research. 1981;14:393–400. [Google Scholar]
- 6.Vance CK, Miller AF. Biochemistry. 1998;37:5518–5527. doi: 10.1021/bi972580r. [DOI] [PubMed] [Google Scholar]
- 7.Batinic-Haberle I, Rajic Z, Tovmasyan A, Reboucas JS, Ye X, Leong KW, Dewhirst MW, Vujaskovic Z, Benov L, Spasojevic I. Free Radical Biology and Medicine. 2011;51:1035–1053. doi: 10.1016/j.freeradbiomed.2011.04.046. [DOI] [PMC free article] [PubMed] [Google Scholar]
- 8.Batinić-Haberle I, Rebouças JS, Spasojević I. Antioxid Redox Signal. 2010;13:877–918. doi: 10.1089/ars.2009.2876. [DOI] [PMC free article] [PubMed] [Google Scholar]
- 9.Batinic-Haberle I, Reboucas JS, Benov L, Spasojevic I. In: Handbook of Porphyrin Science. Kadish KM, Smith KM, Guillard R, editors. 11–15. World Scientific; Singapore: 2011. pp. 291–393. [Google Scholar]
- 10.Batinić-Haberle I, Spasojević I, Tse HM, Tovmasyan A, Rajić Z, Clair DKS, Vujasković Ž, Dewhirst MW, Piganelli JD. Amino Acids. 2012;42:95–113. doi: 10.1007/s00726-010-0603-6. [DOI] [PMC free article] [PubMed] [Google Scholar]
- 11.Spasojević I, Chen Y, Noel TJ, Yu Y, Cole MP, Zhang L, Zhao Y, StClair DK, Batinić-Haberle I. Free Radical Biology and Medicine. 2007;42:1193–1200. doi: 10.1016/j.freeradbiomed.2007.01.019. [DOI] [PMC free article] [PubMed] [Google Scholar]
- 12.Batinić-Haberle I, Spasojević I, Stevens RD, Bondurant B, Okado-Matsumoto A, Fridovich I, Vujaković Ž, Dewhirst MW. Dalton Transactions. 2006:617–624. doi: 10.1039/b513761f. [DOI] [PubMed] [Google Scholar]
- 13.Spasojević I, Batinić-Haberle I, Rebouças JS, Idemori YM, Fridovich I. Journal of Biological Chemistry. 2003;278:6831–6837. doi: 10.1074/jbc.M211346200. [DOI] [PubMed] [Google Scholar]
- 14.Batinić-Haberle I, Spasojević I, Hambright P, Benov L, Crumbliss AL, Fridovich I. Inorganic Chemistry. 1999;38:4011–4022. [Google Scholar]
- 15.Saba H, Batinic-Haberle I, Munusamy S, Mitchell T, Lichti C, Megyesi J, MacMillan-Crow LA. Free Radical Biology and Medicine. 2007;42:1571–1578. doi: 10.1016/j.freeradbiomed.2007.02.016. [DOI] [PMC free article] [PubMed] [Google Scholar]
- 16.Miriyala S, Spasojevic I, Tovmasyan A, Salvemini D, Vujaskovic Z, StClair D, Batinic-Haberle I. Biochimica et Biophysica Acta (BBA) - Molecular Basis of Disease. 2012;1822:794–814. doi: 10.1016/j.bbadis.2011.12.002. [DOI] [PMC free article] [PubMed] [Google Scholar]
- 17.Tovmasyan A, Sheng H, Weitner T, Arulpragasam A, Lu M, Warner DS, Vujaskovic Z, Spasojevic I, Batinic-Haberle I. Medical Principles and Practice. 2013;22:103–130. doi: 10.1159/000341715. [DOI] [PMC free article] [PubMed] [Google Scholar]
- 18.Rebouças JS, DeFreitas-Silva G, Spasojevic I, Idemori YM, Benov L, Batinic-Haberle I. Free Radical Biology and Medicine. 2008;45:201–210. doi: 10.1016/j.freeradbiomed.2008.04.009. [DOI] [PMC free article] [PubMed] [Google Scholar]
- 19.Zhao Y, Chaiswing L, Velez JM, Batinic-Haberle I, Colburn NH, Oberley TD, StClair DK. Cancer Research. 2005;65:3745–3750. doi: 10.1158/0008-5472.CAN-04-3835. [DOI] [PubMed] [Google Scholar]
- 20.Kos I, Benov L, Spasojevic I, Reboucas JS, Batinic-Haberle I. Journal of Medicinal Chemistry. 2009;52:7868–7872. doi: 10.1021/jm900576g. [DOI] [PMC free article] [PubMed] [Google Scholar]
- 21.Lee J, Hunt JA, Groves JT. Journal of the American Chemical Society. 1998;120:6053–6061. [Google Scholar]
- 22.Ferrer-Sueta G, Vitturi D, Batinic-Haberle I, Fridovich I, Goldstein S, Czapski G, Radi R. Journal of Biological Chemistry. 2003;278:27432–27438. doi: 10.1074/jbc.M213302200. [DOI] [PubMed] [Google Scholar]
- 23.Ferrer-Sueta G, Batinić-Haberle I, Spasojević I, Fridovich I, Radi R. Chemical Research in Toxicology. 1999;12:442–449. doi: 10.1021/tx980245d. [DOI] [PubMed] [Google Scholar]
- 24.Batinić-Haberle I, Spasojević I, Stevens RD, Hambright P, Fridovich I. Dalton Transactions. 2002:2689–2696. doi: 10.1039/b400818a. [DOI] [PubMed] [Google Scholar]
- 25.Spasojević I, Batinić-Haberle I, Fridovich I. Nitric Oxide - Biology and Chemistry. 2000;4:526–533. doi: 10.1006/niox.2000.0303. [DOI] [PubMed] [Google Scholar]
- 26.Radi R. Chemical Research in Toxicology. 1998;11:720–721. doi: 10.1021/tx980096z. [DOI] [PubMed] [Google Scholar]
- 27.Ferrer-Sueta G, Hannibal L, Batinic-Haberle I, Radi R. Free Radical Biology and Medicine. 2006;41:503–512. doi: 10.1016/j.freeradbiomed.2006.04.028. [DOI] [PubMed] [Google Scholar]
- 28.Nadezhdin AD, Dunford HB. Canadian Journal of Chemistry. 1979;57:3017–3022. [Google Scholar]
- 29.Tovmasyan A, Weitner T, Roberts E, Vujaskovic Z, Leong KW, Spasojevic I, Batinic-Haberle I. Antioxid Redox Signal. 2013 submitted. [Google Scholar]
- 30.Jaramillo MC, Briehl MM, Crapo JD, Batinic-Haberle I, Tome ME. Antioxid Redox Signal. 2013 submitted. [Google Scholar]
- 31.Budimir A, Kalmar J, Fabian I, Lente G, Banyai I, Batinic-Haberle I, Birus M. Dalton Transactions. 2010;39:4405–4410. doi: 10.1039/b926522h. [DOI] [PubMed] [Google Scholar]
- 32.Weitner T, Budimir A, Kos I, Batinic-Haberle I, Birus M. Dalton Transactions. 2010;39:11568–11576. doi: 10.1039/c0dt00585a. [DOI] [PMC free article] [PubMed] [Google Scholar]
- 33.Harriman A, Porter G. Faraday Transactions. 1979:1532–1542. [Google Scholar]
- 34.Harriman A. Dalton Transactions. 1984:141–146. [Google Scholar]
- 35.Tovmasyan A, Weitner T, Sheng H, Lu M, Rajic Z, Warner DS, Spasojevic I, Reboucas JS, Benov L, Batinic-Haberle I. Inorganic Chemistry. 2013;52:5677–5691. doi: 10.1021/ic3012519. [DOI] [PMC free article] [PubMed] [Google Scholar]
- 36.Groves JT, Lee J, Marla SS. Journal of the American Chemical Society. 1997;119:6269–6273. [Google Scholar]
- 37.De Angelis F, Jin N, Car R, Groves JT. Inorg Chem. 2006;45:4268–4276. doi: 10.1021/ic060306s. [DOI] [PubMed] [Google Scholar]
- 38.Lahaye D, Groves JT. Journal of Inorganic Biochemistry. 2007;101:1786–1797. doi: 10.1016/j.jinorgbio.2007.07.017. [DOI] [PubMed] [Google Scholar]
- 39.Jin N, Bourassa JL, Tizio SC, Groves JT. Angewandte Chemie International Edition. 2000;39:3849–3851. doi: 10.1002/1521-3773(20001103)39:21<3849::AID-ANIE3849>3.0.CO;2-0. [DOI] [PubMed] [Google Scholar]
- 40.Adams R. Electrochemistry at Solid Electrodes. Marcel Dekker; New York: 1969. [Google Scholar]
- 41.Yin H, Ma Q, Zhou Y, Ai S, Zhu L. Electrochimica Acta. 2010;55:7102–7108. [Google Scholar]
- 42.Konopka SJ, McDuffie B. Analytical Chemistry. 1970;42:1741–1746. [Google Scholar]
- 43.Rudolph M. 4.0. ElchSoft; Am Kötschauer Weg 7, 99510 Kleinromstedt, Germany: 2006. [Google Scholar]
- 44.Nicholson RS, Shain I. Analytical Chemistry. 1964;36:706–723. [Google Scholar]
- 45.Paul HJ, Leddy J. Analytical Chemistry. 1995;67:1661–1668. [Google Scholar]
- 46.Evans DH, O’Connell KM, Petersen RA, Kelly MJ. Journal of Chemical Education. 1983;60:290. [Google Scholar]
- 47.Nicholson RS. Analytical Chemistry. 1965;37:1351–1955. [Google Scholar]
- 48.Bard AJ, Faulkner LR. Electrochemical methods - Fundamentals and Applications. John Wiley & Sons, Inc; New York: 2001. [Google Scholar]
- 49.Budimir A, Šmuc T, Weitner T, Batinic-Haberle I, Biruš M. Journal of Coordination Chemistry. 2010;63:2750–2765. [Google Scholar]
- 50.Laviron E. Journal of Electroanalytical Chemistry. 1983;146:1–13. [Google Scholar]
- 51.Laviron E. Journal of Electroanalytical Chemistry. 1983;146:15–36. [Google Scholar]
- 52.Laviron E. Journal of Electroanalytical Chemistry. 1981;130:23–29. [Google Scholar]
- 53.Laviron E. Journal of Electroanalytical Chemistry. 1981;124:1–7. [Google Scholar]
- 54.Laviron E. Journal of Electroanalytical Chemistry. 1981;124:9–17. [Google Scholar]
- 55.Bates RG. In: Treatise on Analytical Chemistry, Part I. 2. Kolthoff IM, Elving PJ, editors. Vol. 1. Wiley; New York: 1978. p. 793. [Google Scholar]
- 56.Trassati S. Pure and Applied Chemistry. 1986;58:955–966. [Google Scholar]
- 57.Fang Z, Zhang H, Zhang P, Huang S, Guo L, Hu G. Acta Metallurgica Sinica. 1996;9:189–192. [Google Scholar]
- 58.Anson FC, Osteryoung RA. Journal of Chemical Education. 1983;60:293–296. [Google Scholar]
- 59.Sucheta A, Rusling JF. Electroanalysis. 1991;3:735–739. [Google Scholar]
- 60.Einstein A. Annalen der Physik. 1905;322:549–560. [Google Scholar]
- 61.Jones G, Christian SM. Journal of the American Chemical Society. 1937;59:484–486. [Google Scholar]
- 62.Sutherland W. Philosophical Magazine Series 6. 1905;9:781–785. [Google Scholar]
- 63.Lide DR, editor. CRC Handbook of Chemistry and Physics. CRC Press; 2005. [Google Scholar]
- 64.Muller P. Pure and Applied Chemistry. 1994;66:1077–1184. [Google Scholar]
- 65.Dean JA. Lange’s Handbook of Chemistry. McGraw-Hill, Inc; New York: 1999. [Google Scholar]
- 66.Gray GW, Spence JT. Inorganic Chemistry. 1971;10:2751–2755. [Google Scholar]
- 67.Ball EG. Journal of Biological Chemistry. 1937;118:219–239. [Google Scholar]
- 68.Saveant JM. Energy & Environmental Science. 2012;5:7718–7731. doi: 10.1039/C4EE01709A. [DOI] [PMC free article] [PubMed] [Google Scholar]
- 69.Atkins PW. Physical Chemistry. Oxford University Press; Oxford: 1998. [Google Scholar]
- 70.Kos I, Reboucas JS, DeFreitas-Silva G, Salvemini D, Vujaskovic Z, Dewhirst MW, Spasojevic I, Batinic-Haberle I. Free Radical Biology and Medicine. 2009;47:72–78. doi: 10.1016/j.freeradbiomed.2009.04.002. [DOI] [PMC free article] [PubMed] [Google Scholar]
- 71.Abe T. The Journal of Physical Chemistry. 1986;90:713–715. [Google Scholar]
- 72.Bashford D, Case DA. Annual Review of Physical Chemistry. 2000;51:129–152. doi: 10.1146/annurev.physchem.51.1.129. [DOI] [PubMed] [Google Scholar]
- 73.Bucher M, Porter TL. The Journal of Physical Chemistry. 1986;90:3406–3411. [Google Scholar]
- 74.Koneshan S, Rasaiah JC, Lynden-Bell RM, Lee SH. The Journal of Physical Chemistry B. 1998;102:4193–4204. [Google Scholar]
- 75.Spasojevic I, Kos I, Benov LT, Rajic Z, Fels D, Dedeugd C, Ye X, Vujaskovic Z, Reboucas JS, Leong KW, Dewhirst MW, Batinic-Haberle I. Free Radical Research. 2010;45:188–200. doi: 10.3109/10715762.2010.522575. [DOI] [PMC free article] [PubMed] [Google Scholar]
- 76.Evans DH. Journal of Electroanalytical Chemistry and Interfacial Electrochemistry. 1989;258:451–456. doi: 10.1016/0302-4598(87)85005-5. [DOI] [PMC free article] [PubMed] [Google Scholar]
- 77.Valez V, Cassina A, Batinic-Haberle I, Kalyanaraman B, Ferrer-Sueta G, Radi R. Archives of Biochemistry and Biophysics. 2013;529:45–54. doi: 10.1016/j.abb.2012.10.012. [DOI] [PMC free article] [PubMed] [Google Scholar]
- 78.Koppenol WH. Free Radical Biology and Medicine. 1998;25:385–391. doi: 10.1016/s0891-5849(98)00093-8. [DOI] [PubMed] [Google Scholar]
Associated Data
This section collects any data citations, data availability statements, or supplementary materials included in this article.


